


Bitcoin (BTC) increased considerably on July 21, creating a bullish engulfing candlestick and reaching a high of $32,858.
BTC is following a shorter-term descending resistance line. If it can break out above this line, it could be the catalyst for a sharp upward move.
BTC reclaims range
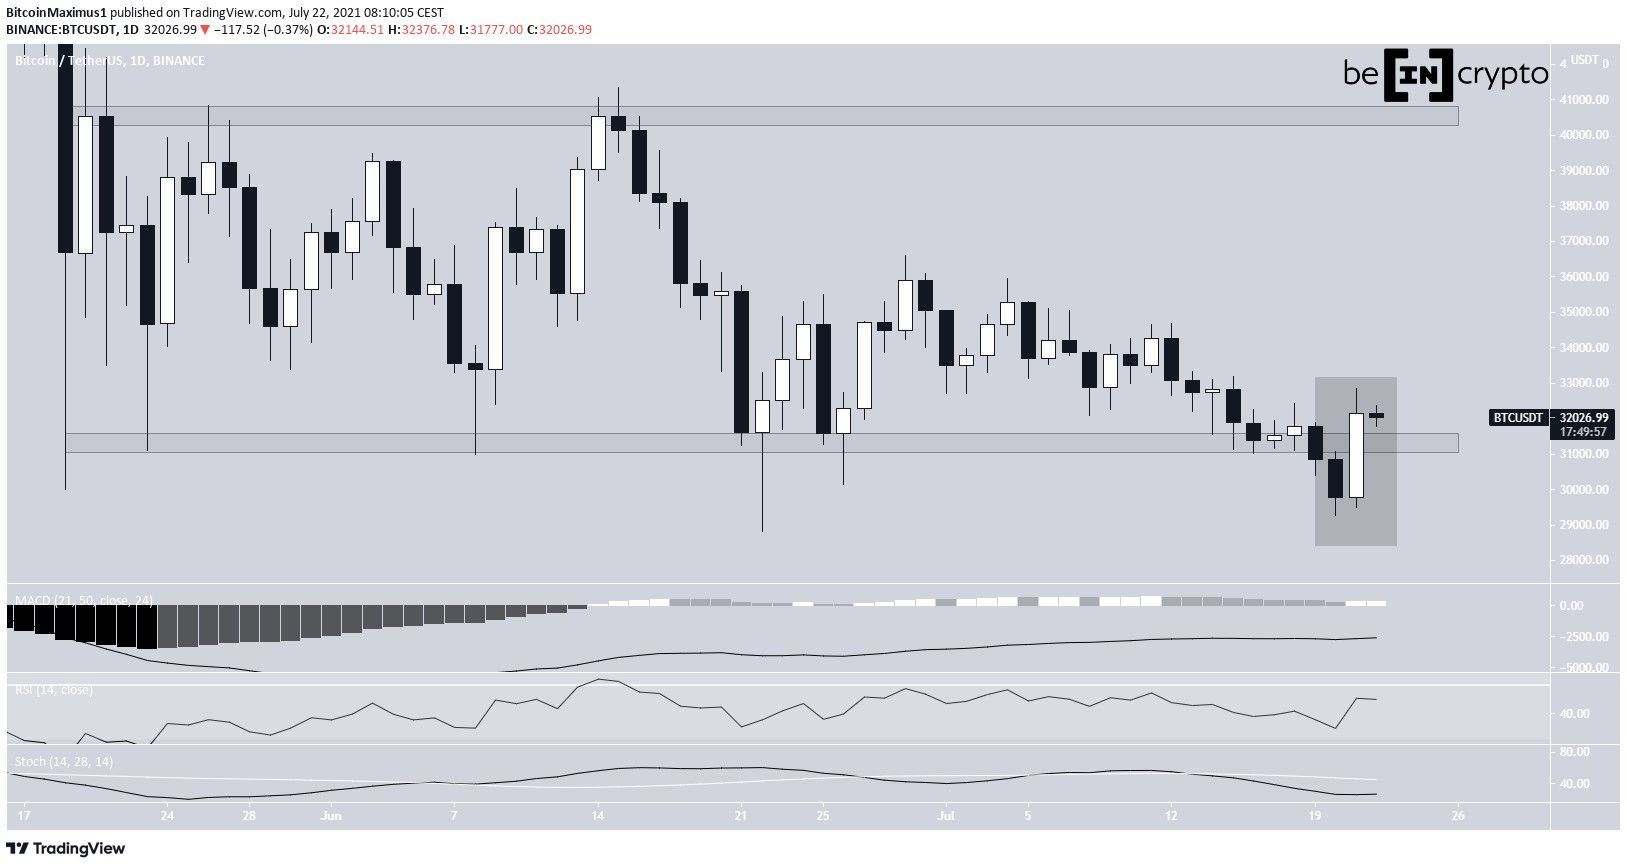
BTC increased significantly on July 21. After falling to a low of $29,278, it began a rapid upward move that led to a high of $32,858.
This created a bullish engulfing candlestick. In addition, it reclaimed the $31,300 horizontal support area that previously had been in place since May 19. This is a bullish development since the area is now expected to act as support again.
However, technical indicators have not turned bullish yet.
The range high is found at $40,550.
Future movement
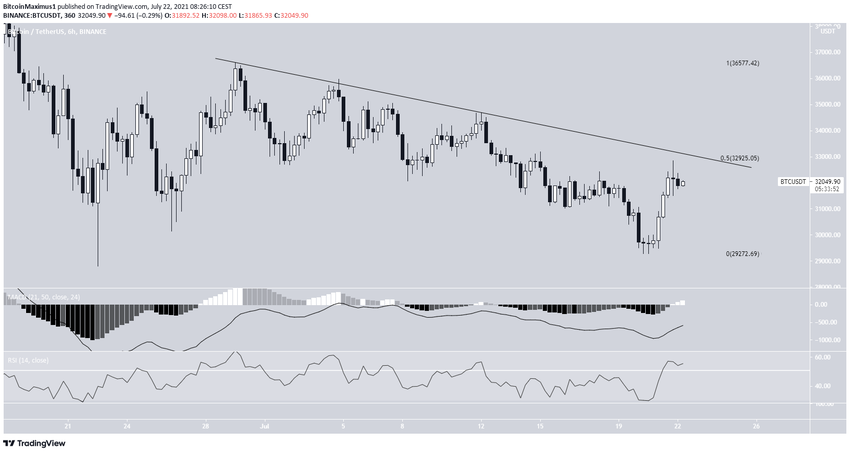
The six-hour chart shows that BTC has been following a descending resistance line since June 29.
On July 21, it was rejected by this resistance as well as the 0.5 Fib retracement resistance level at $32,925.
If it can move back above this line/level, it’s likely to move upwards at an accelerated rate due to the lack of overhead resistance.
The MACD and RSI are both moving upwards. The latter is above 50 while the former is close to crossing into positive territory.
Wave count
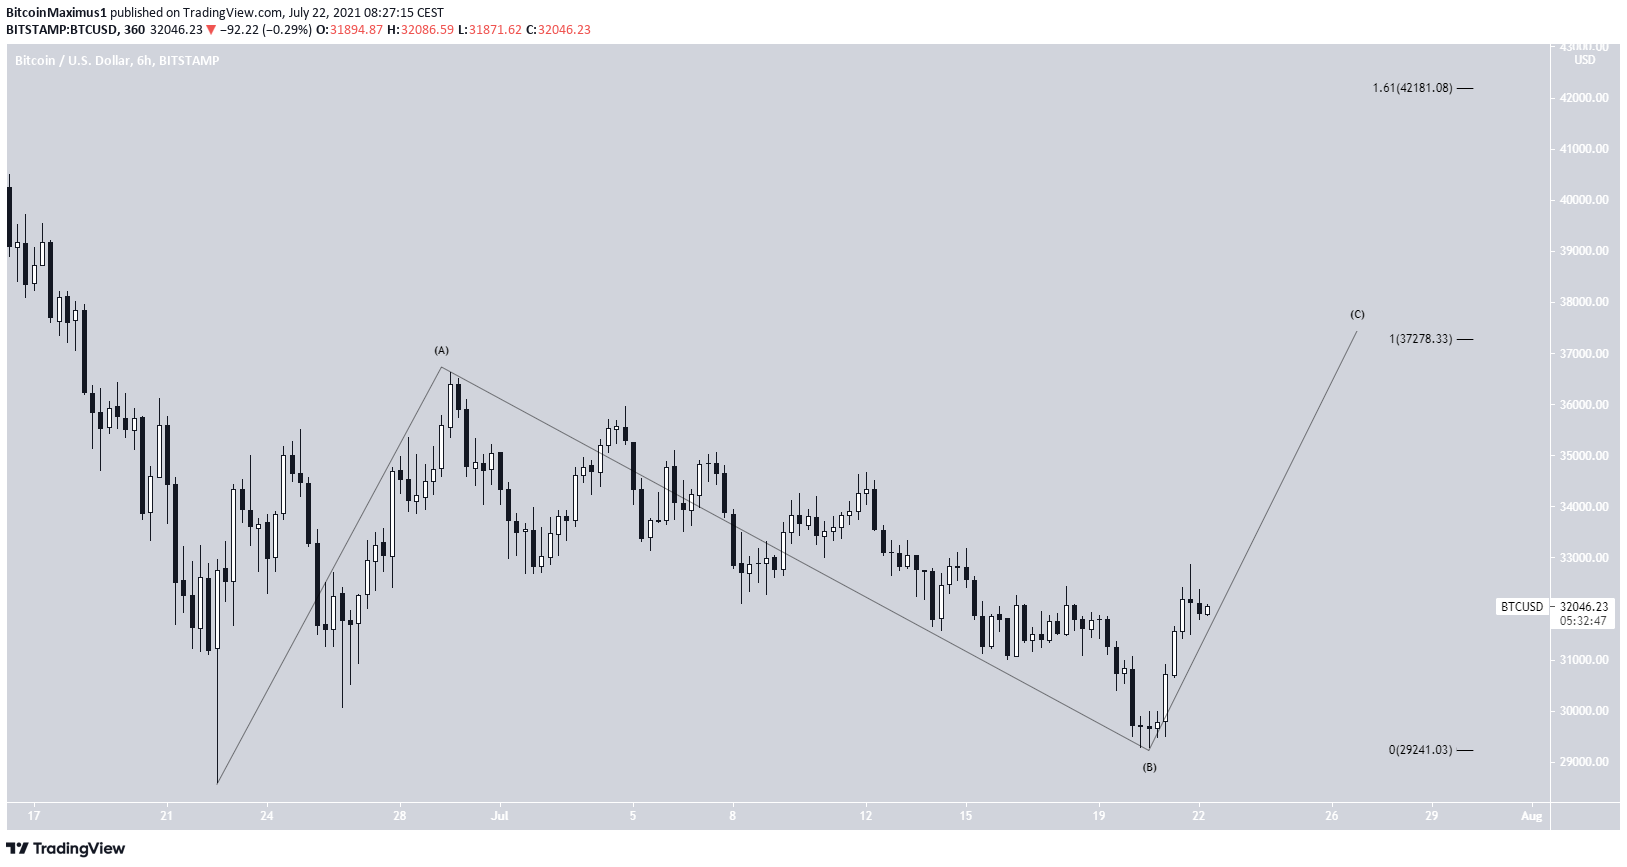
The wave count indicates that BTC is currently in the C wave of a longer-term A-B-C corrective structure.
The two most likely levels for the top of the upward move are at $37,278 and $42,181. The first target gives waves A:C a 1:1 ratio while the second gives them a 1:1.61 ratio.
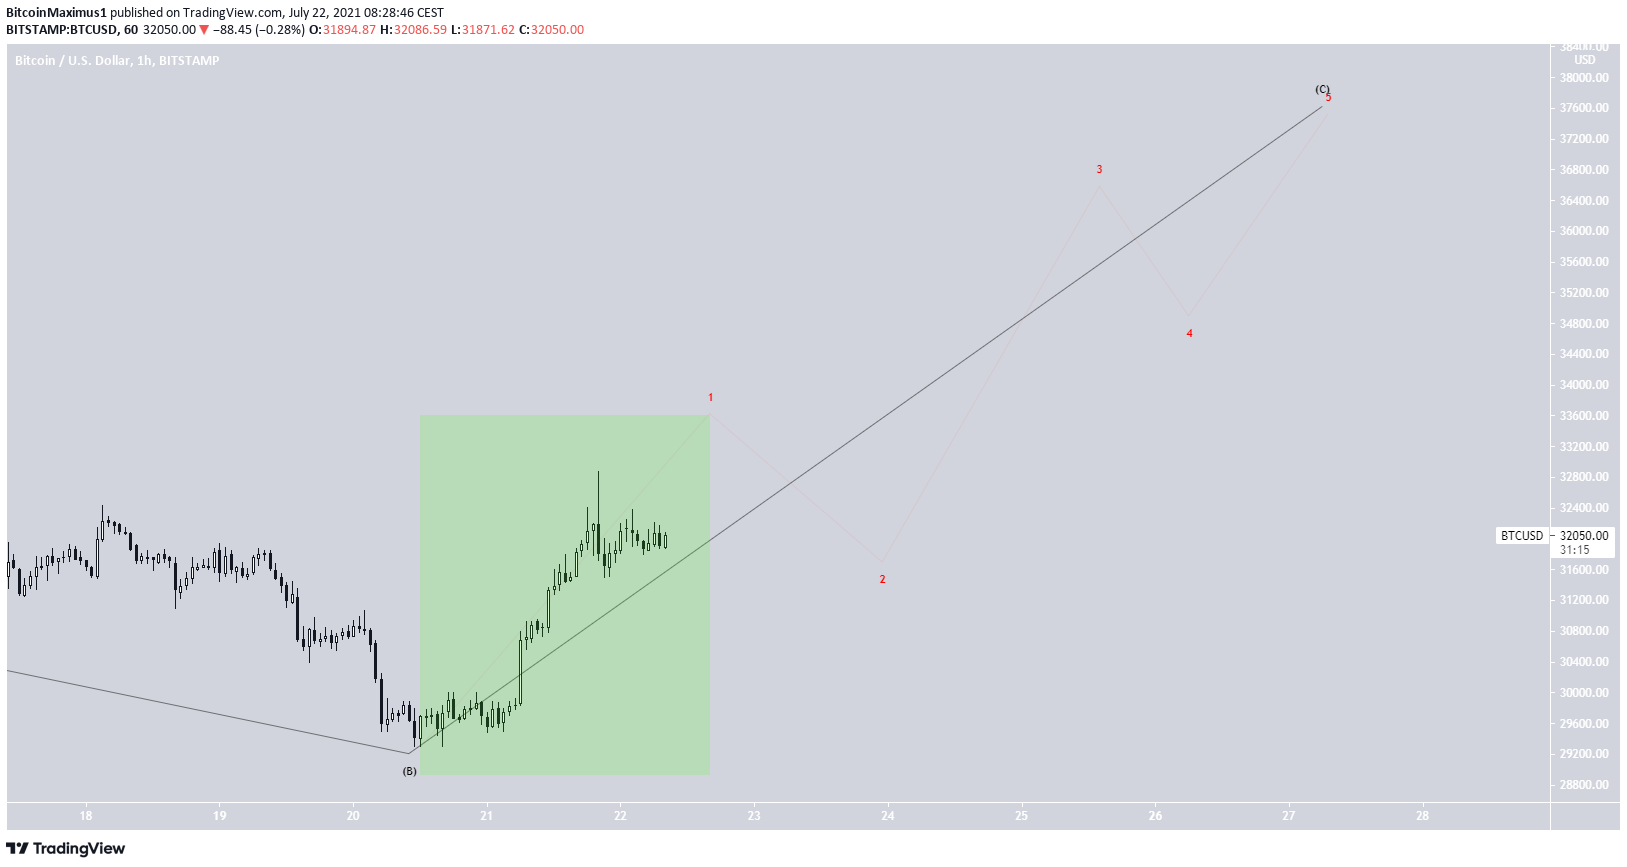
The upward move looks impulsive (highlighted in green), increasing the likelihood that it could be a C wave. The sub-wave count is shown in red.
For BeInCrypto’s latest bitcoin (BTC) analysis, click here.


