


The Book of Meme (BOME) price exhibits strong potential for growth, indicated by its RSI 1D near the overbought territory at 70, signaling robust buying interest. With the ADX at 46, the strength of the current uptrend suggests further increases. A golden cross in the EMA Lines also supports a bullish outlook.
These factors combined point towards a continued upward movement for the BOME price, backed by compelling technical indicators of an enduring positive trend.
Book of Meme 1D RSI Shows Room for Growth
The BOME 1D Relative Strength Index (RSI) currently stands at 70.6, marking a slight decline from yesterday’s 75.5. Notably, the RSI lingered between 89 and 91 during the latter half of March, a period when the BOME price exhibited sideways movement.
The RSI, a momentum oscillator that measures the speed and change of price movements, operates on a scale from 0 to 100. Traditionally, an RSI above 70 suggests an asset is overbought, while below 30 indicates it is oversold.
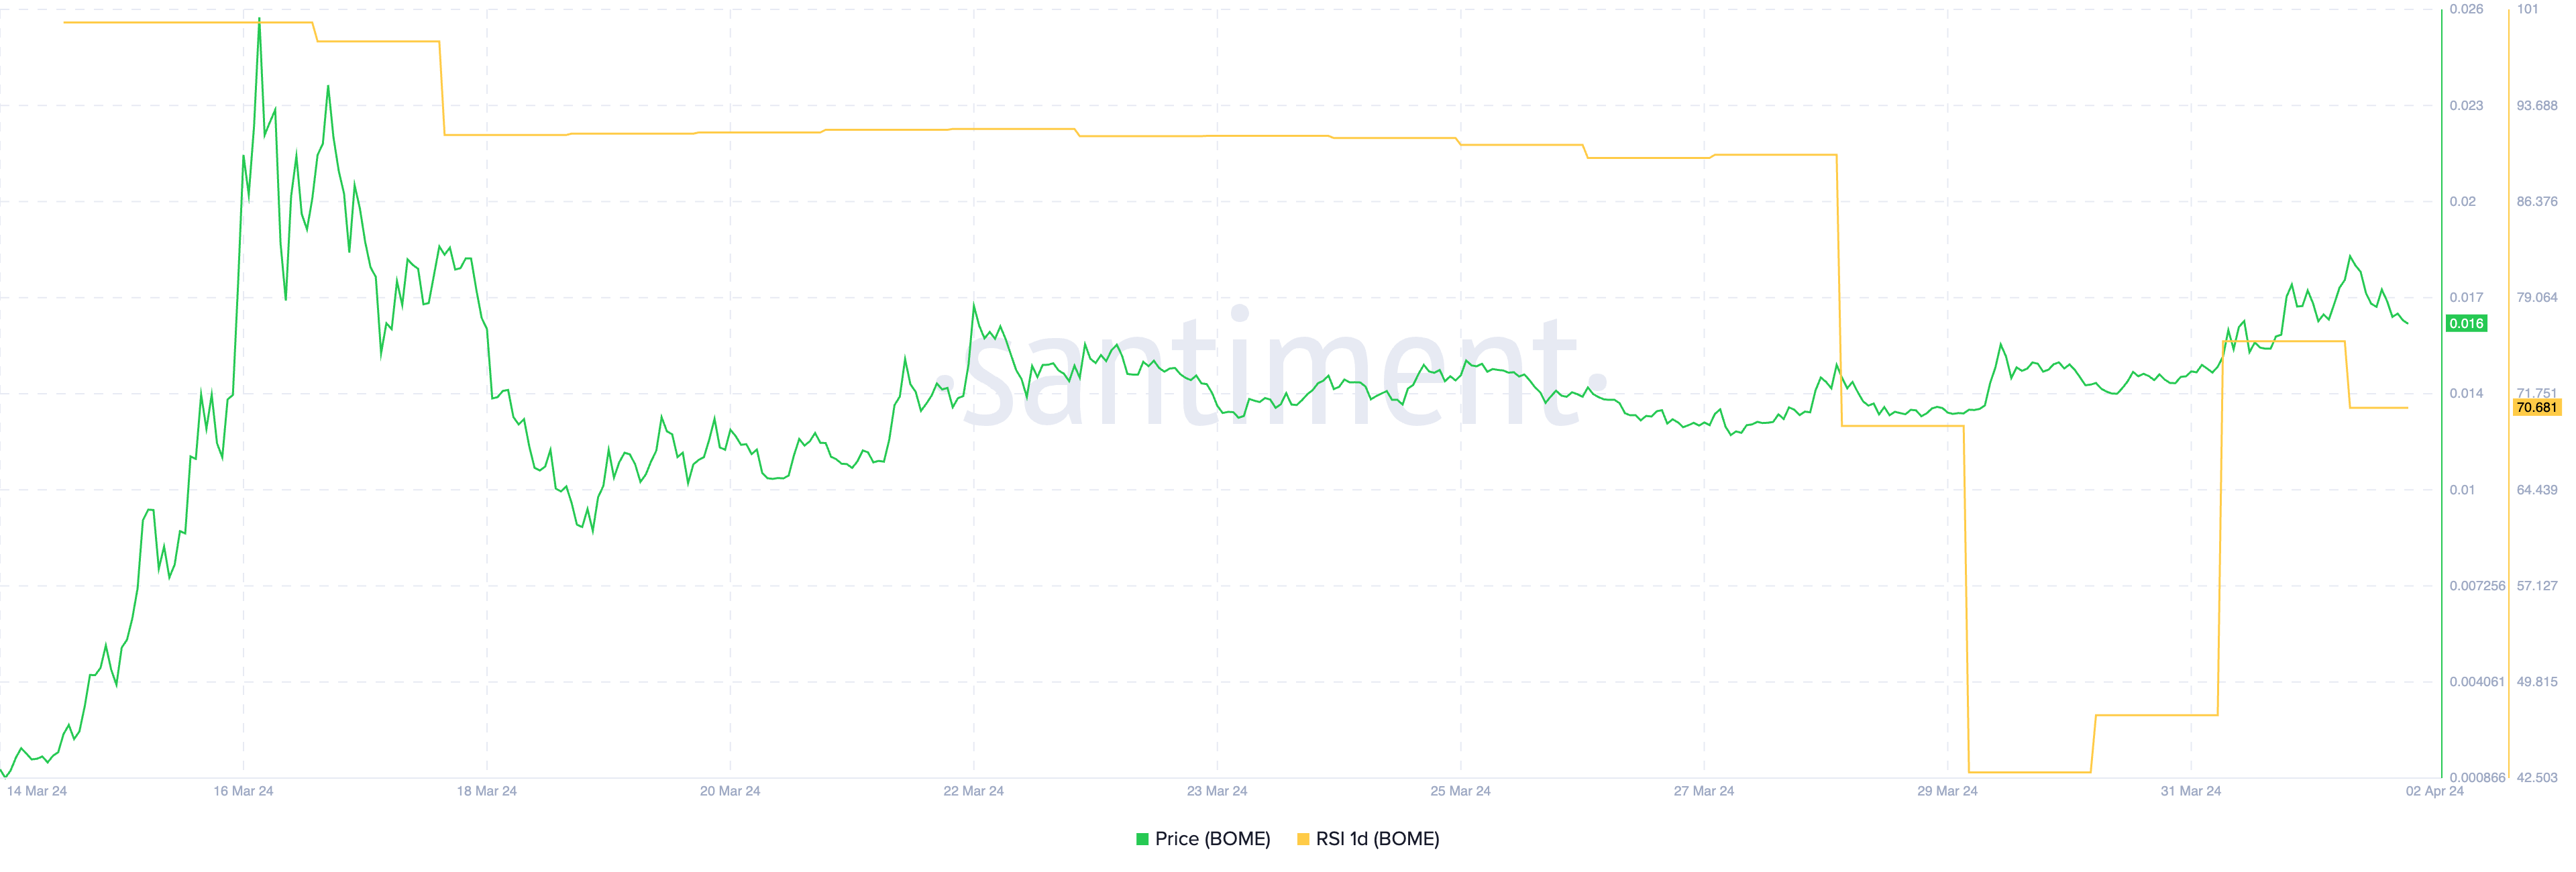
An RSI at 70.6 for BOME can be seen as bullish, as it demonstrates significant buying interest among users. This level indicates that the asset is on the cusp of being overbought. This condition often precedes a continuation of upward price momentum in the absence of other bearish signals.
During the second half of March, even higher RSI values did not precipitate a significant price correction, suggesting that BOME’s current RSI level might similarly signal enduring buying pressure rather than an imminent reversal.
Read More: 10 Best Crypto Exchanges and Apps for Beginners in 2024
ADX Shows the Current Trend Is Strong
BOME is currently showcasing a robust uptrend, with its Average Directional Index (ADX) at 46. This level signifies a strong trend, as detailed further below. The ADX is a technical analysis indicator used to quantify the strength of a trend without considering its direction.
It operates on a scale from 0 to 100, where values below 20 indicate a weak or absent trend, values between 20 and 25 suggest a forming trend, and anything above 25 is considered strong. Values exceeding 40 are rare and signal a very powerful trend.
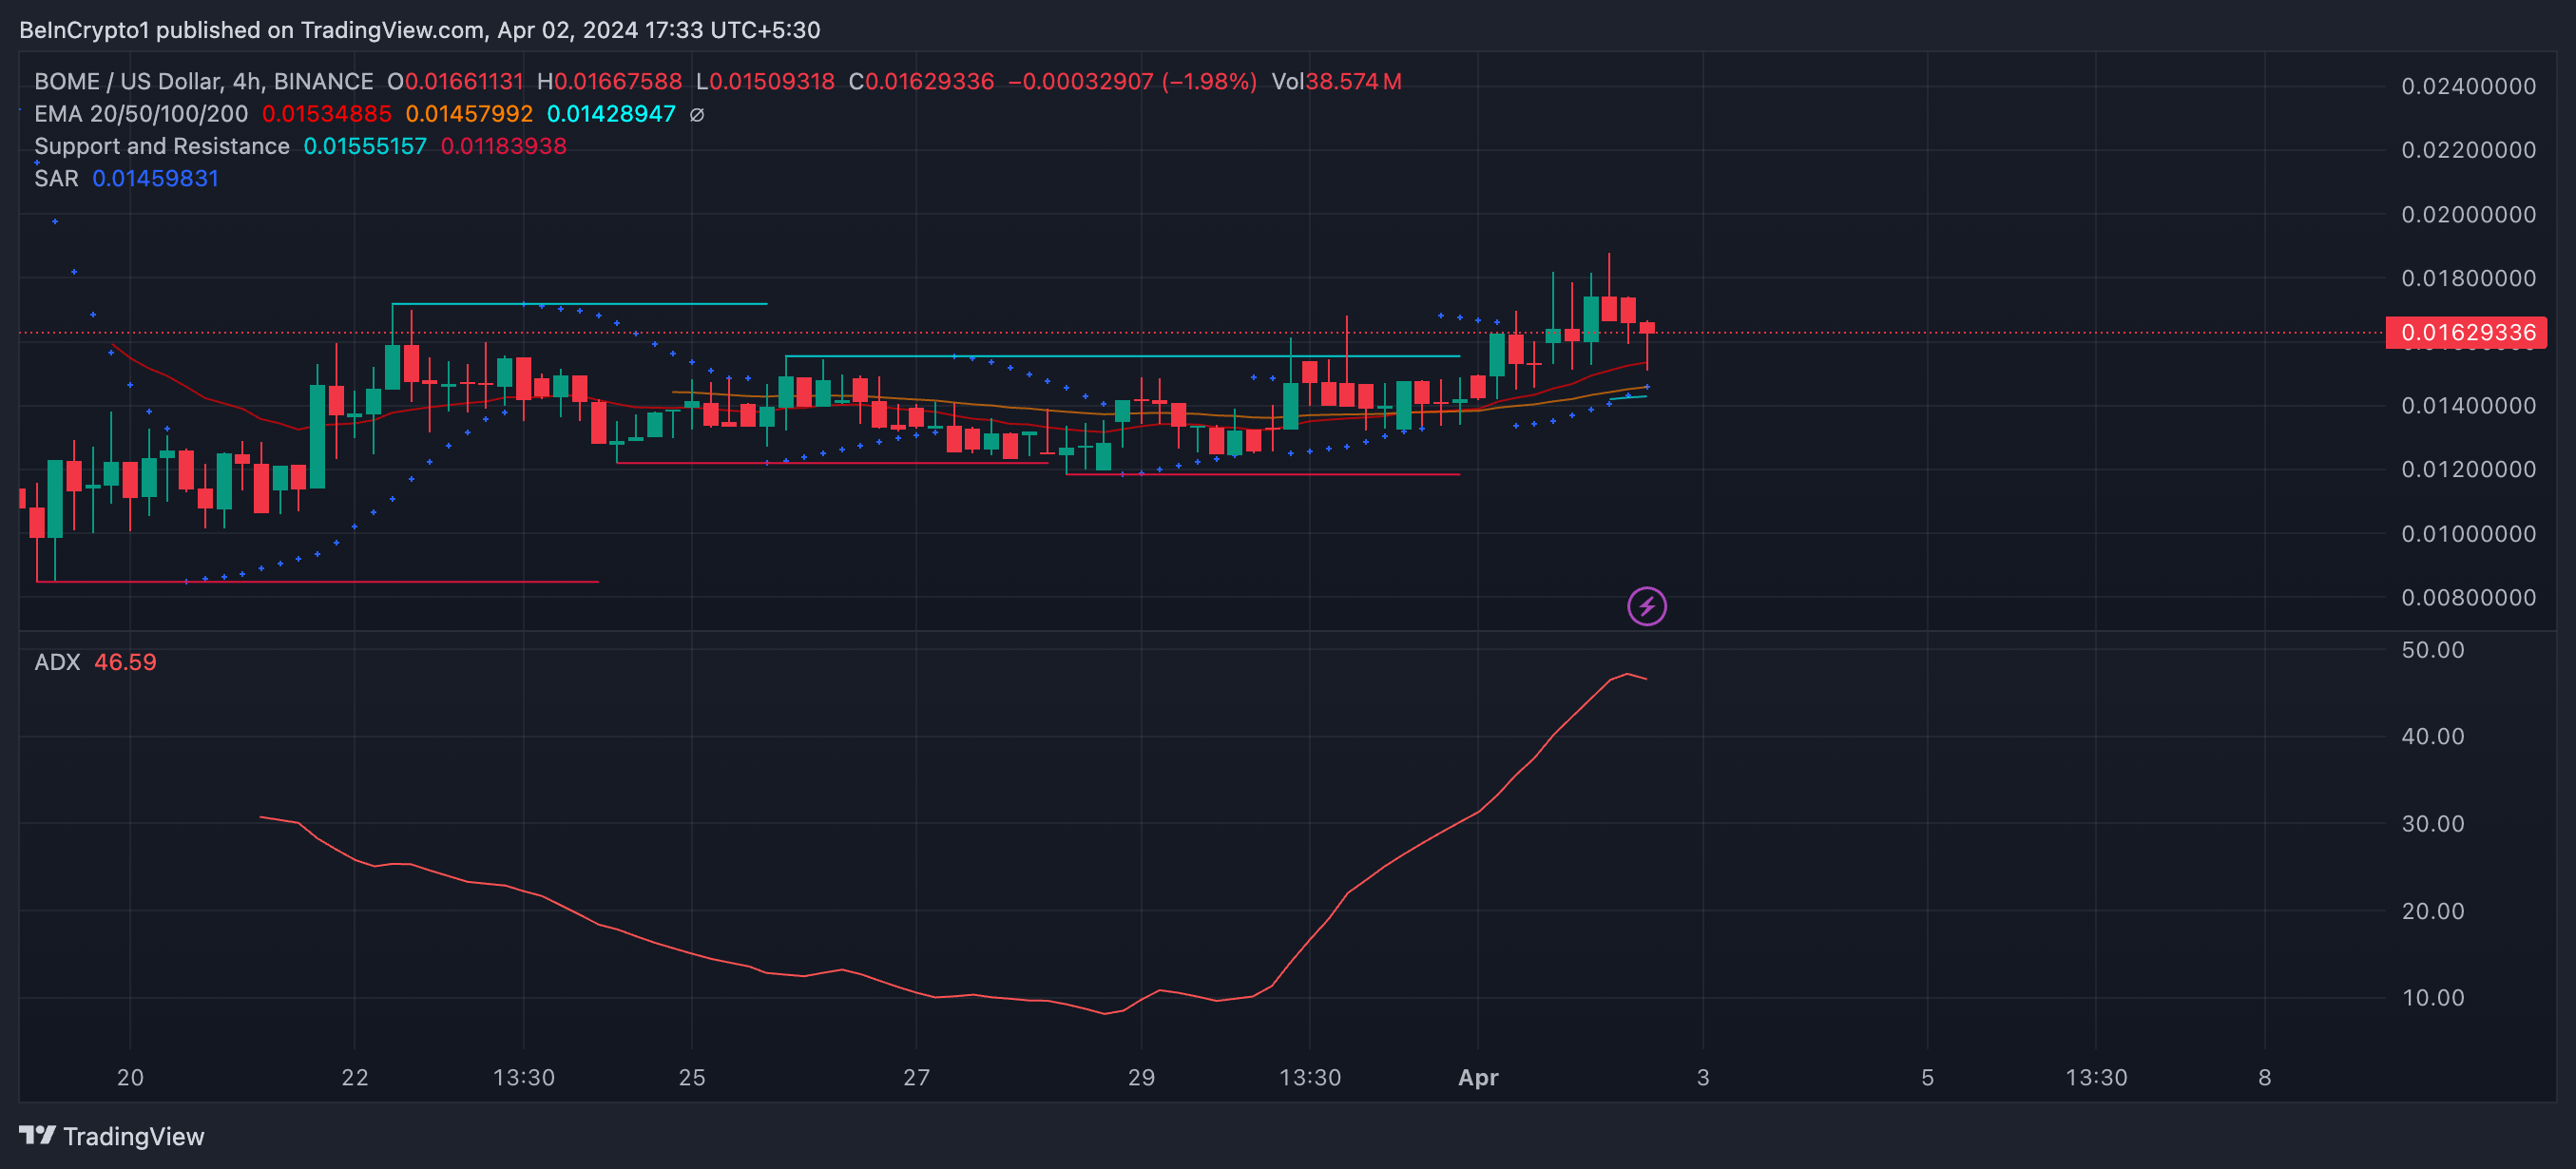
BOME’s ADX soared from 9.8 on March 24 to 46.4 by April 2, indicating a significant shift in market momentum. This increase is noteworthy. An ADX exceeding 25 usually denotes a strong trend, while hitting 46 signifies an exceptionally robust trend.
This surge suggests not just a trend’s presence but its overwhelming strength. It may signal the beginning of a new bull run for BOME.
BOME Price Prediction: A New All-Time High In April?
The BOME price exhibits potential for a new bull run, indicated by a golden cross on its 4-hour (4H) price chart that formed on March 31. A golden cross occurs when a shorter-term moving average crosses above a longer-term moving average.
This event is considered a bullish sign because it suggests a shift in momentum where short-term prices start to exceed long-term averages, often leading to sustained upward movement. The increasing distance between the two lines further reinforces the strength of this trend.
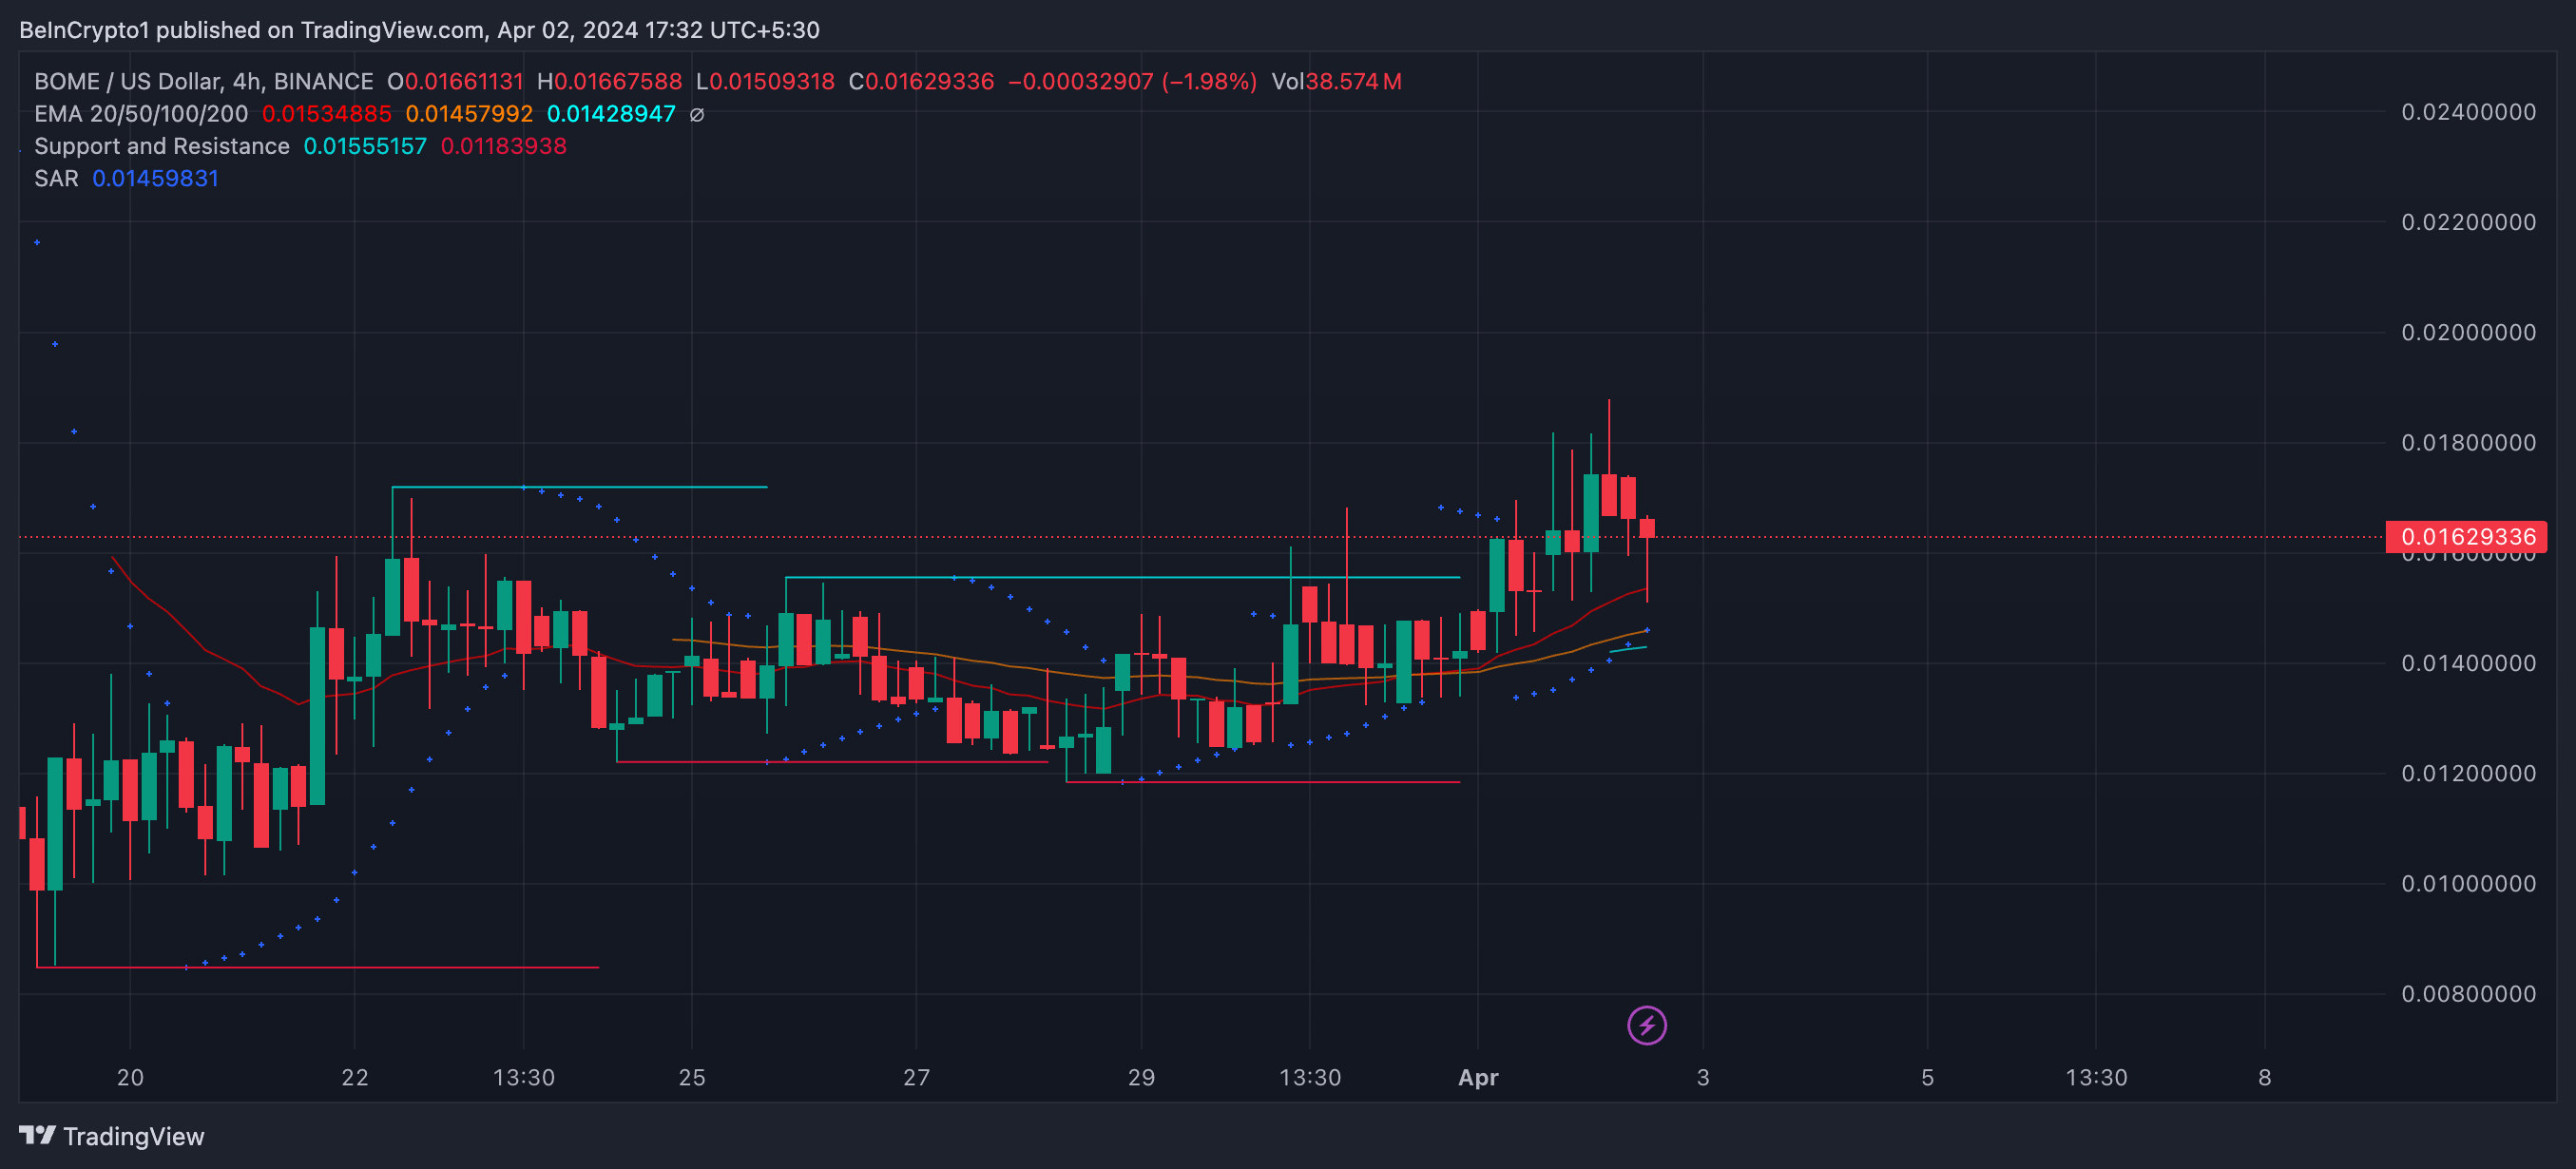
EMA lines, known as Exponential Moving Averages, prioritize recent price data, making them highly responsive to market changes. They play a vital role in recognizing trends and potential reversals. With a golden cross formed by EMA lines and a strong trend indicated by the Average Directional Index (ADX), there’s a strong likelihood of BOME’s price surging in the near future.
Read More: How to Buy Book Of Meme (BOME) And Everything Else To Know
This upward momentum could propel BOME past its previous all-time high (ATH) of $0.0268. Conversely, if a downtrend emerges, BOME’s price might plummet to $0.0118, marking a significant correction from its potential peak.
