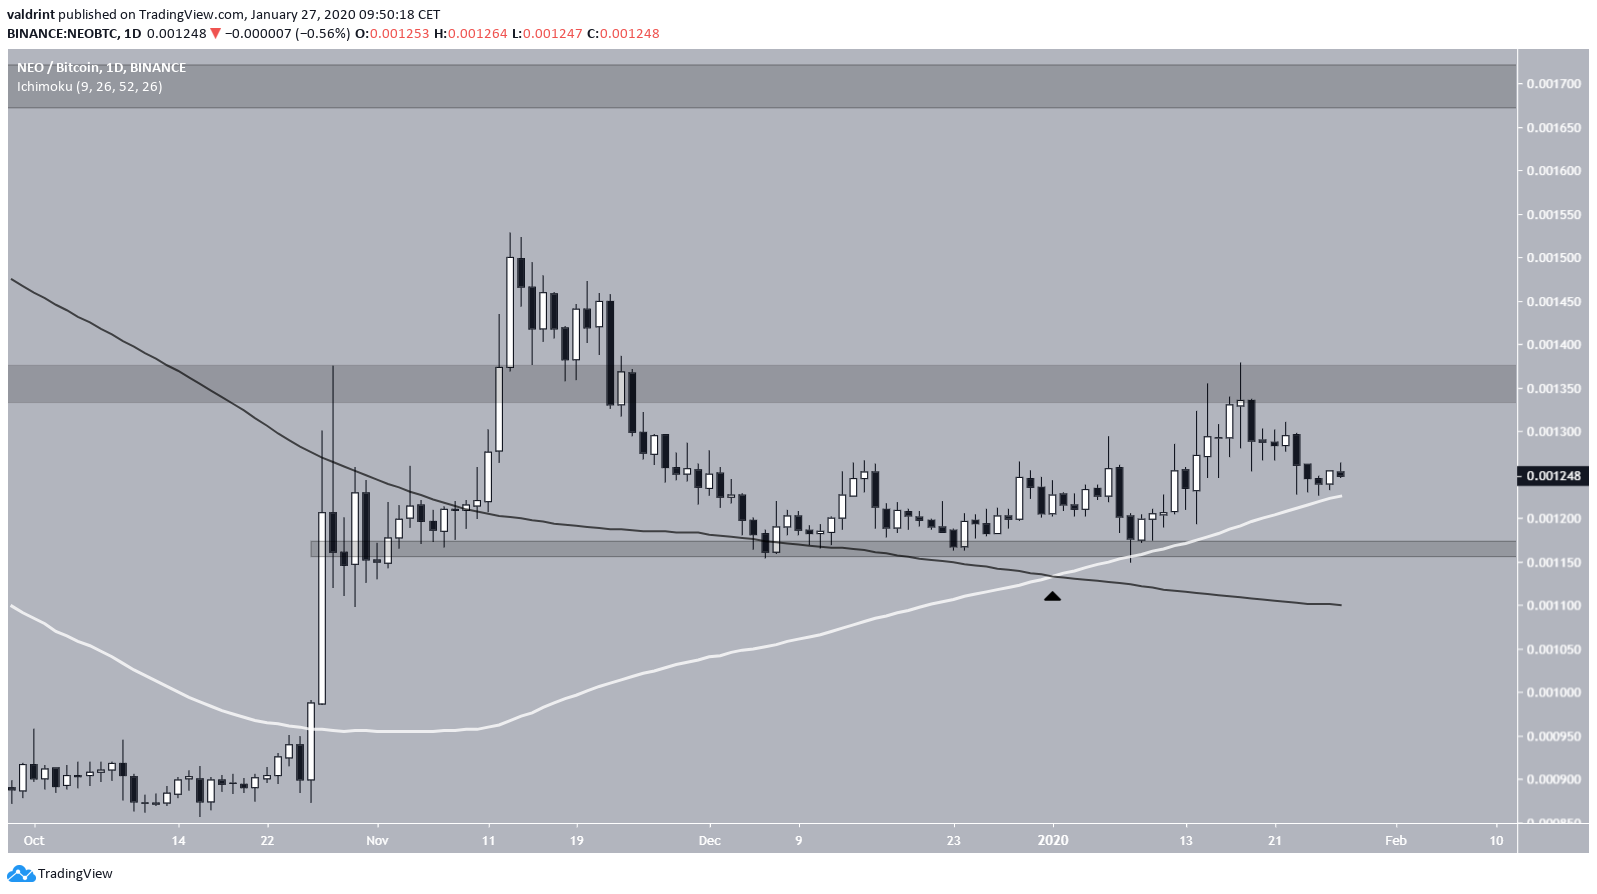
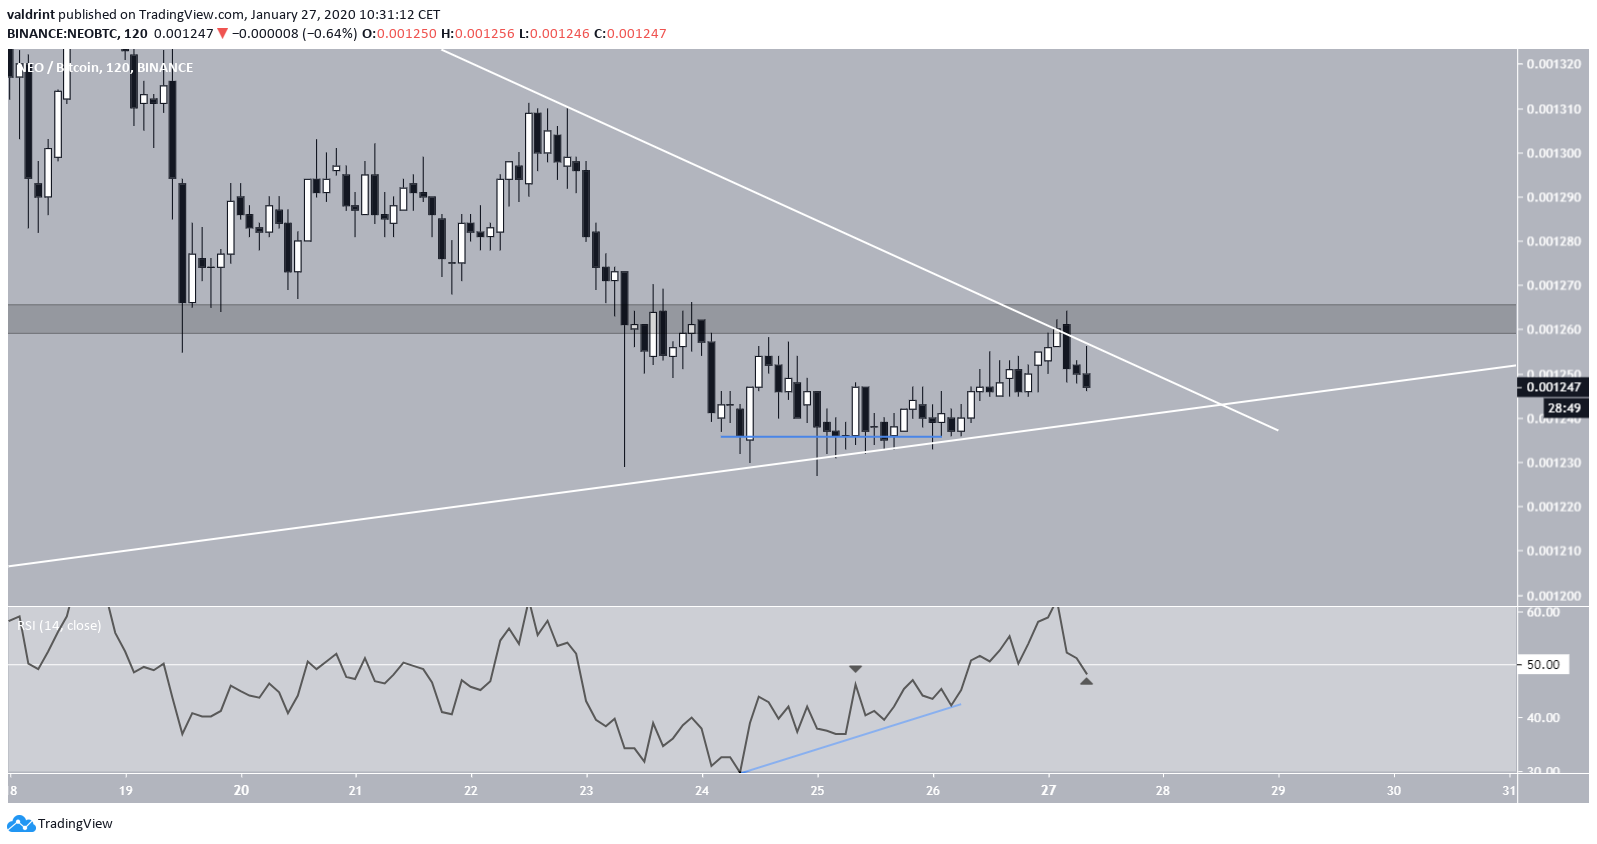
The NEO price is trading inside a short-term symmetrical triangle. It looks poised to soon break out from this triangle and head towards the previous highs at ₿0.0135, and possibly higher.
NEO Highlights
- The 100 and 200-day moving averages (MA) have made a bullish cross.
- The price is trading in a short-term symmetrical triangle.
- There is resistance at ₿0.0135 and ₿0.017.
- There is support at ₿0.0116.
$NEO || $BTC Binance x @Altcointraders_
— CryptoAmsterdam (@damskotrades) January 27, 2020
Felt back into the bidzone.
Looking for a higher low to form here and a reclaim of the support/resistance to take off pic.twitter.com/vxiXz2fjbt
Current Movement
The NEO price initiated an upward move on Oct 24, 2019, that eventually lead to a high of ₿0.0152 on Nov 13, but has been decreasing since. Since December of the same year, the price has stayed above ₿0.0116 and created a support area near that level. NEO began to move upward at the beginning of 2020, aided by a bullish cross between the 100 and 200-day moving averages (MA), the former of which is offering close support to the price. The closest major resistance area is found at ₿0.0135. If the price is successful in moving above it, NEO would likely head to the November high or even the previous breakdown level, found at ₿0.017.
Ascending Support
In the shorter-term, we can see that NEO has been trading inside a symmetrical triangle since Jan 8, currently being very close to the projected end of the triangle. Going from the analysis from the previous section, it is likely that the price will indeed break out. This is aided by the shorter-term cross of the 25 and 50-day MAs. The ₿0.0126 resistance level is the one outlined in the tweet. If the price breaks out, it would make a higher-low above this level, likely validating it as support. This possible breakout is supported by the short-term RSI, which has generated bullish divergence and completed a failure swing bottom.
This further suggests that the price will soon break out and head towards the previous highs. An RSI movement above 50 would confirm this possibility.
 To conclude, the NEO price is trading inside a symmetrical triangle out of which it looks eager to break out of. The closest resistance areas are found at ₿0.00135 and ₿0.0017.
Disclaimer
In line with the Trust Project guidelines, this price analysis article is for informational purposes only and should not be considered financial or investment advice. BeInCrypto is committed to accurate, unbiased reporting, but market conditions are subject to change without notice. Always conduct your own research and consult with a professional before making any financial decisions. Please note that our Terms and Conditions, Privacy Policy, and Disclaimers have been updated.

Valdrin Tahiri
Valdrin discovered cryptocurrencies while he was getting his MSc in Financial Markets from the Barcelona School of Economics. Shortly after graduating, he began writing for several different cryptocurrency related websites as a freelancer before eventually taking on the role of BeInCrypto's Senior Analyst.
(I do not have a discord and will not contact you first there. Beware of scammers)
READ FULL BIO
Sponsored
Sponsored

