


The NEO price is trading inside a significant resistance area, a breakout above which could rapidly accelerate the rate of increase.
However, the short-term outlook suggests that this is unlikely and that the price will decrease towards $9 instead.
Full-time trader @CryptoMichNL tweeted out a chart of the NEO price, stating that the current movement resembles a bearish retest, after which a price decrease often follows.
Using the $USD pair for this one. Looks like a bearish retest to me.
If we can't climb above this level in the next few days, I'd be expecting a retest of $8,50 or $7,80.
Similar to $ETH, which is also hovering against resistance. pic.twitter.com/OmYUzyVm2o
— Michaël van de Poppe (@CryptoMichNL) January 13, 2020
Let’s take a closer look at the NEO price and see where it will head to next.
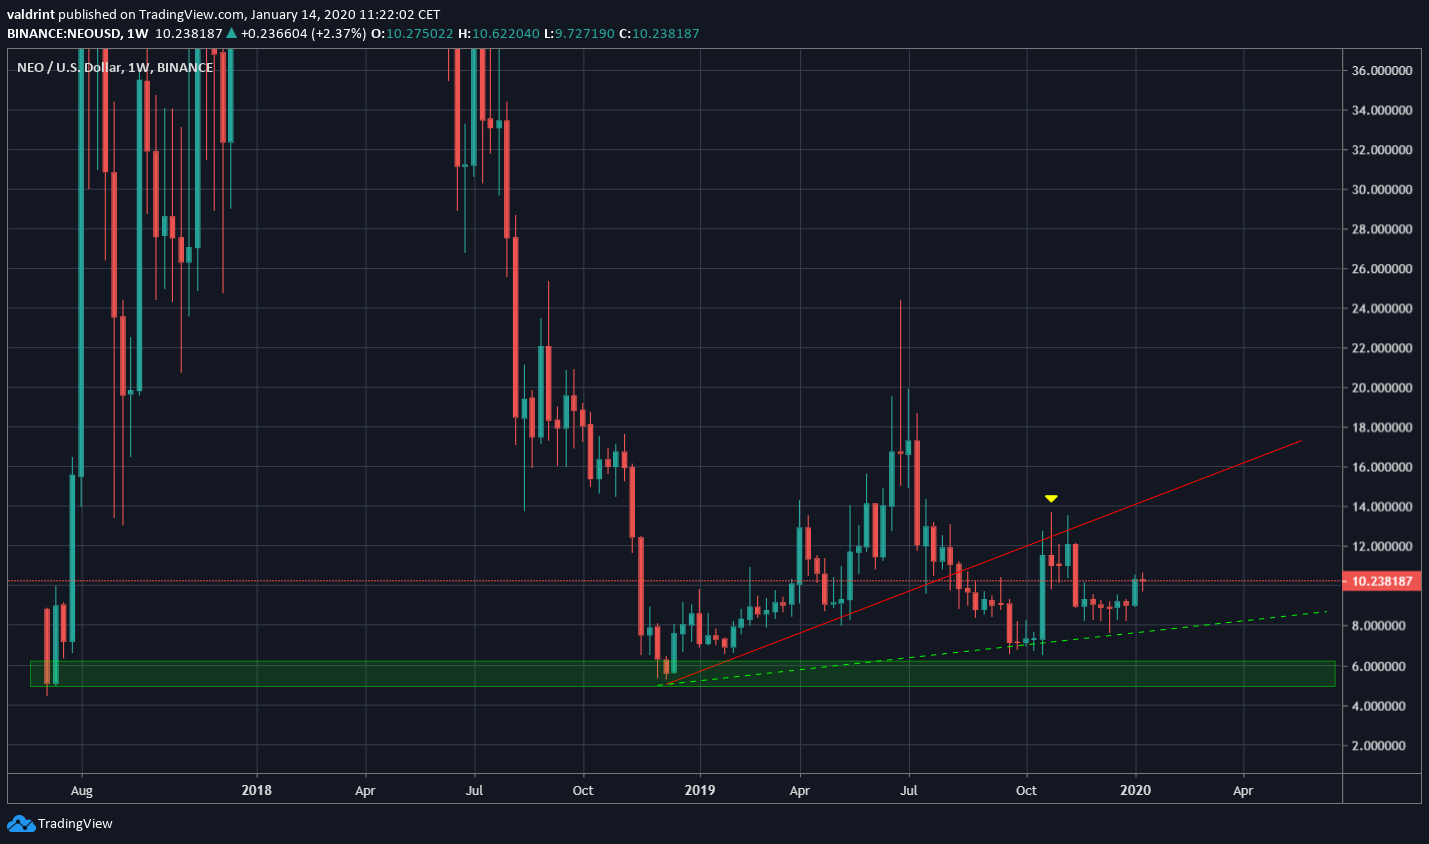
Long-Term Movement
On December 10, 2019, the NEO price reached a low of $5.32 and began an upward move. The price reached a high of $24.1 before decreasing.
The decrease caused the price to break down below the ascending support line and validate it as resistance on October 16. Therefore, we can consider this the first bearish retest, even though it has transpired in a different time-frame than that outlined in the tweet.
However, the price has made two higher lows since, making it possible that the price is following a different, more gradual sloping ascending support line (dashed).
The main support area is found between $5.5-$6, a breakdown below which could take NEO to new lows. As of right now, we do not think that is likely.
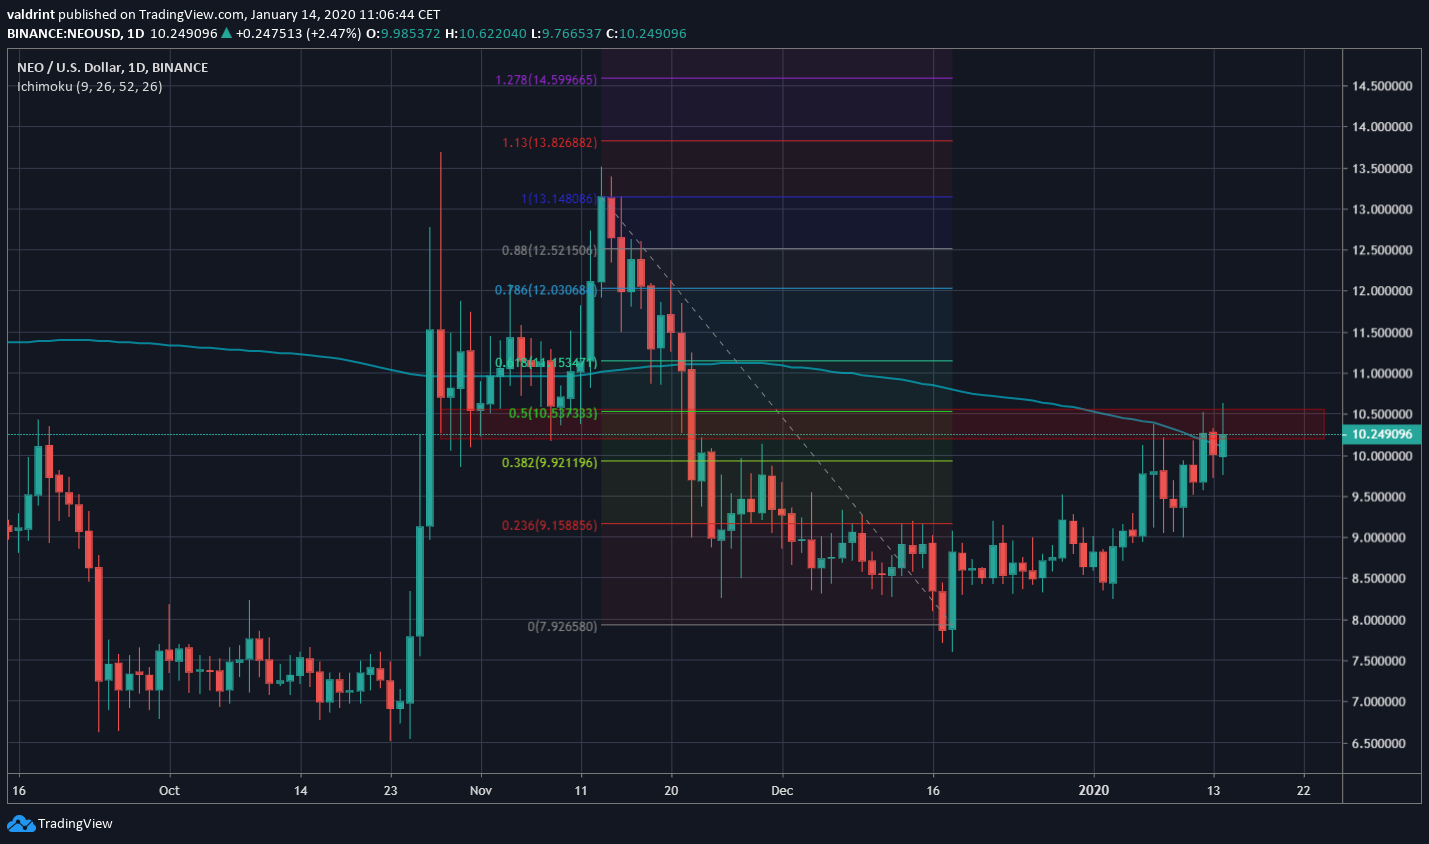
Bearish Retest
In the medium-term, the main resistance area is found at $10.5. Since this area acted as support at the beginning of November, the current price movement is a bearish retest of the area.
Further strengthening this claim, the resistance area coincides with the 0.5 fib level of the entire decrease and the 200-day moving average (MA), solidifying the resistance.
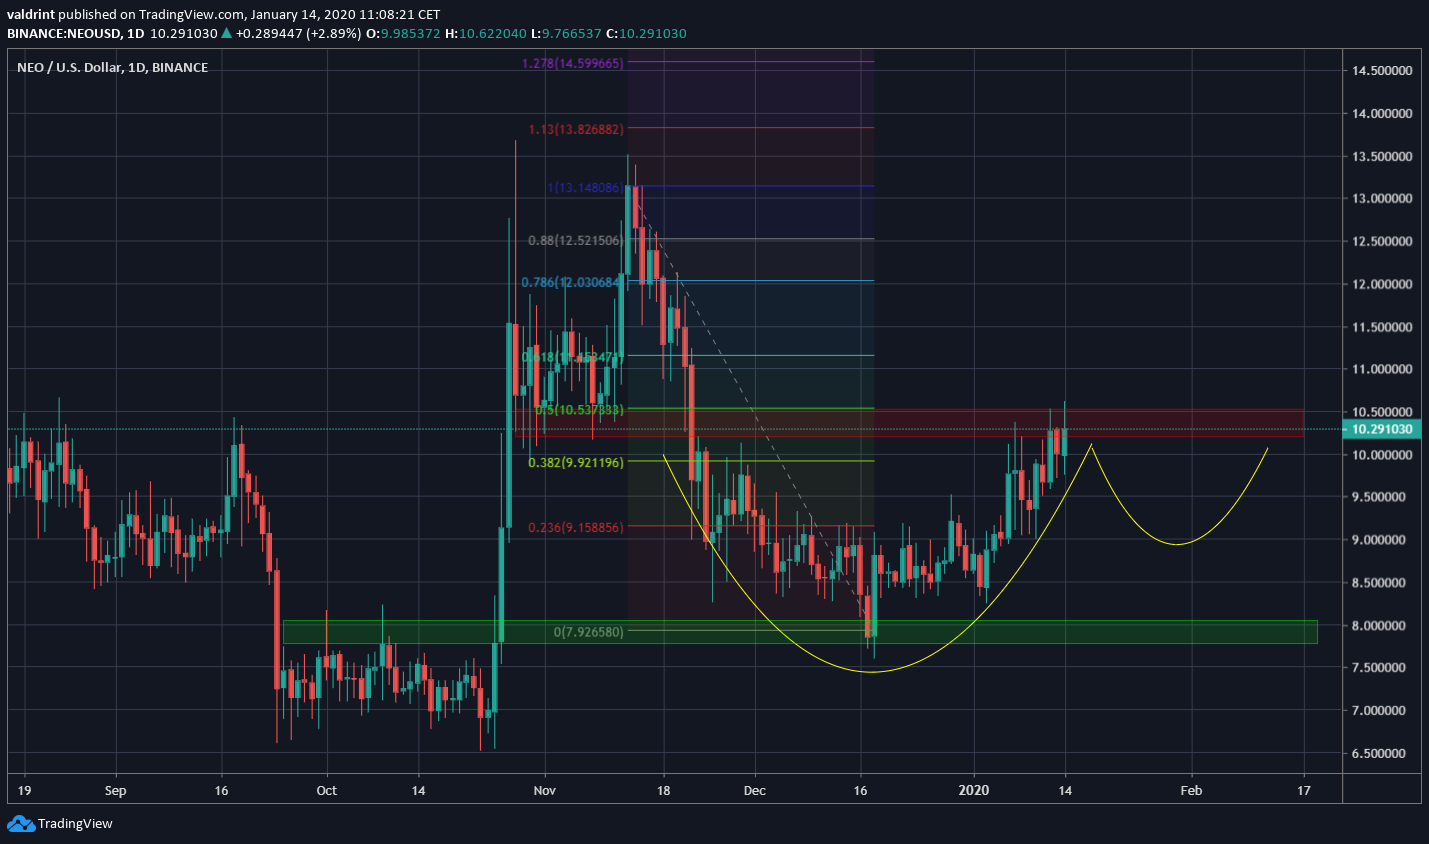
However, this is not to say that the price is not capable of breaking out. For example, it could create a cup and handle pattern, finding support above $9 and making another attempt at breaking out. This movement would fit with the long-term ascending support line (dashed).
If the $9 support area fails, the price would likely fall to $8 and trade in a range between $8 and $10.5. A breakdown below $8 would invalidate the ascending support and cause the price to revisit the $5.5-$ six support area.
NEO Future Movement
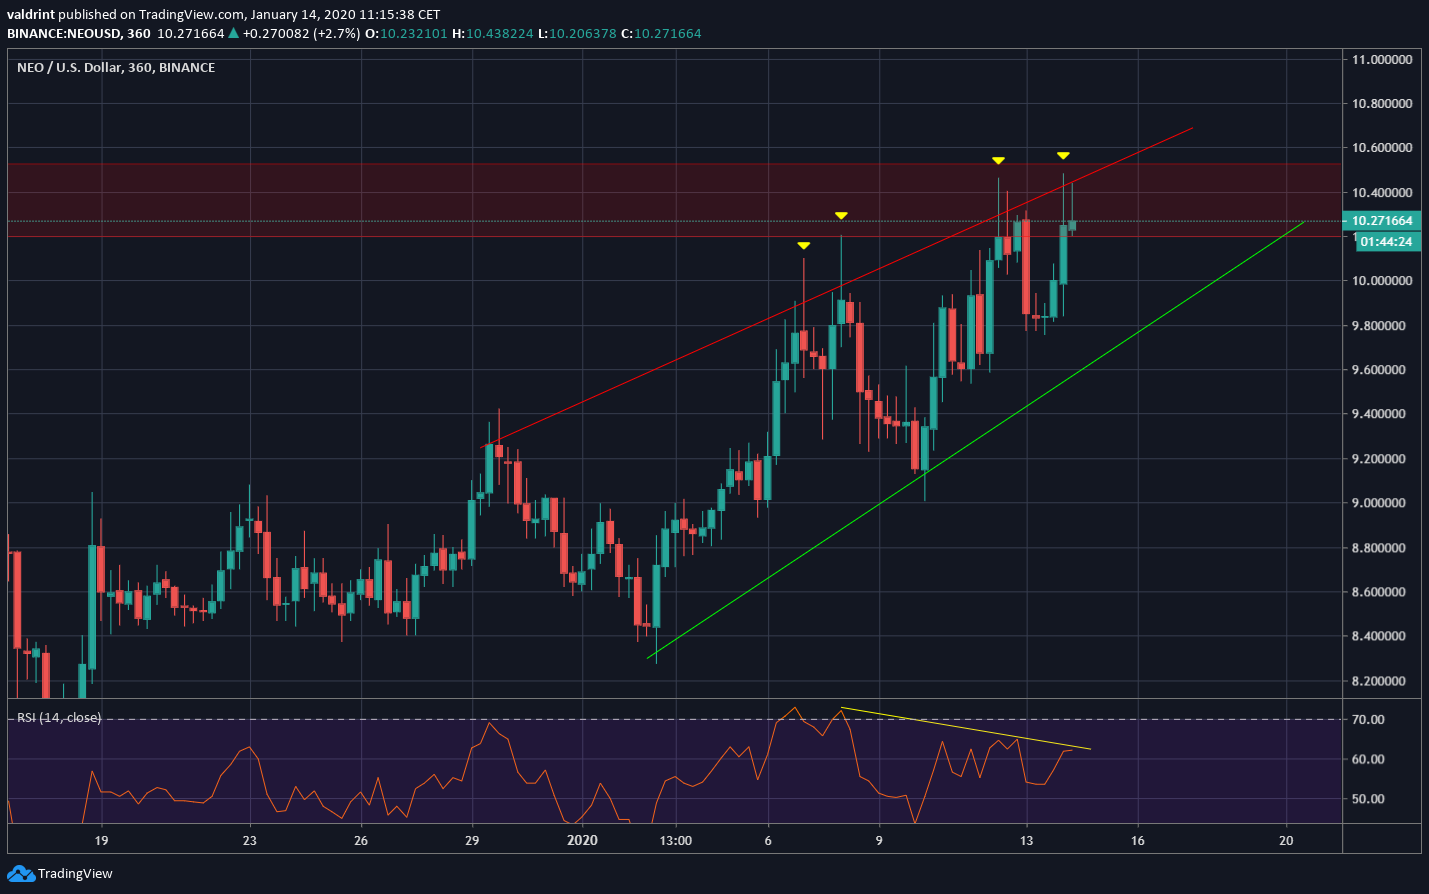
In the short-term, the price movement has shown several bearish characteristics. First, it has created a possible ascending wedge, which is considered a bearish pattern. Also, several long upper wicks have been created, most recently inside the resistance area of $10.5. Finally, there is a bearish divergence in the RSI, visible up until the 12-hour time-frame.
All these conditions support a price breakdown from the wedge with a target of $9.
To conclude, the NEO price is in the process of re-testing a previous support area. Due to several bearish attributes in the price movement, we believe it will not be successful in breaking out above it and will decrease towards $9.


