
Neo (NEO) has created a bullish pattern that is combined with bullish divergence in the RSI. However, the price has not yet reached a crucial horizontal support area.
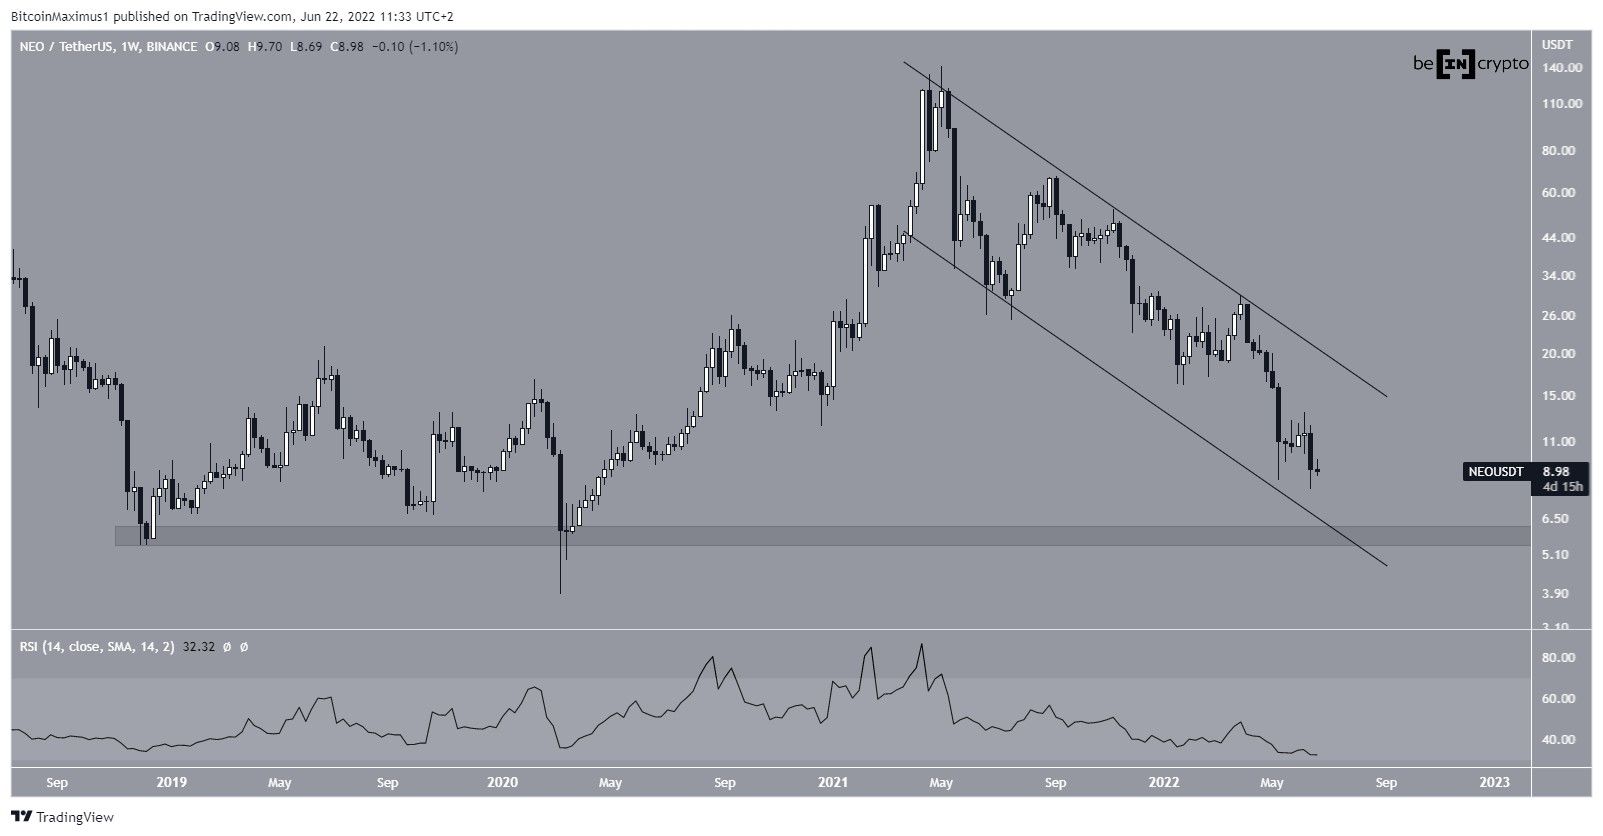
NEO has been falling since reaching a high of $141 on May 2021. This was not a new all-time high price, rather it was a lower high relative to the price in Dec 2018. It is possible that the entire decrease has been contained inside a descending parallel channel. Though its slope cannot be accurately determined due to the presence of numerous long wicks.
Currently, the price is close to the support line of the channel. If the downward movement continues, the support line will soon coincide with the $5.80 horizontal support area, which has not been reached since March 2020.
Moreover, the weekly RSI has already reached an all-time low of 32, suggesting that the trend is oversold.
(The logarithmic chart is used in the image below in order to better visualize large price fluctuations).
Double bottom pattern
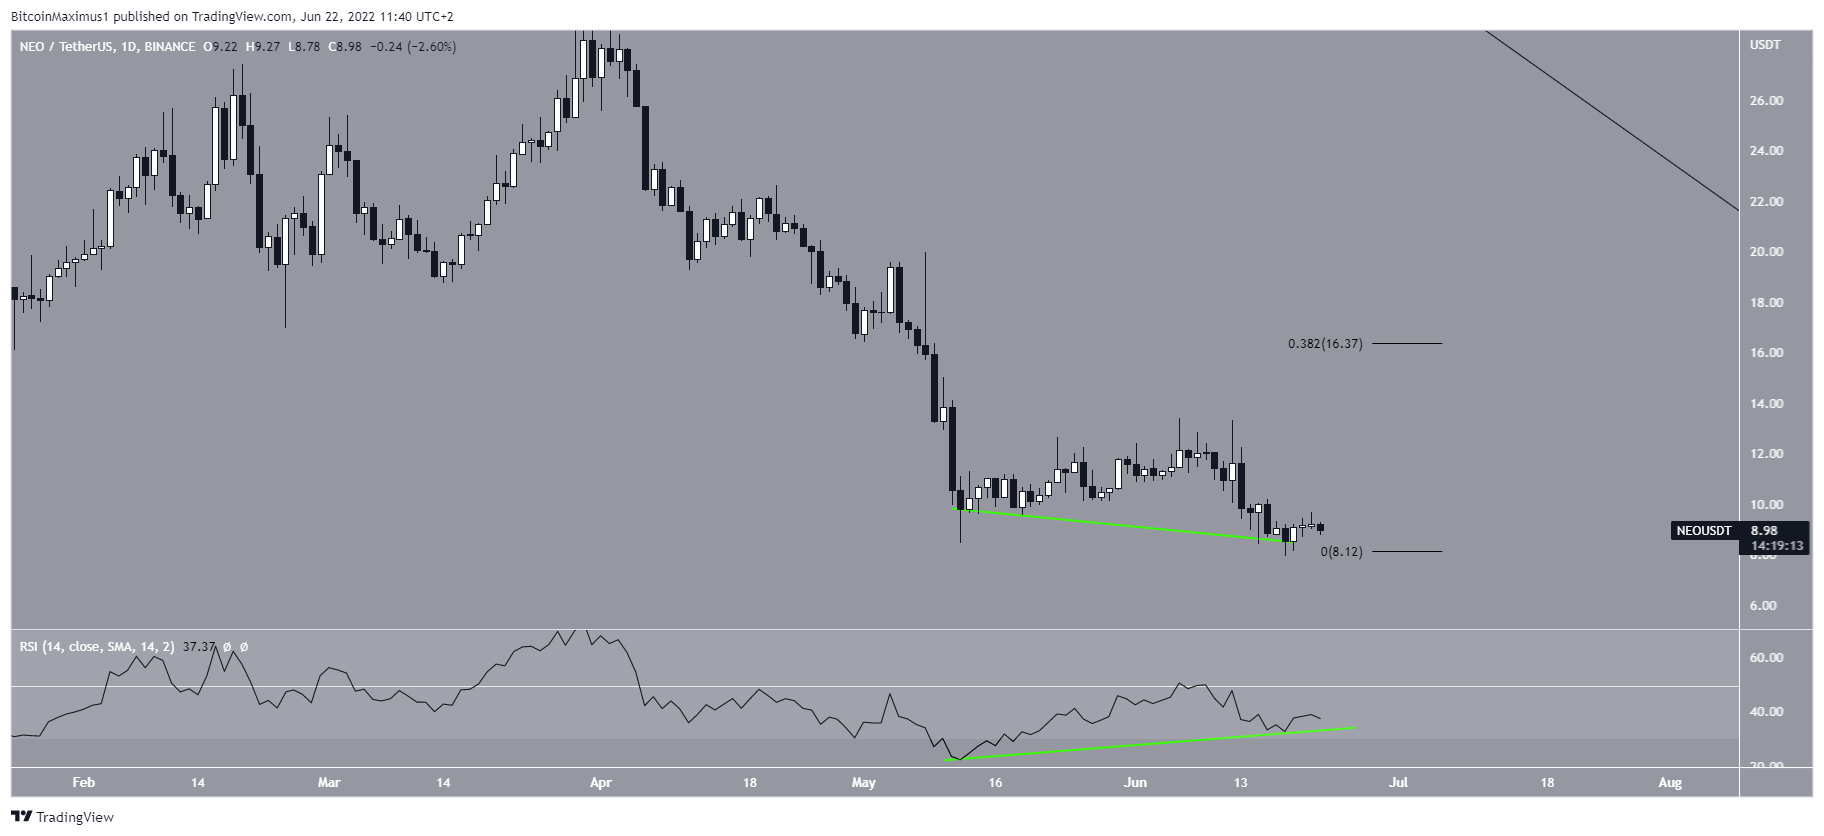
The daily chart provides a more bullish outlook. The main reason for this is the fact that the price has created a double bottom, which is considered a bullish pattern. Additionally, the pattern has been combined with bullish divergence in the RSI. This increases the legitimacy of the double bottom, since both the pattern and the reading indicate that an upward movement is likely.
However, the pattern is not yet confirmed. The first reason for this is that the price has yet to move above the high between the two bottoms, which is at $12.50. Furthermore, the RSI has yet to move above this same high, which is at 50.
So, a RSI increase above 50 and a price increase above $12.50 is required in order to confirm the pattern. In this possibility, the next closest resistance area would be at $16.40, the 0.382 Fib retracement resistance level.
NEO wave count analysis
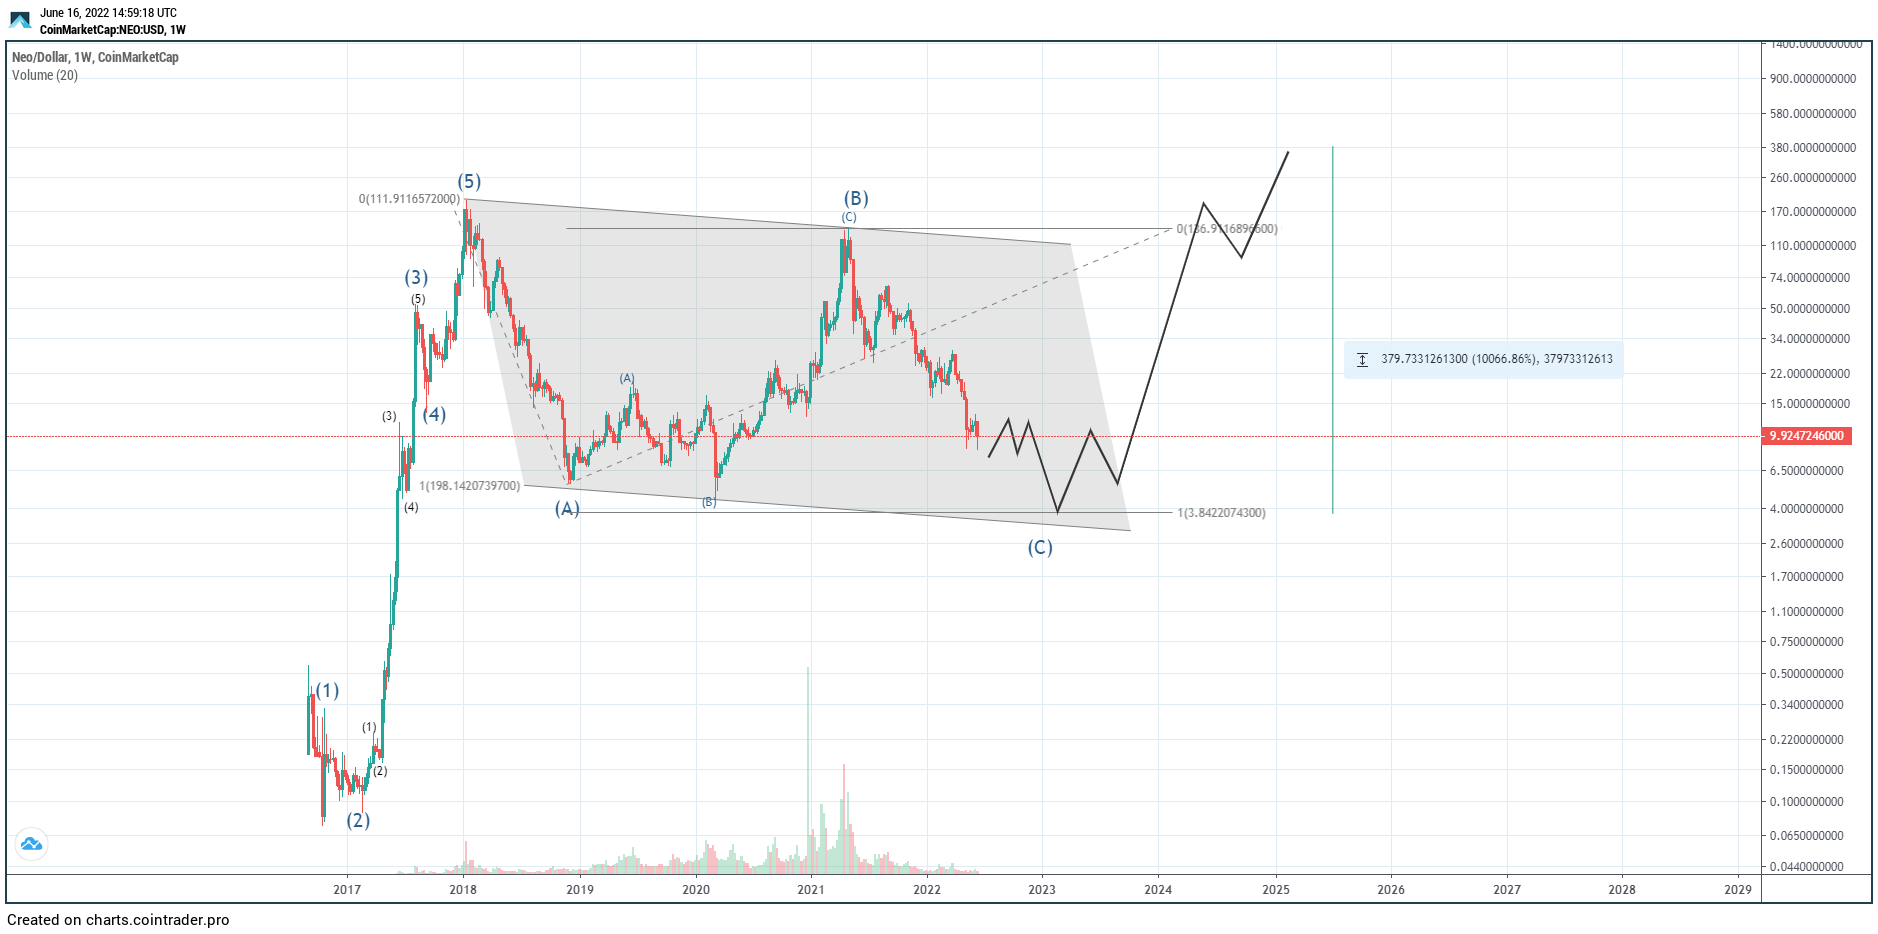
Cryptocurrency trader @Thetradinghubb tweeted a chart of NEO, stating that the next bull cycle will commence after a drop to $4.
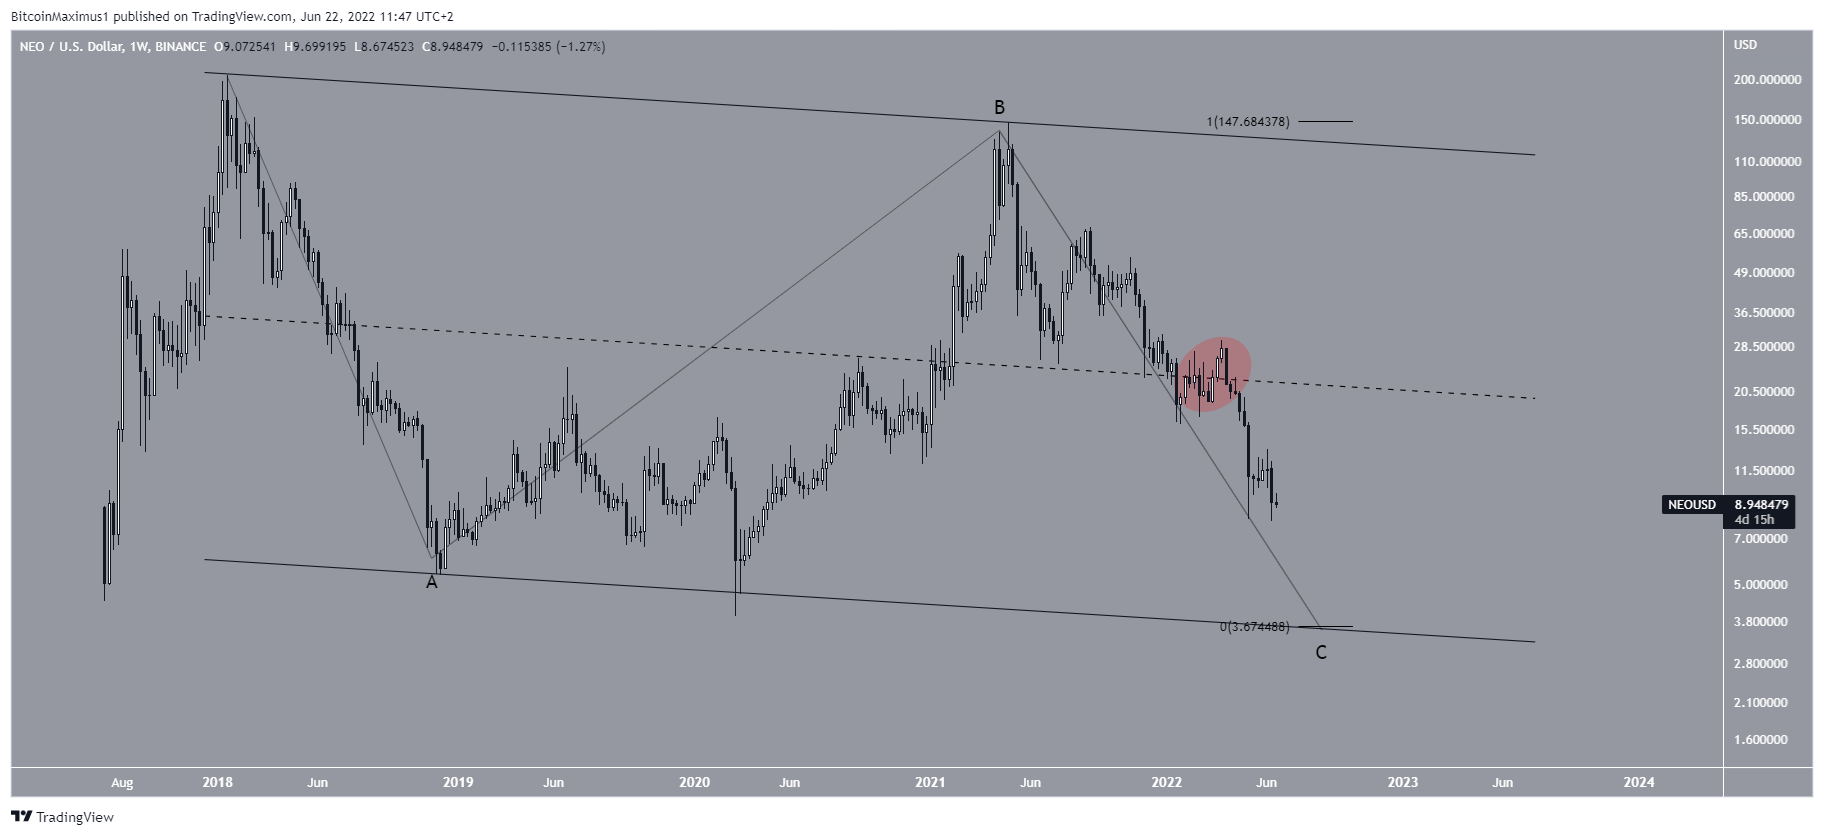
Since the 2021 high failed to move above the 2018 one, it is possible that the entire movement since then has been part of an A-B-C corrective structure. As a result, it can be contained inside a descending parallel channel.
Currently, the price is trading in the lower portion of this channel, after being rejected by the midline (red circle).
Giving waves A:C an exactly 1:1 ratio would lead to a low of $3.70, aligning with the target from the tweet.
For Be[in]Crypto’s latest bitcoin (BTC) analysis, click here
