


The NEO price is currently making its third attempt at breaking out above an important resistance level. If successful, the price could increase by more than 50%.
Long-Term Resistance Levels
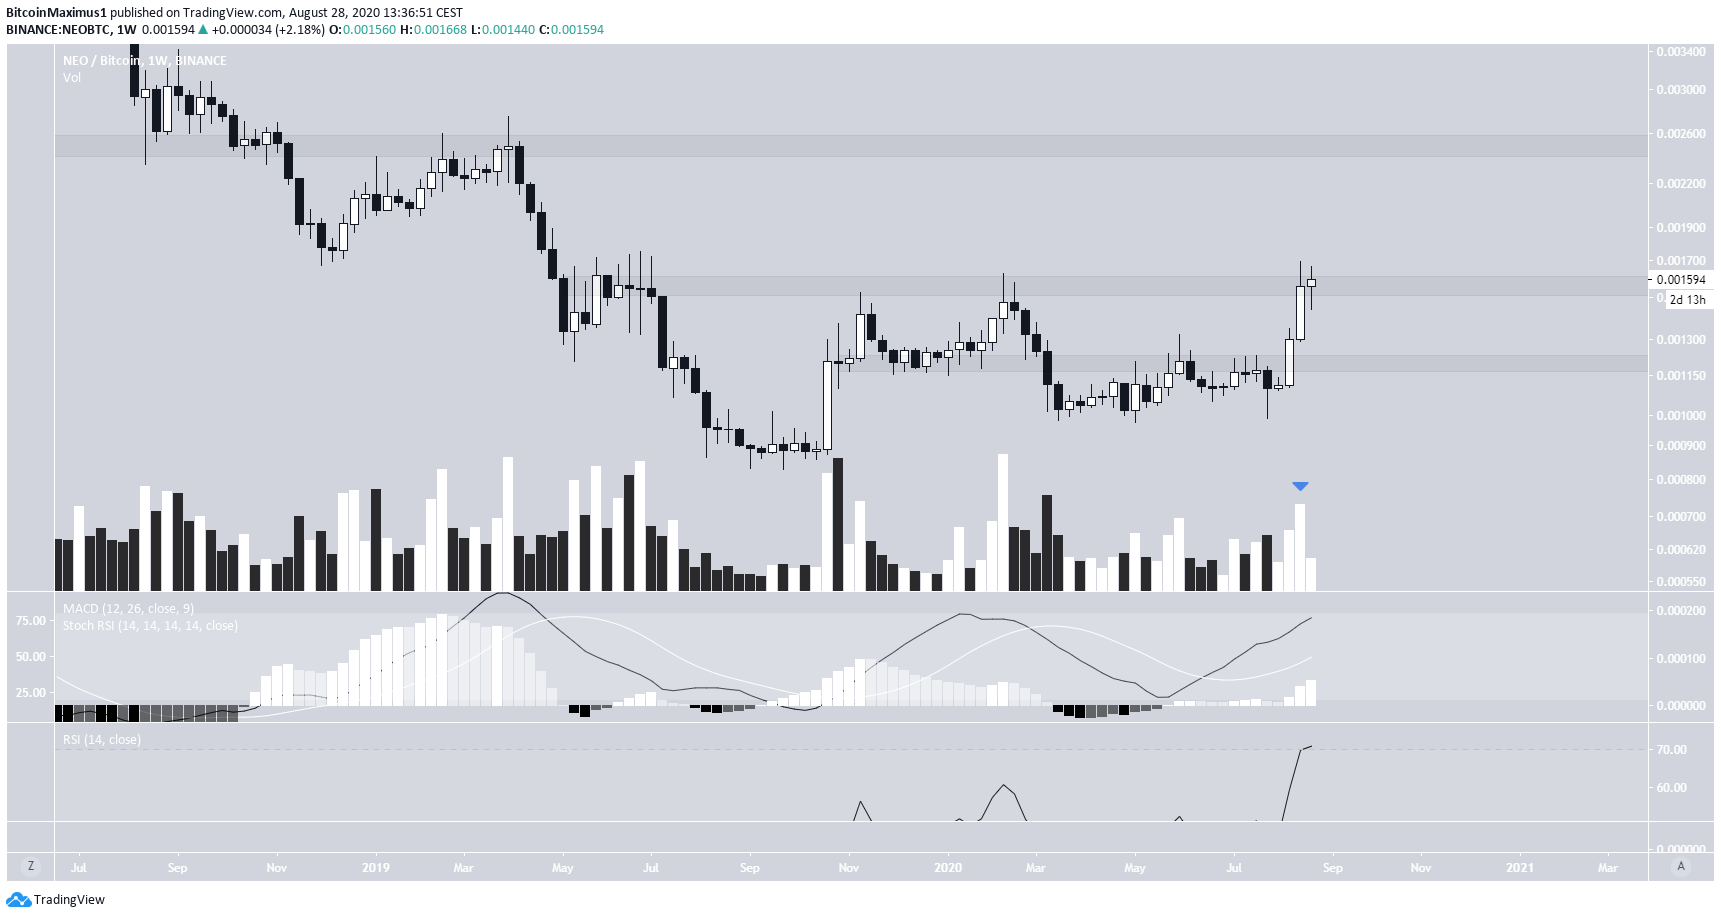
The NEO price has been increasing since October 2019. The price reached the ₿0.00155 resistance area in February 2020, before beginning a corrective movement. However, the price initiated another upward move on July 27 which is still ongoing.
Currently, the price is trading inside the ₿0.00155 area, in the process of making its third breakout attempt.
Technical indicators are bullish, even though they suggest that the rally is overextended. Both the RSI and the Stochastic RSI are oversold, but are increasing and have not formed any type of bearish divergence. The MACD is also increasing.
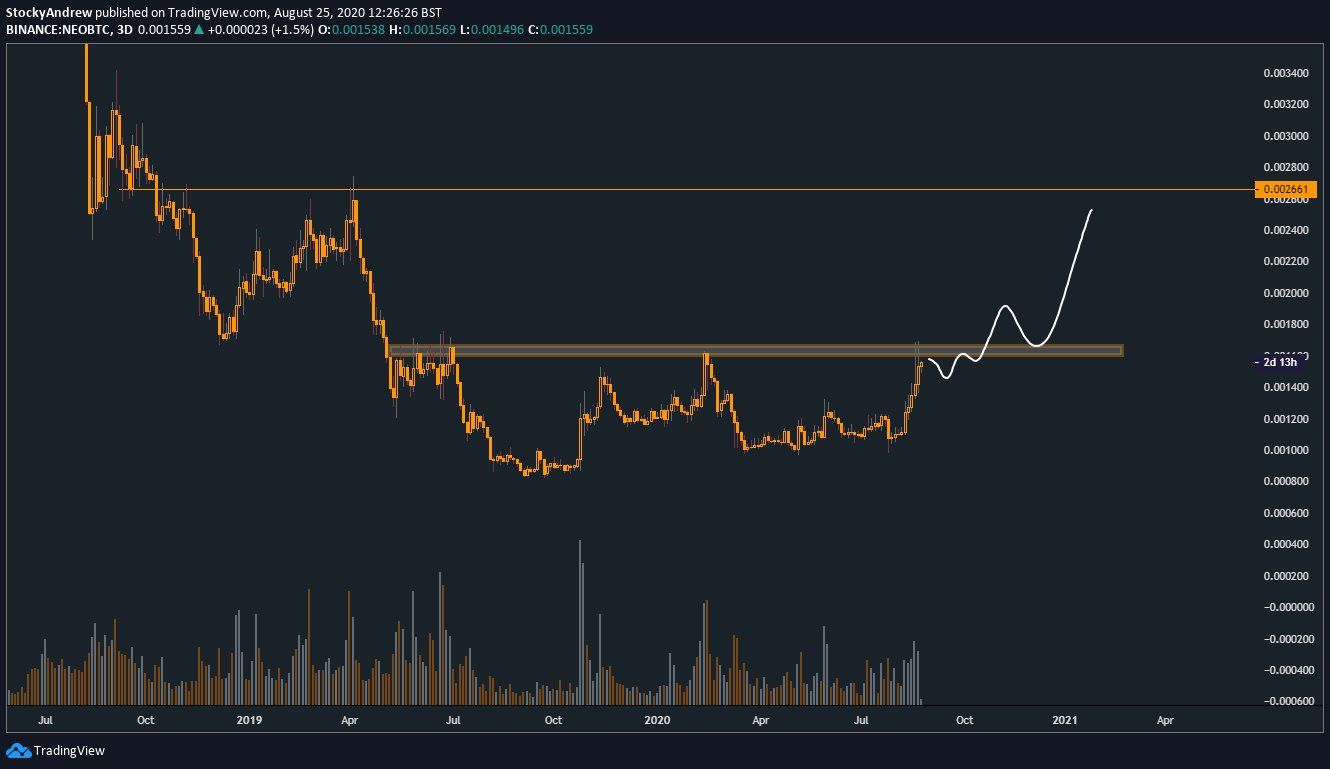
The closest support area is found at ₿0.0012. If the price breaks out, the next resistance area would be found at ₿0.0026.
Cryptocurrency trader @ACXtrades stated that once NEO breaks out above the current resistance area, it could increase 55% above the current price, reaching ₿0.0026. Both the outlook and the resistance area fit with the analysis given above.
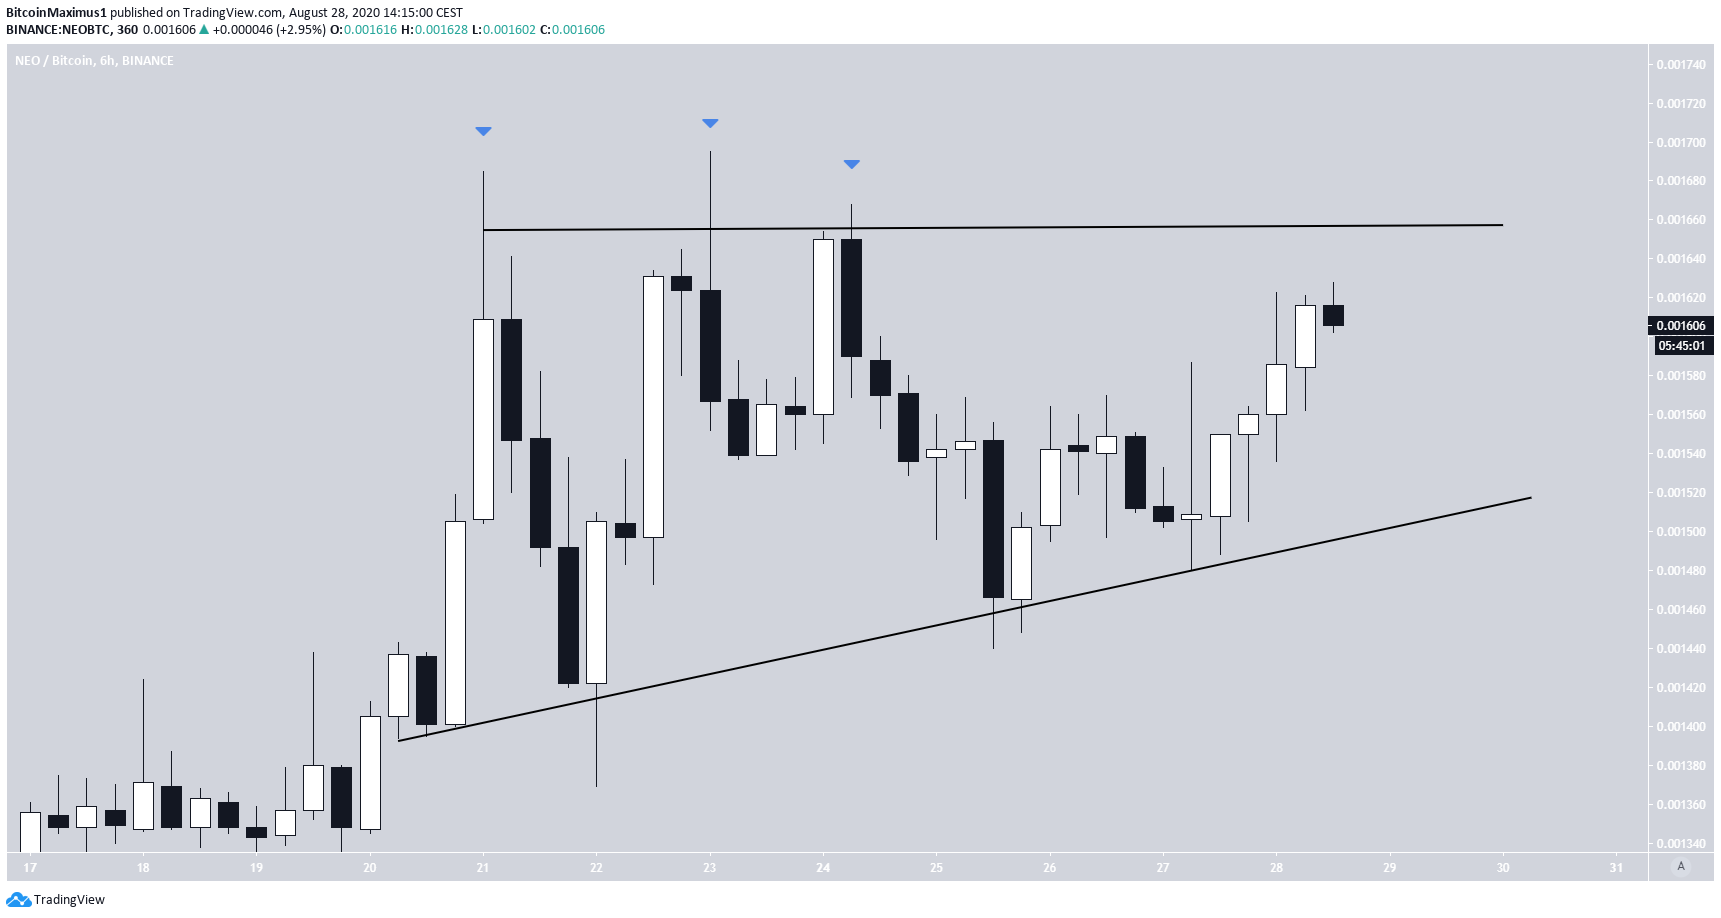
Short-Term Bearish Pattern
The shorter-term chart reveals two patterns:
- The first is a triple top, that took place between August 21 – 25. While this is a bearish pattern, a decline has already occurred as a result of it.
- The second is an ascending triangle, which is a bullish reversal pattern. While the ascending support line is intact, the resistance line is ambiguous due to the presence of several wicks.
As long as the price is trading above this support line, it should break out. A breakdown from the line would likely take the price towards the support area outlined in the previous section.
NEO Wave Count
Beginning on July 27, the price has likely begun an impulsive upward formation. If so, it is currently in the fourth wave, which would likely end between the ₿0.00125 and ₿0.00135, the 0.5 – 0.618 Fib levels respectively.
These support levels also coincide with the previously outlined support area at 0.0012. Technical indicators support this fall since a bearish cross has taken place on the Stochastic RSI and the MACD is decreasing.
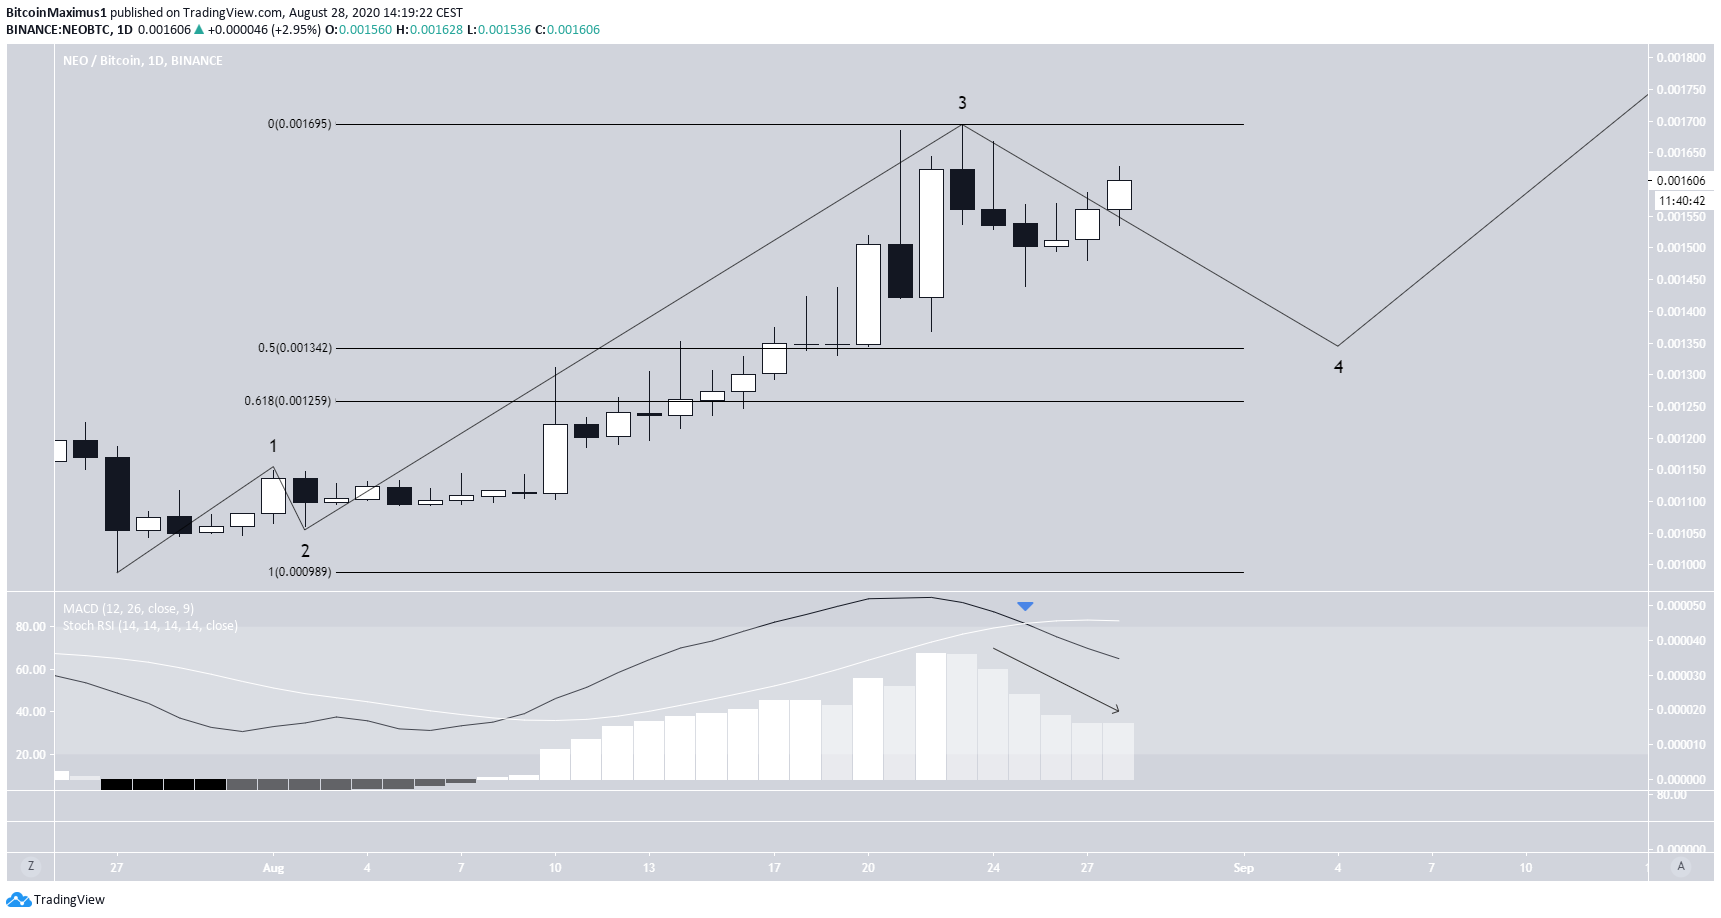
To conclude, after a short-term correction, the NEO price should continue its upward move towards the resistance areas outlined above.
