


The NEO price has been increasing since breaking out from a symmetrical triangle on Feb 9.
NEO Highlights
- The NEO price broke out from a symmetrical triangle.
- The price is possibly trading inside a short-term ascending channel.
- There is resistance at ₿0.0017
- There is support at ₿0.00135.
- The weekly RSI is bullish.
Well-known trader @Damskotrades posted an image of the NEO price chart that shows a breakout from a symmetrical triangle. The closest targets are given at ₿0.00167 and ₿0.00155.
POP $NEO pic.twitter.com/nqNB7PdSBq
— CryptoAmsterdam (@damskotrades) February 12, 2020
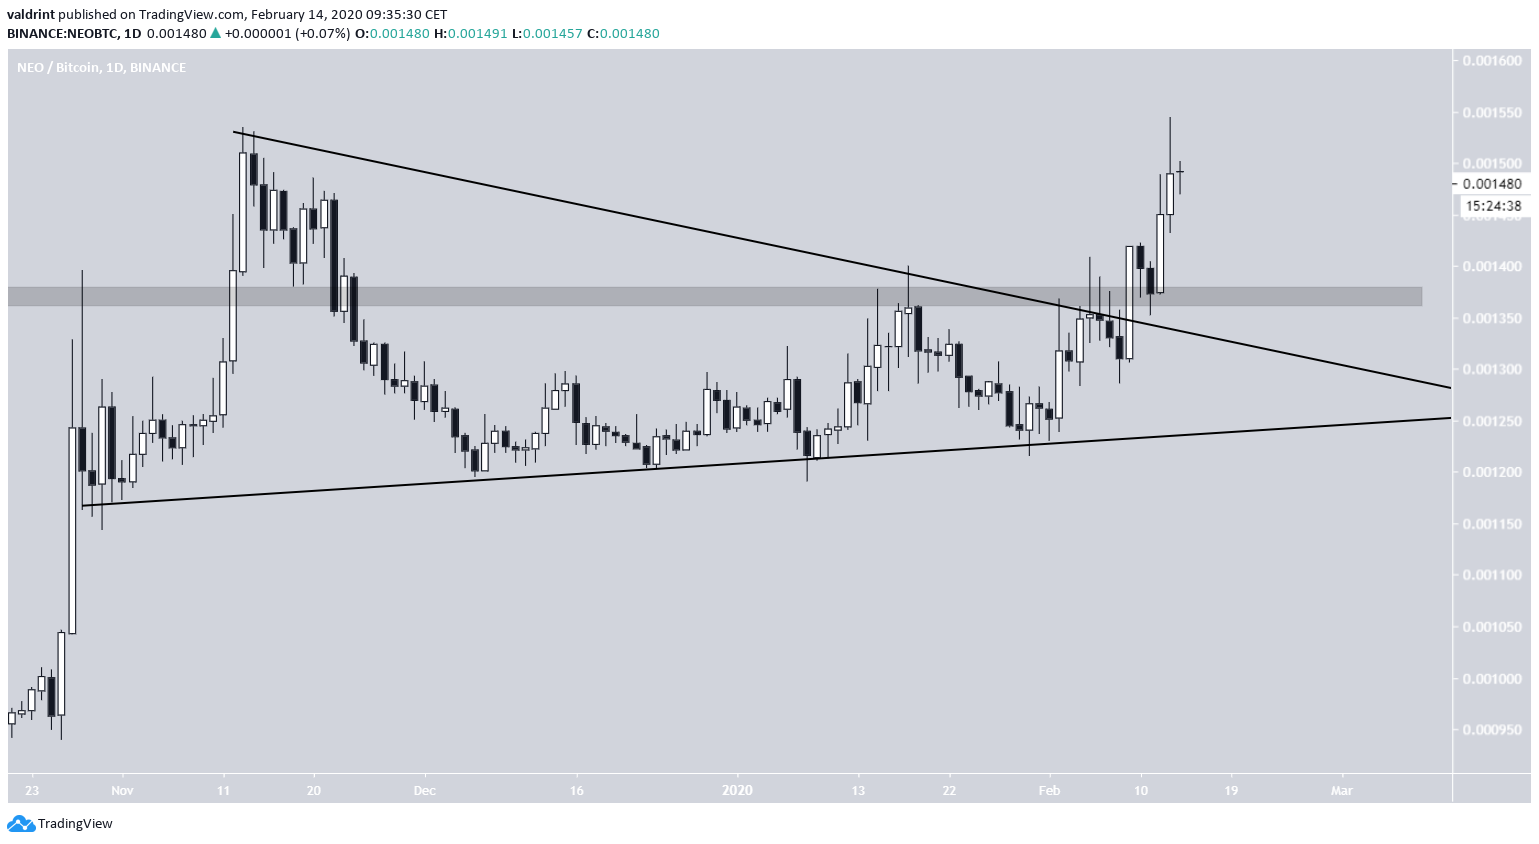
Triangle Breakout
The NEO price had been trading inside a symmetrical triangle since November 2019. On Feb 9, the price broke out and has been increasing since.
After the breakout, NEO validated the ₿0.00135 area as support and continued its upward movement. The first target outlined in the tweet, ₿0.00155, has already been reached.
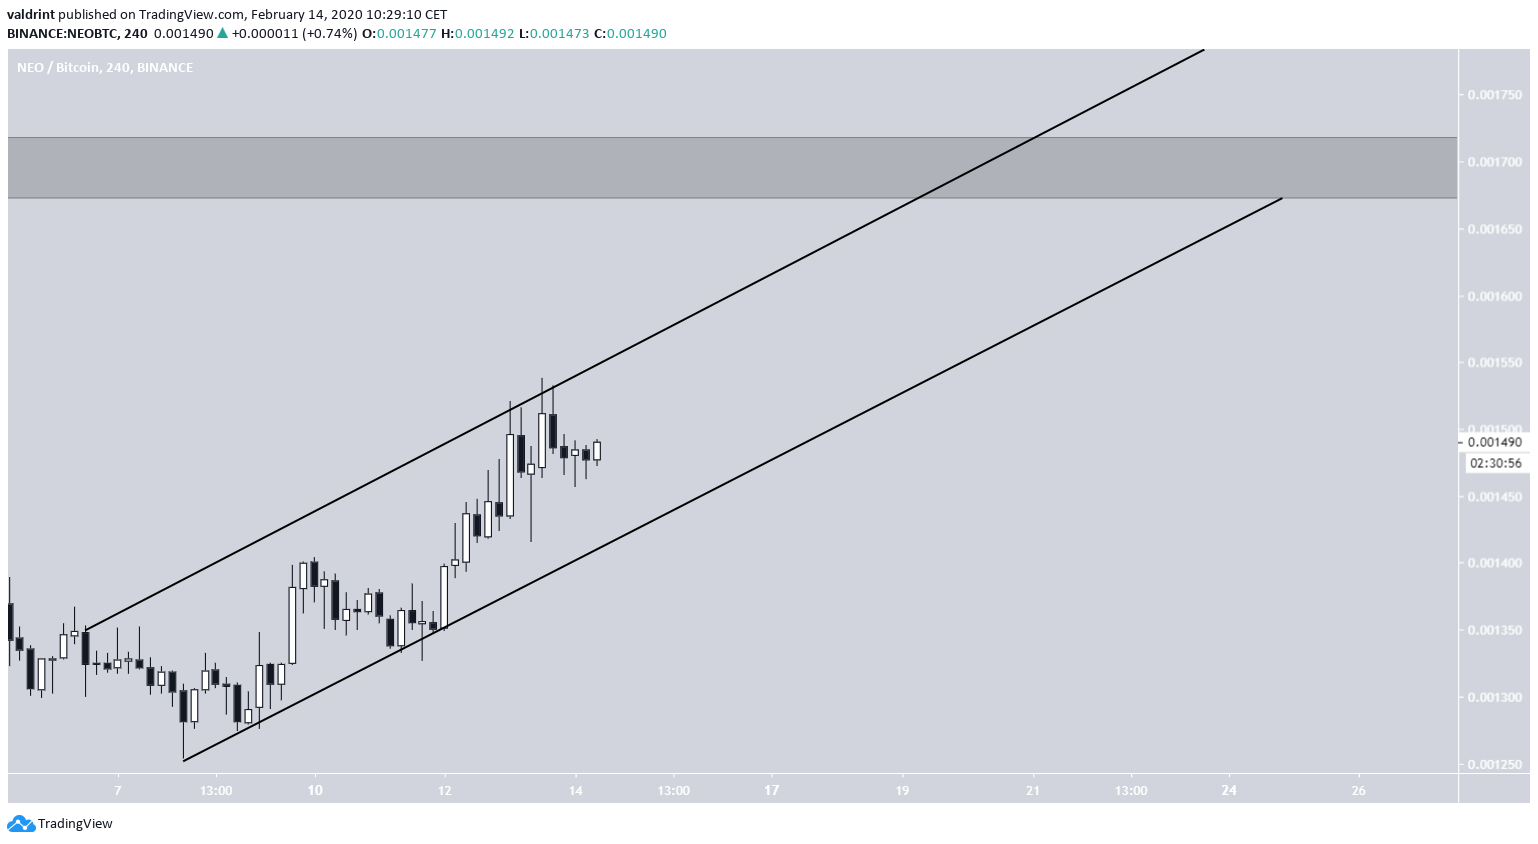
Since the breakout, it is possible that the price is trading inside a steep ascending channel, which would take the price to the next resistance area of ₿0.017 by Feb 24.
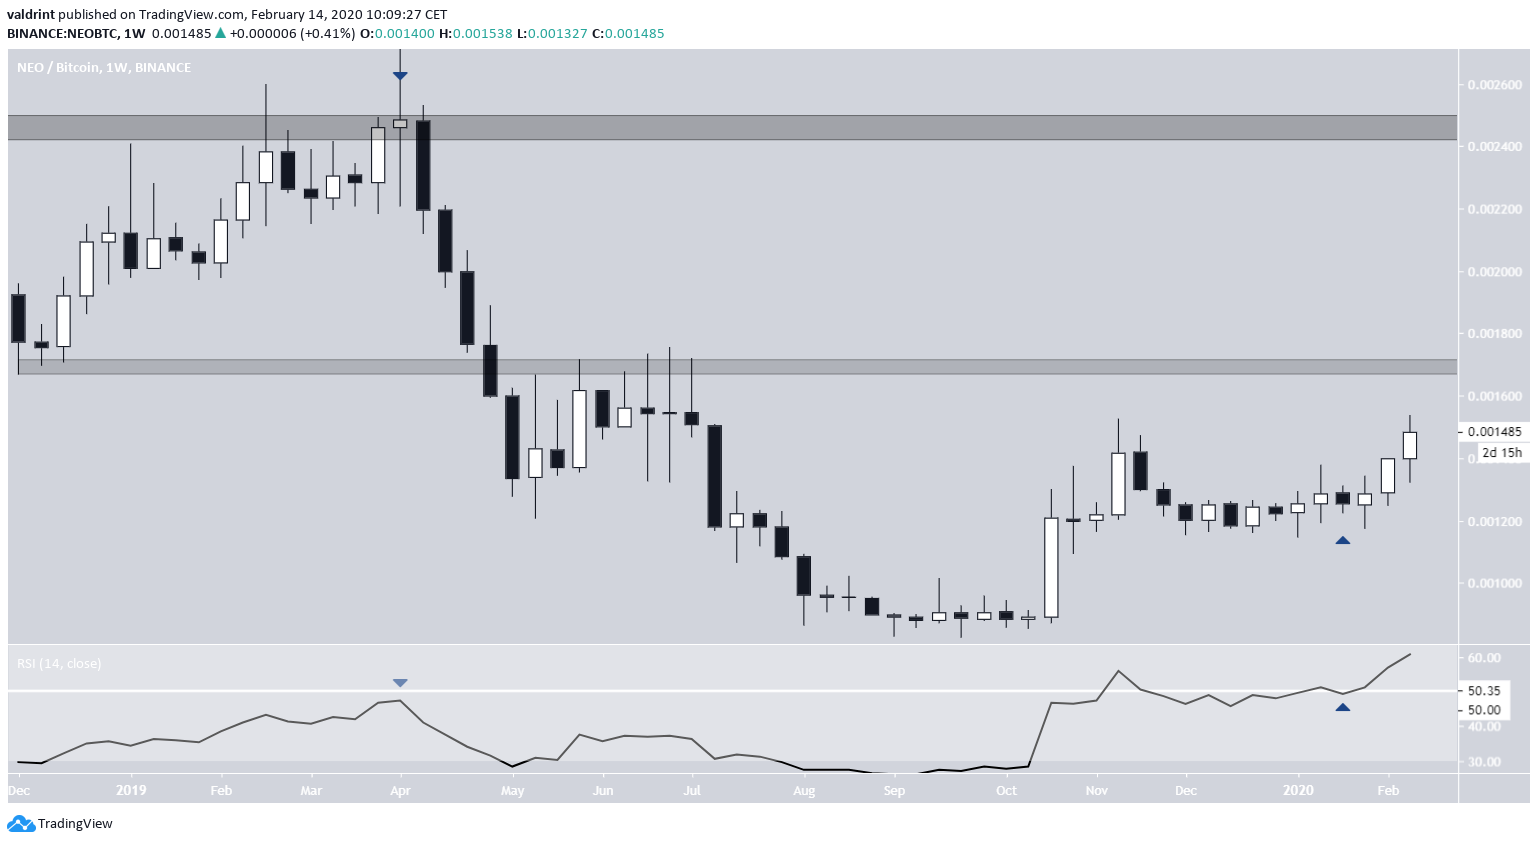
Elliott Formation
The weekly chart gives us information that could be useful for predicting future price movement. The RSI was rejected by the 50-line in April 2019, at the same time the price was rejected strongly by the ₿0.0025 price level.
However, the current upward movement and triangle breakout has caused the RSI to move above 50, possibly indicating that the price has begun a bullish cycle.
Therefore, it is possible that the upward move that began in October was the first wave of a five-wave Elliott formation. After the ensuing correction, the breakout from the triangle was the beginning of the third wave, which has a target of ₿0.0017.
If this movement transpires, the final wave could take the price all the way to ₿0.0025, the previous breakdown level. Based on the length of the first two waves, this high could be reached by the end of May.
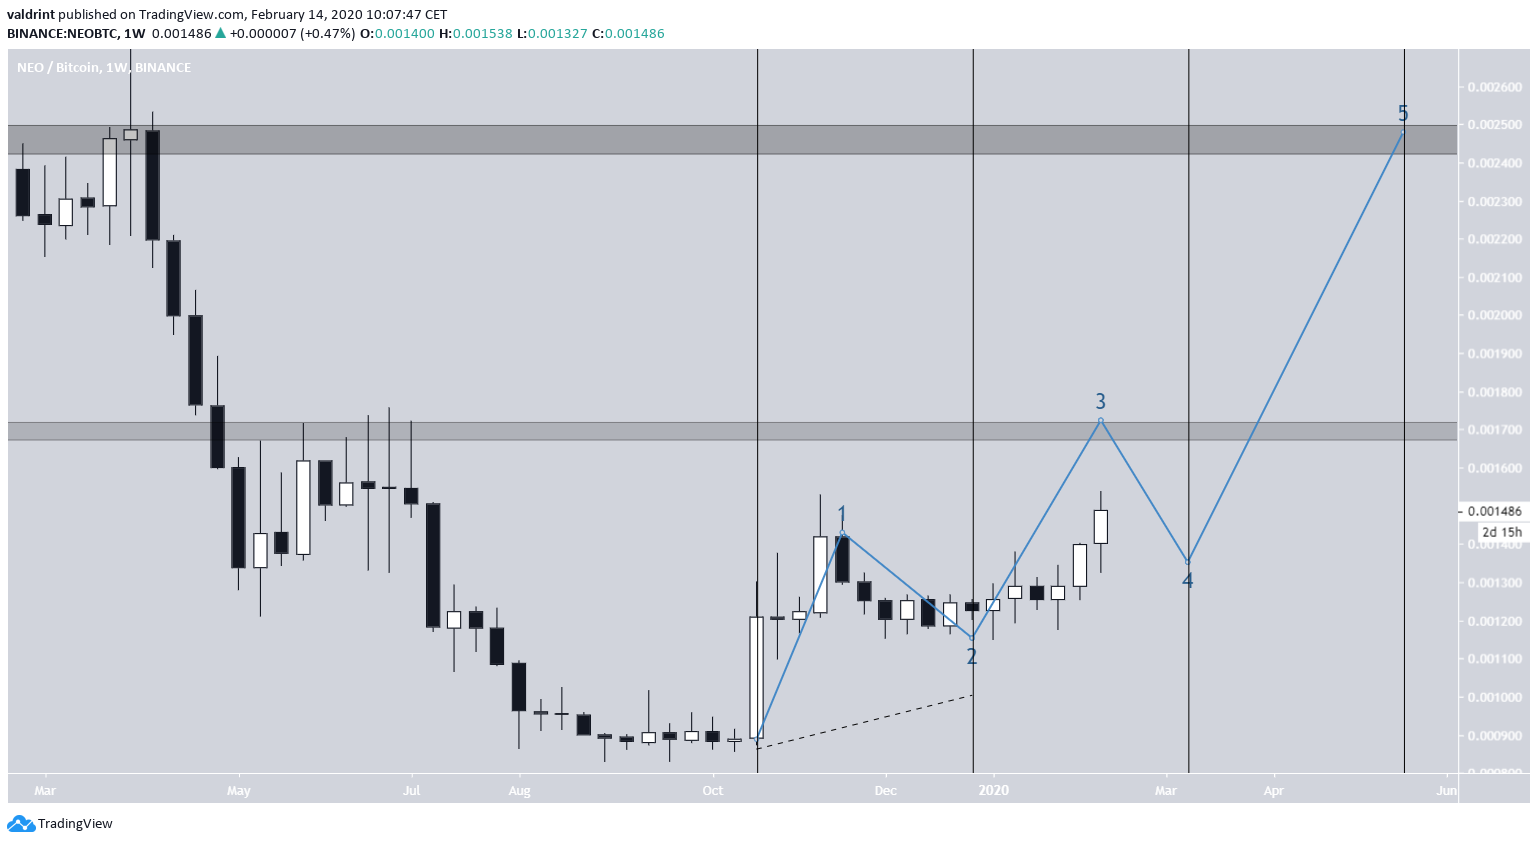
To conclude, the NEO price has broken out from a symmetrical triangle in what seems to be the beginning of the third wave of a five-wave Elliott formation. The top of the third wave is likely to fall back to around ₿0.017, while a longer-term target is given at the previous breakdown level at ₿0.025.


