


Near Protocol (NEAR) is showing some short-term bullish signs, but the long-term trend remains bearish unless a crucial resistance level is reclaimed.
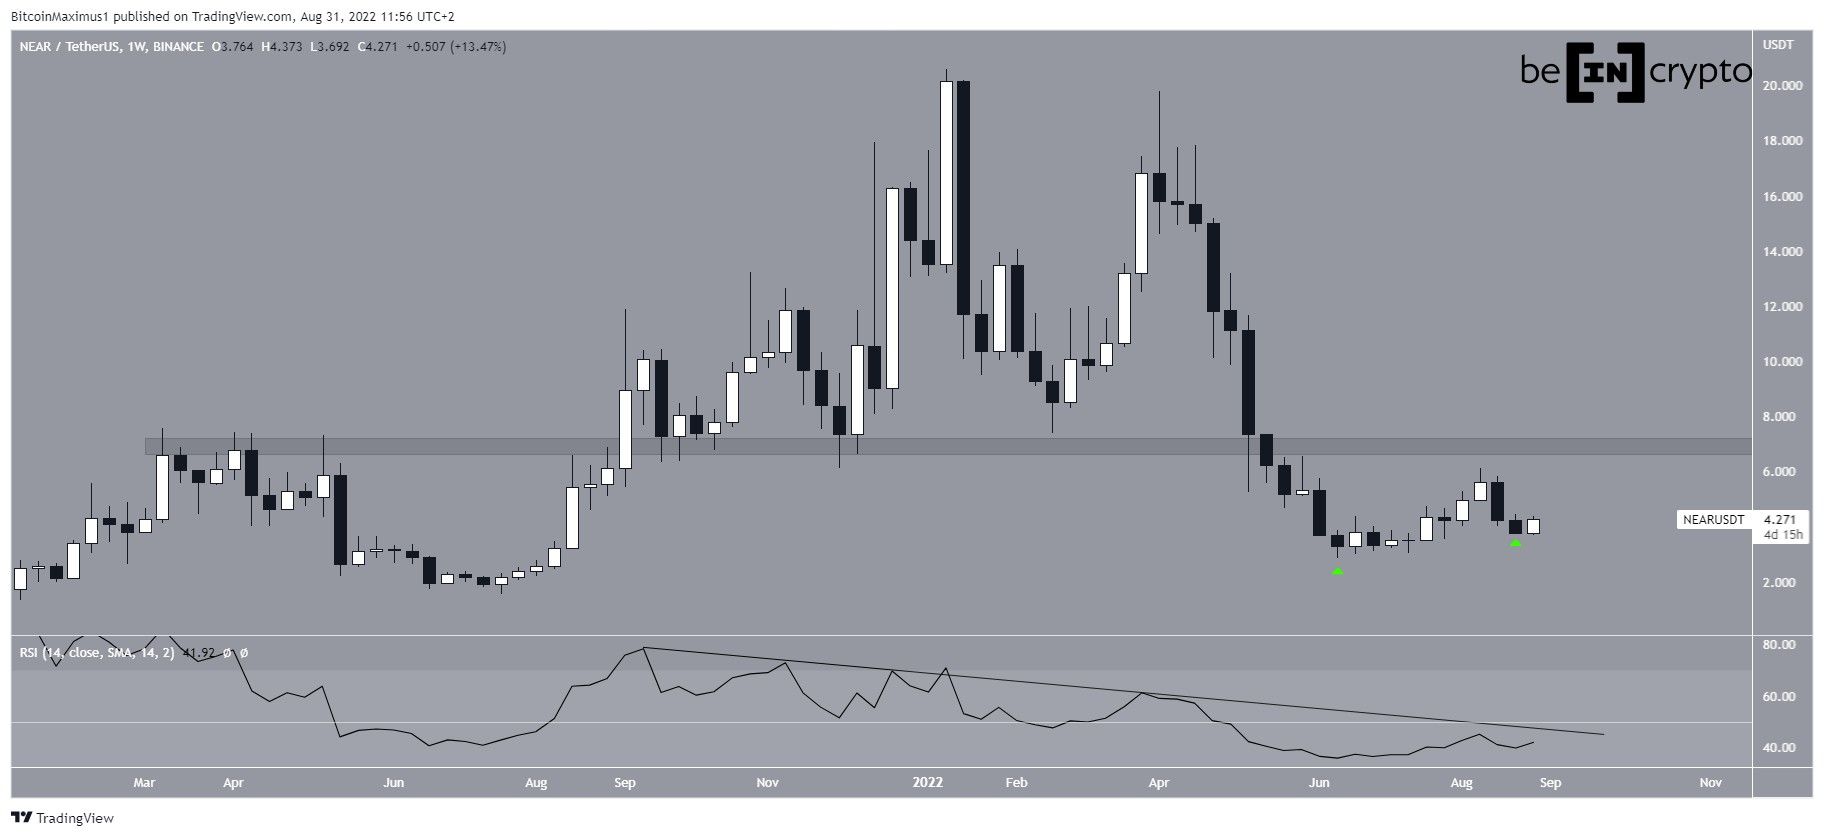
NEAR has been decreasing since reaching an all-time high in Jan and then creating a slightly lower high in April. The downward movement has so far led to a low of $2.87 in June. Additionally, this downward movement has caused a breakdown below the $7 horizontal area.
Relative to the June lows, the price has created a higher low in Aug (green icons). If this leads to an upward movement, the $7 area would be expected to provide resistance.
Furthermore, if this upward movement were to transpire, the weekly RSI would reach its descending resistance line that has been in place since Sept. This line would also be likely to provide resistance.
Lack of structure
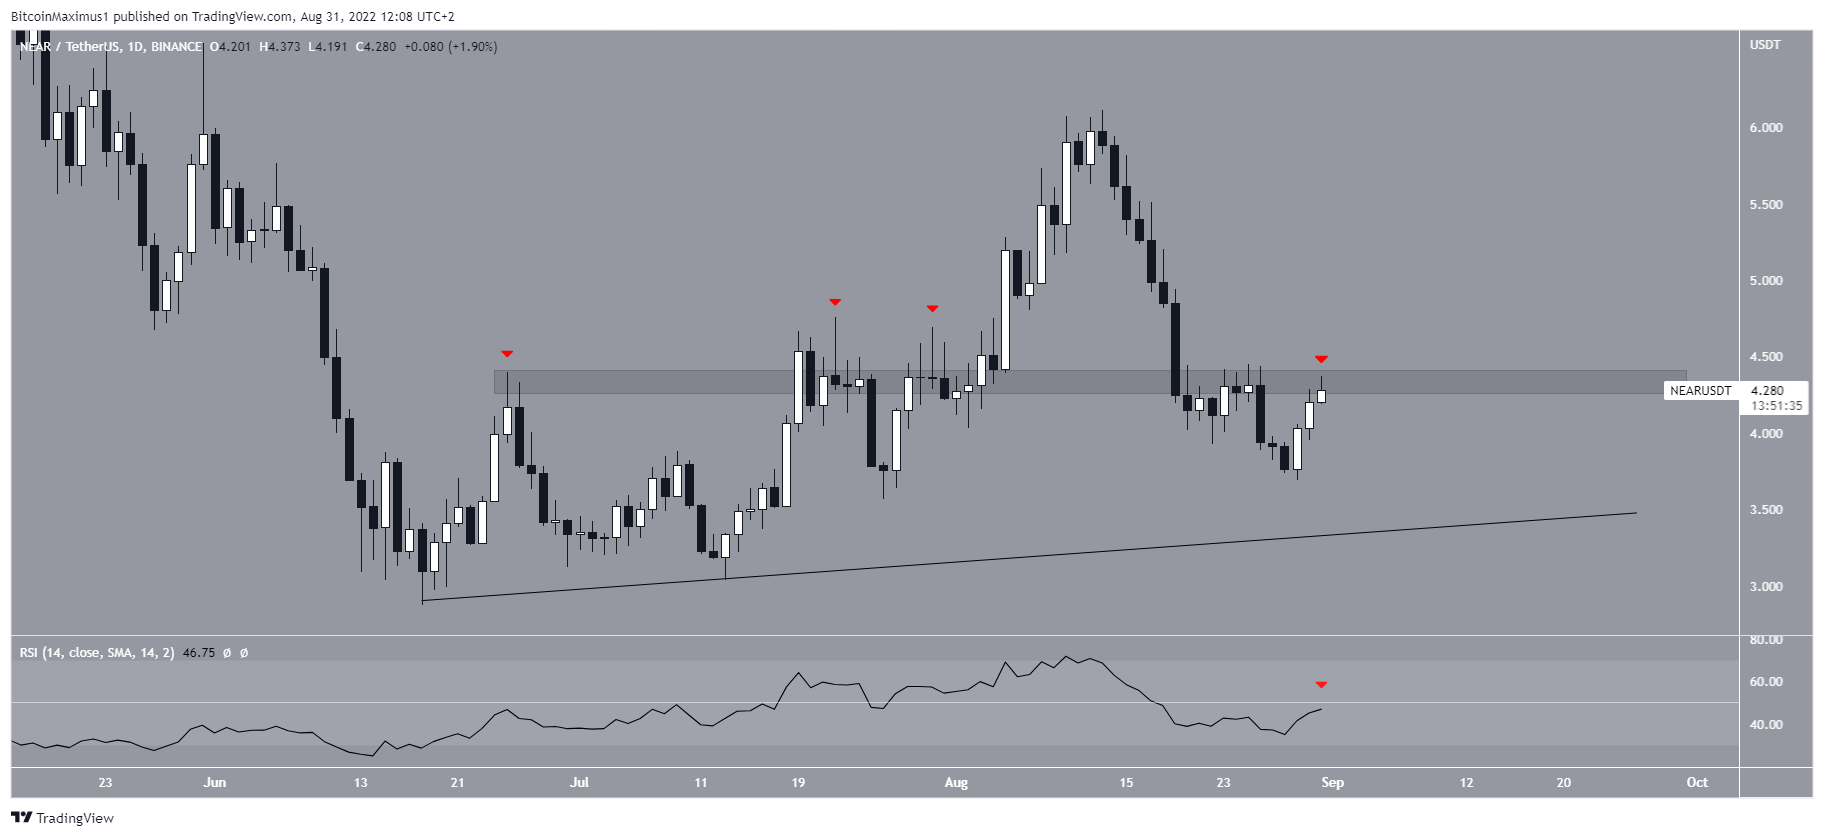
The daily chart does not show a clear structure. While it is possible that NEAR has been following an ascending support line since its June lows, the line has not been validated sufficient times (green icons). The line is currently at $3.50 and another validation of it would confirm it.
Currently, the price is trading below the $4.35 horizontal resistance area. The line had previously acted as resistance (red icons), and once the price broke out, it was expected to provide support.
However, NEAR failed to hold on above it and has broken down once more. So, the area is expected to provide resistance once more.
Similar to the weekly RSI, the daily one is trading below 50 and could face resistance from the line in case of a bounce.
Future NEAR movement
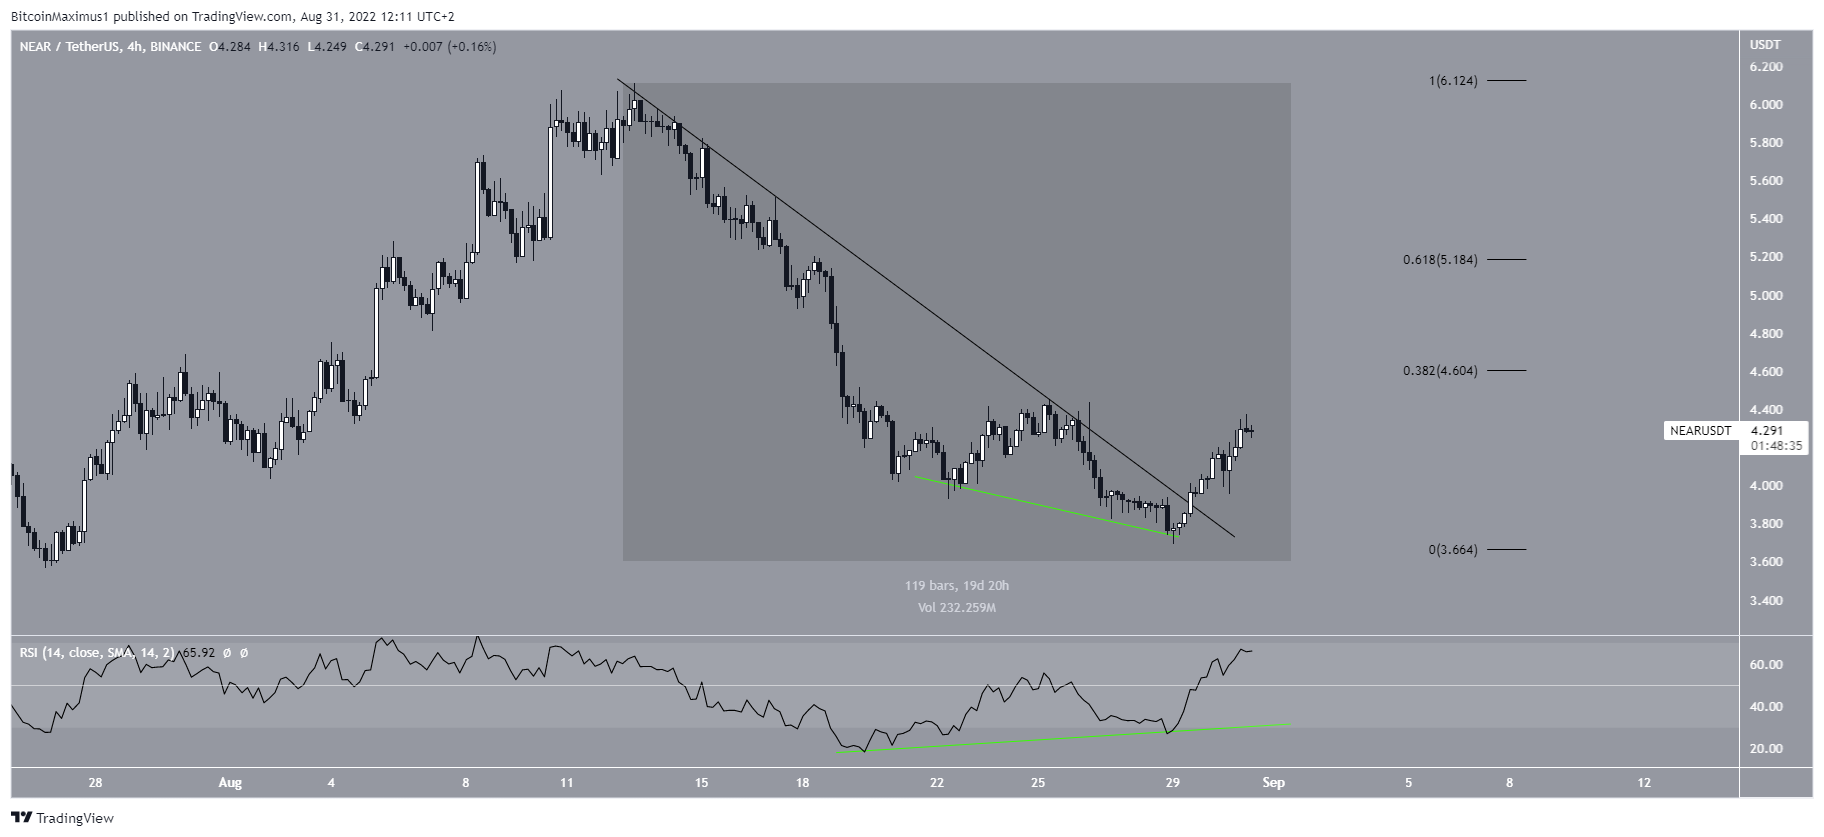
Despite the bearishness from the weekly and daily time frames, the four-hour chart suggests an initial bounce is expected.
The two reasons for this are the bullish divergence that had developed in the RSI and the breakout from a short-term resistance line.
If the upward movement continues, the first resistance would be at $4.60, while the next one at $5.20, if NEAR is successful in moving above the first.
Afterward, the most likely scenario suggests that the price will get rejected and continue falling.
For Be[in]Crypto’s latest Bitcoin (BTC) analysis, click here


