

Nano (NANO) has broken down from an ascending support line that had previously been in place since July 20.
It is attempting to hold on above the $4.92 support area and the 2-4 trendline. Doing so is mandatory if the upward trend is to continue.
NANO breaks down
NANO had been moving upwards since July 20, following an ascending support line. This led to a high of $7.87 on Aug 22.
However, NANO has been falling since. It created a lower high on Sept 6 and broke down from the ascending support line the next day.
Currently, it’s trading close to the 0.618 Fib retracement support level at $4.90.
If it were to break down, the next support would be found at $4.15. This target is the 0.786 Fib retracement support level and a horizontal support area.
Technical indicators are bearish, supporting the continuation of the downward movement. The MACD is nearly negative and the RSI is below 50.

Short-term movement
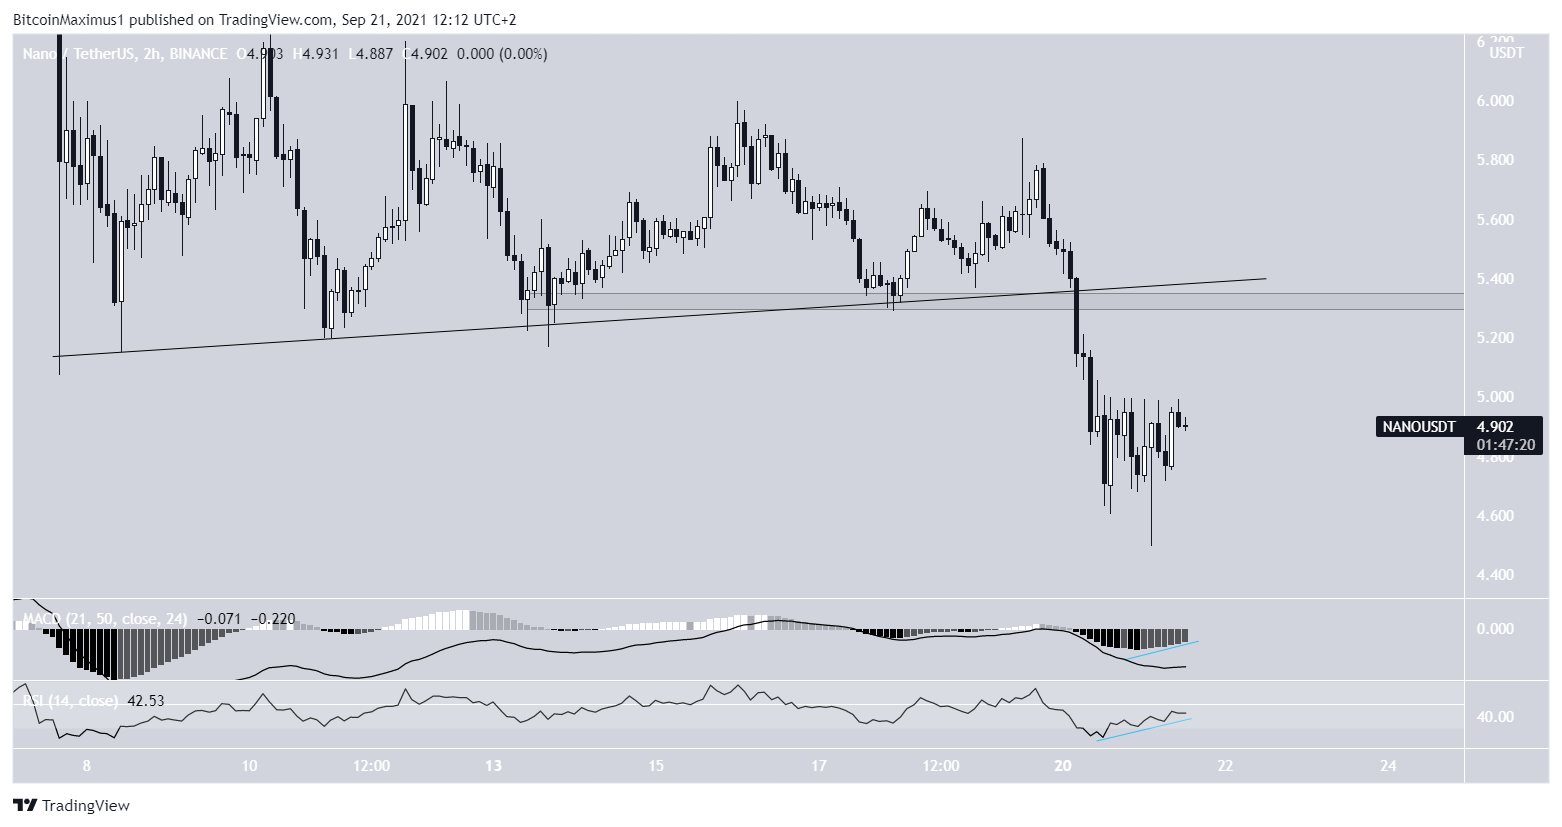
The two-hour chart is more bullish and indicates that a bounce is likely.
Both the RSI and MACD have generated bullish divergences, a sign that usually precedes upward moves.
However, there is a strong resistance near $5.30 in the form of a horizontal resistance level and a short-term ascending support line.
Therefore, until that area is reclaimed, the short-term trend cannot be considered bullish.
Wave count
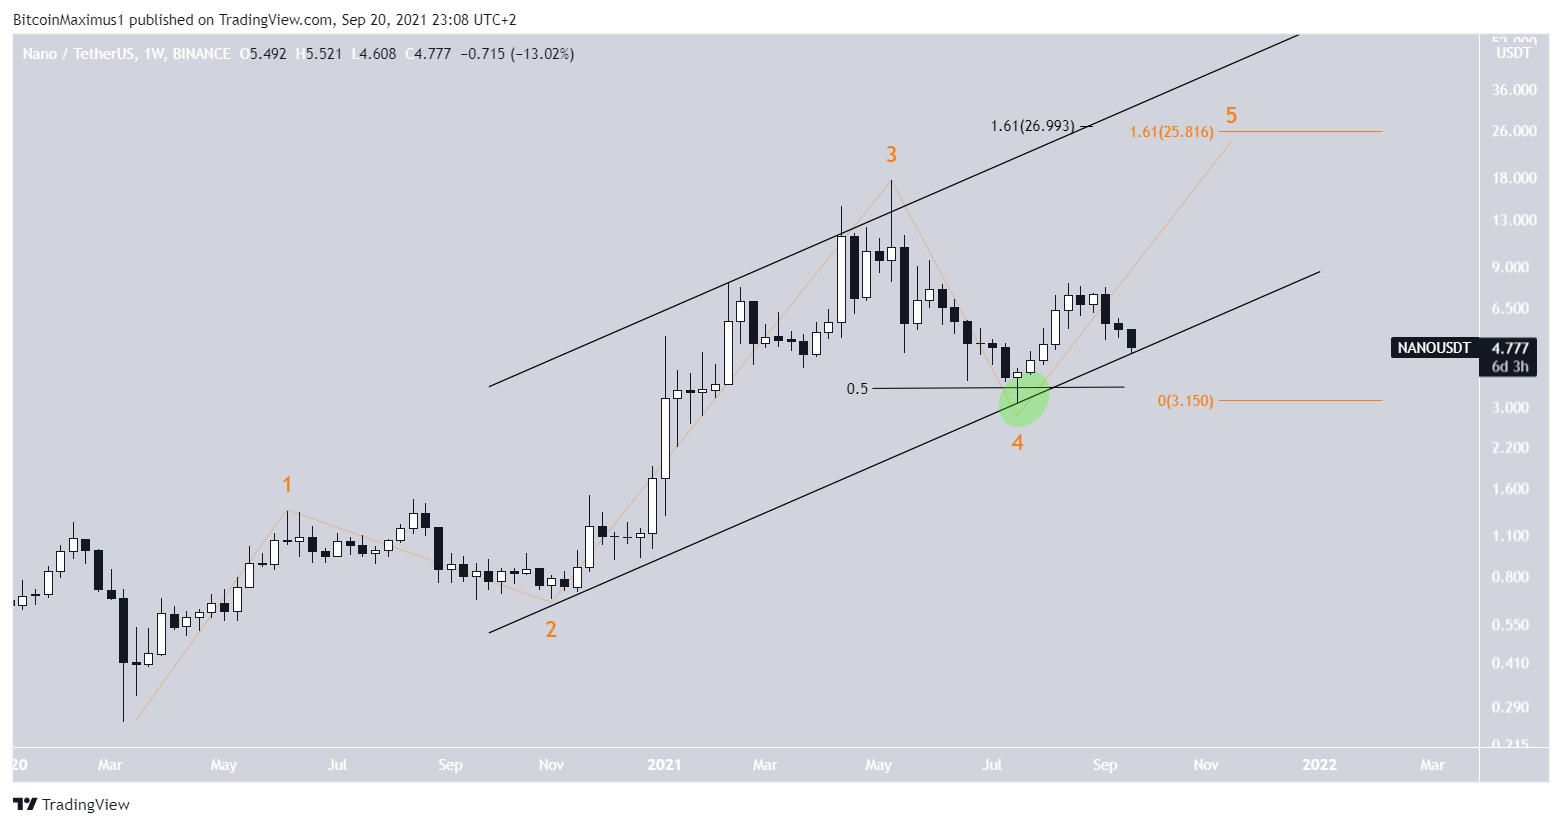
Cryptocurrency trader @Mesawine1 outlined a NANO chart, stating that it could be in the fifth and final wave of a bullish impulse.

The most likely wave count suggests that NANO is in wave five of a bullish impulse that began in March 2020.
It’s possible that the corrective wave four ended with the $3.10 low on July 20 (green circle). In this case, a potential target for the top of the upward move would fall between $25.80-$26.99. The target is found by the 1.61 length of waves 1-3 (orange) and the 1.61 external Fib retracement of wave four (black).
However, it’s barely holding on above the channel connecting the 2-4 wave lows. A breakdown below it would invalidate this potential count.
For BeInCrypto’s latest Bitcoin (BTC) analysis, click here.
Trusted
Disclaimer
In line with the Trust Project guidelines, this price analysis article is for informational purposes only and should not be considered financial or investment advice. BeInCrypto is committed to accurate, unbiased reporting, but market conditions are subject to change without notice. Always conduct your own research and consult with a professional before making any financial decisions. Please note that our Terms and Conditions, Privacy Policy, and Disclaimers have been updated.
