


![Monero’s Previous Pattern Anticipates Beginning of New Market Cycle [Premium Analysis]](/_mfes/post/_next/image/?url=https%3A%2F%2Fassets.beincrypto.com%2Fimg%2FzS3P_mEpwLIXwuFby4I4NA9wEis%3D%2Fsmart%2Fb76f106153064e1eb893ce73ad2ce157&w=1920&q=75)
The Monero (XMR) price has decreased to a significant support area at ₿0.006. Previous price movement and an RSI pattern suggest that an upward move will begin soon, which could have a magnitude of 300%, causing the price to reach ₿0.025.
The XMR price had been decreasing since a failed upward attempt on December 12, having lost roughly 15% of its value. However, it initiated a minor breakout on December 29, regaining some of its bullish sentiment.
Crypto trader and co-founder of “Chart Alerts” @Devchart tweeted out that he received an alert when XMR retested its previous all-time lows. Therefore, he anticipates a movement towards the range highs.
https://twitter.com/devchart/status/1210850333951479808?s=19
Will the price reach a new all-time low or will it initiate an upward bounce? Let’s take a closer look at price movement and determine which is more likely.
All-Time Low
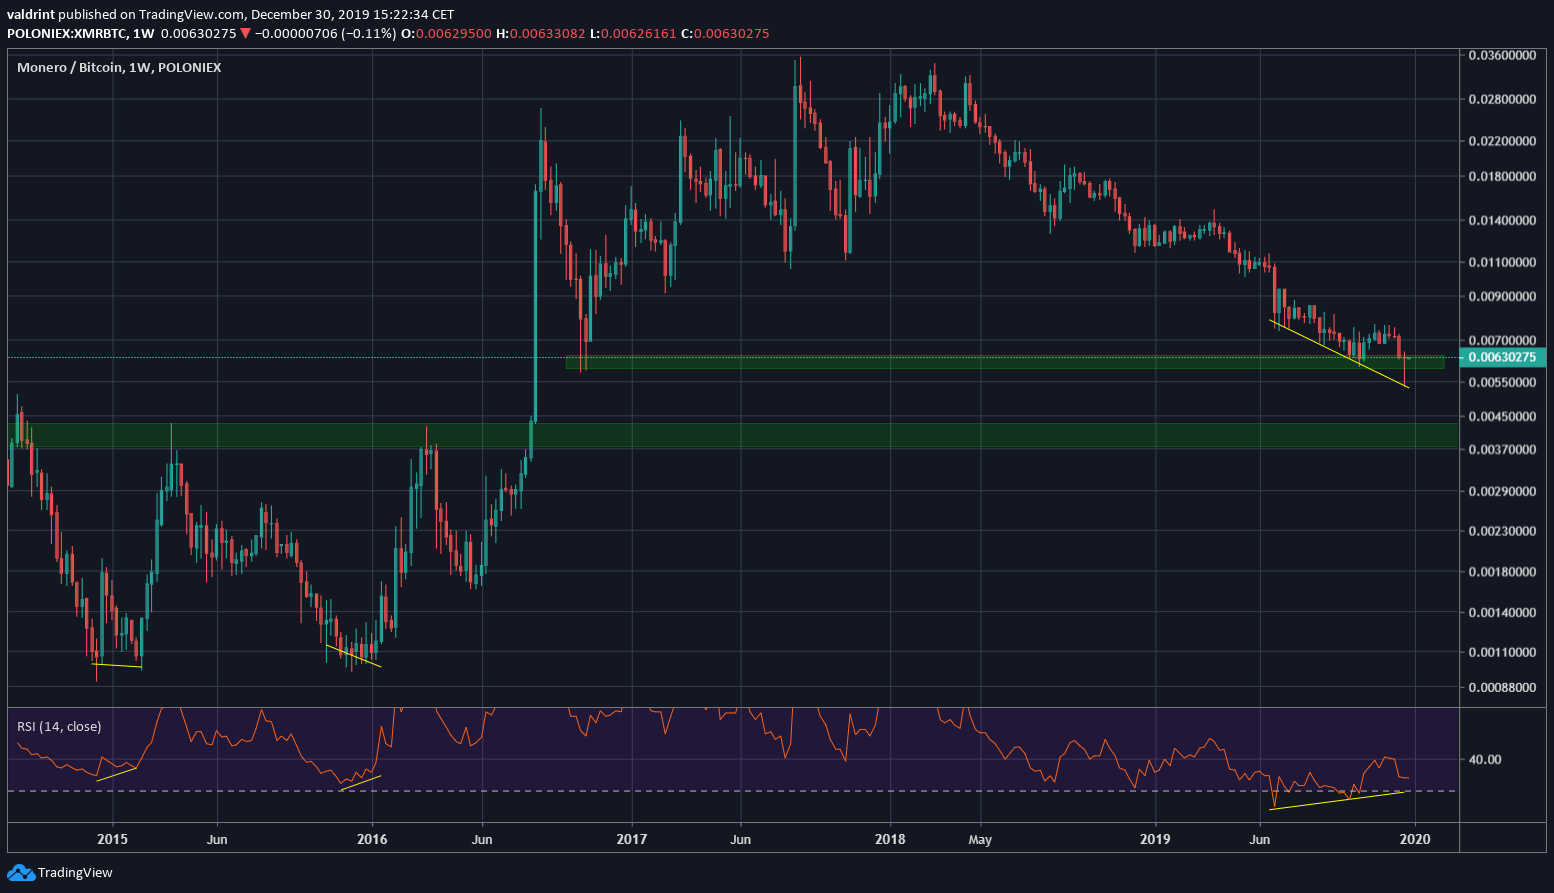
The weekly logarithmic chart shows that while XMR is indeed at a significant support area, this does not represent an all-time low.
The price has not traded below ₿0.006 since August 2016. But, there is an area that holds a lot of significance at ₿0.004. It acted as resistance through 2015 and the first part of 2016 until the price eventually broke out. The area has not been retested since.
The weekly RSI recorded its lowest ever value of 25 in July. Since then, it has been increasing, creating bullish divergence combined with the price decrease.
While the weekly RSI has never been oversold prior to July, it has generated bullish divergence twice before. Both times, upward moves of roughly 300% have followed.
XMR Previous Breakout
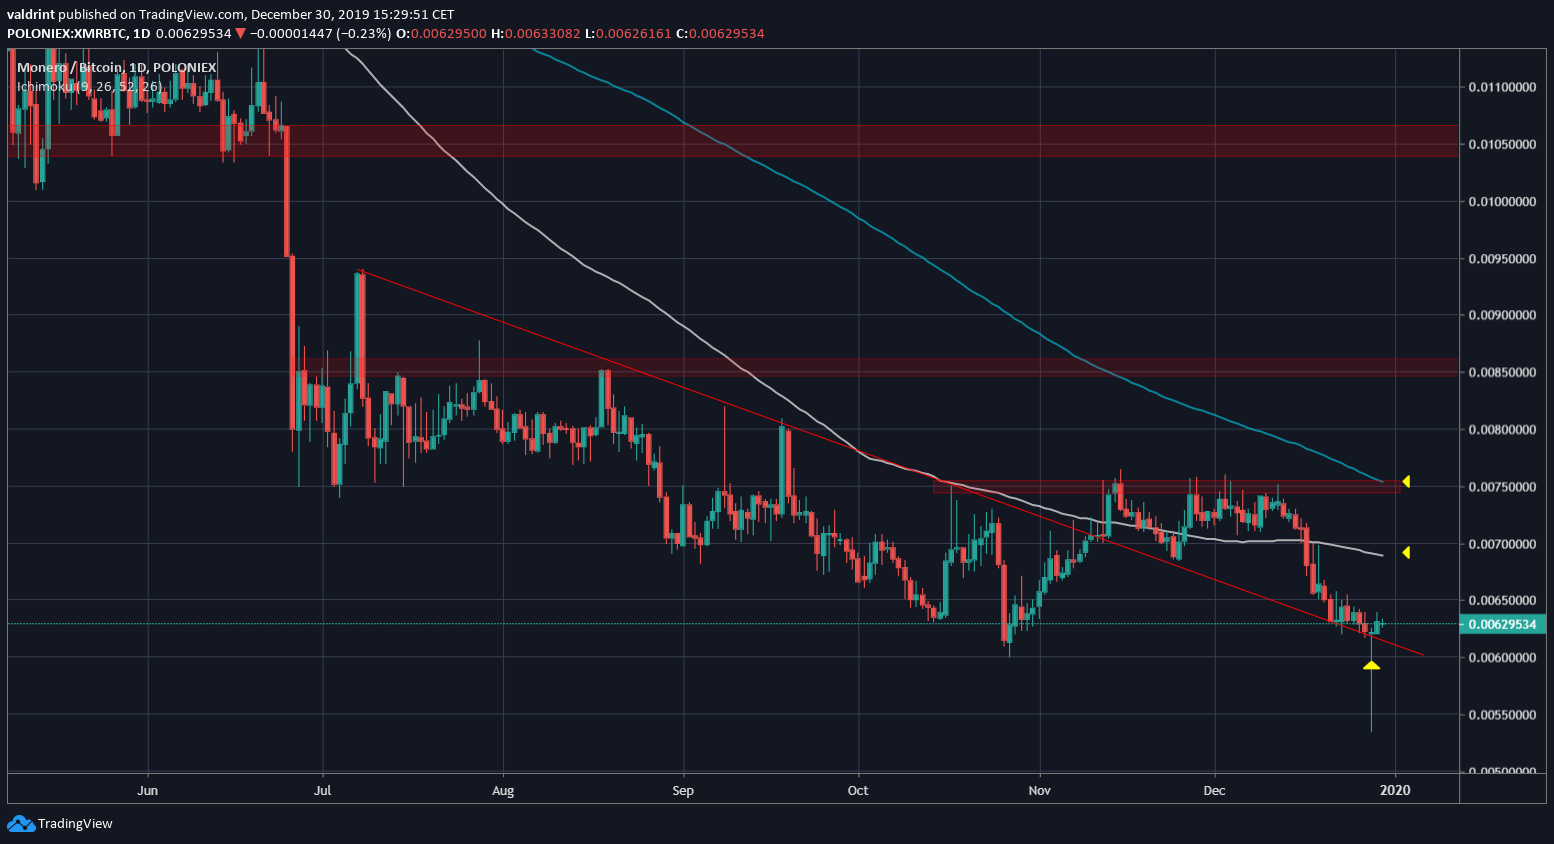
On November 10, the price broke out from a descending resistance line that had been in place since July 7. It made three attempts at breaking out above the resistance area at ₿0.0075, all unsuccessful. Afterward, it returned to validate the resistance line as support.
The upward move after the breakout was weak since the price failed to even reach the 200-day MA. Currently, it has fallen below the 100-day MA.
The next resistance areas are found at ₿0.0085 and ₿0.0105.
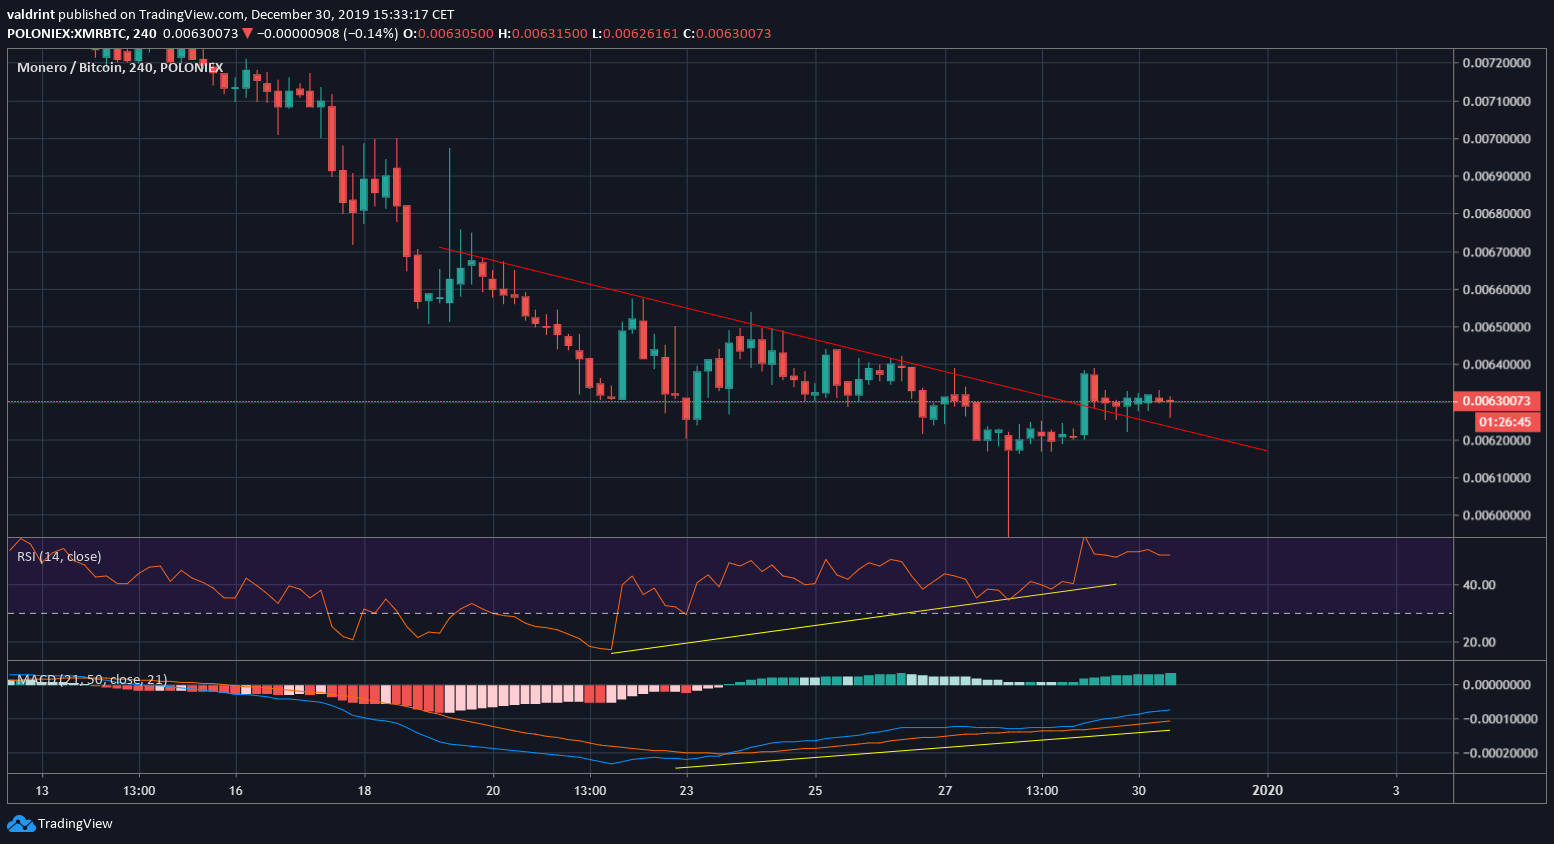
In the short-term, the XMR price has broken out from a descending resistance line. This breakout was preceded by a significant bullish divergence in both the RSI and the MACD.
Therefore, we can assume that the price will continue moving upward and head towards the resistance areas outlined previously. A breakout above the first resistance area and the 200-day MA would likely cause the rate of increase to intensify and signify that a new upward movement has begun.
This would fall in line with the previous two occasions in which there was a bullish divergence in the weekly RSI.
To conclude, the XMR price has reached a significant support area at ₿0.006, a breakdown below which would take it to ₿0.004. We do not believe that is likely. Instead, the price could begin a new upward cycle with a magnitude of roughly 300%, judging by previous patterns.
