
Be[in]Crypto takes a look at Bitcoin (BTC) on-chain indicators that relate to mining, such as the mining difficulty, fee ratio multiple, and market cap to Thermo cap ratio.
BTC mining difficulty
The BTC mining difficulty measures the number of hashes that are required in order to mine a block.
After the third halving (dotted line), the difficulty increased until March 29 2021 (black circle). Afterward, it fell sharply.
However, it has been increasing at an even more accelerated rate since July 2021 (red circle). It proceeded to reach a new all-time high this month.
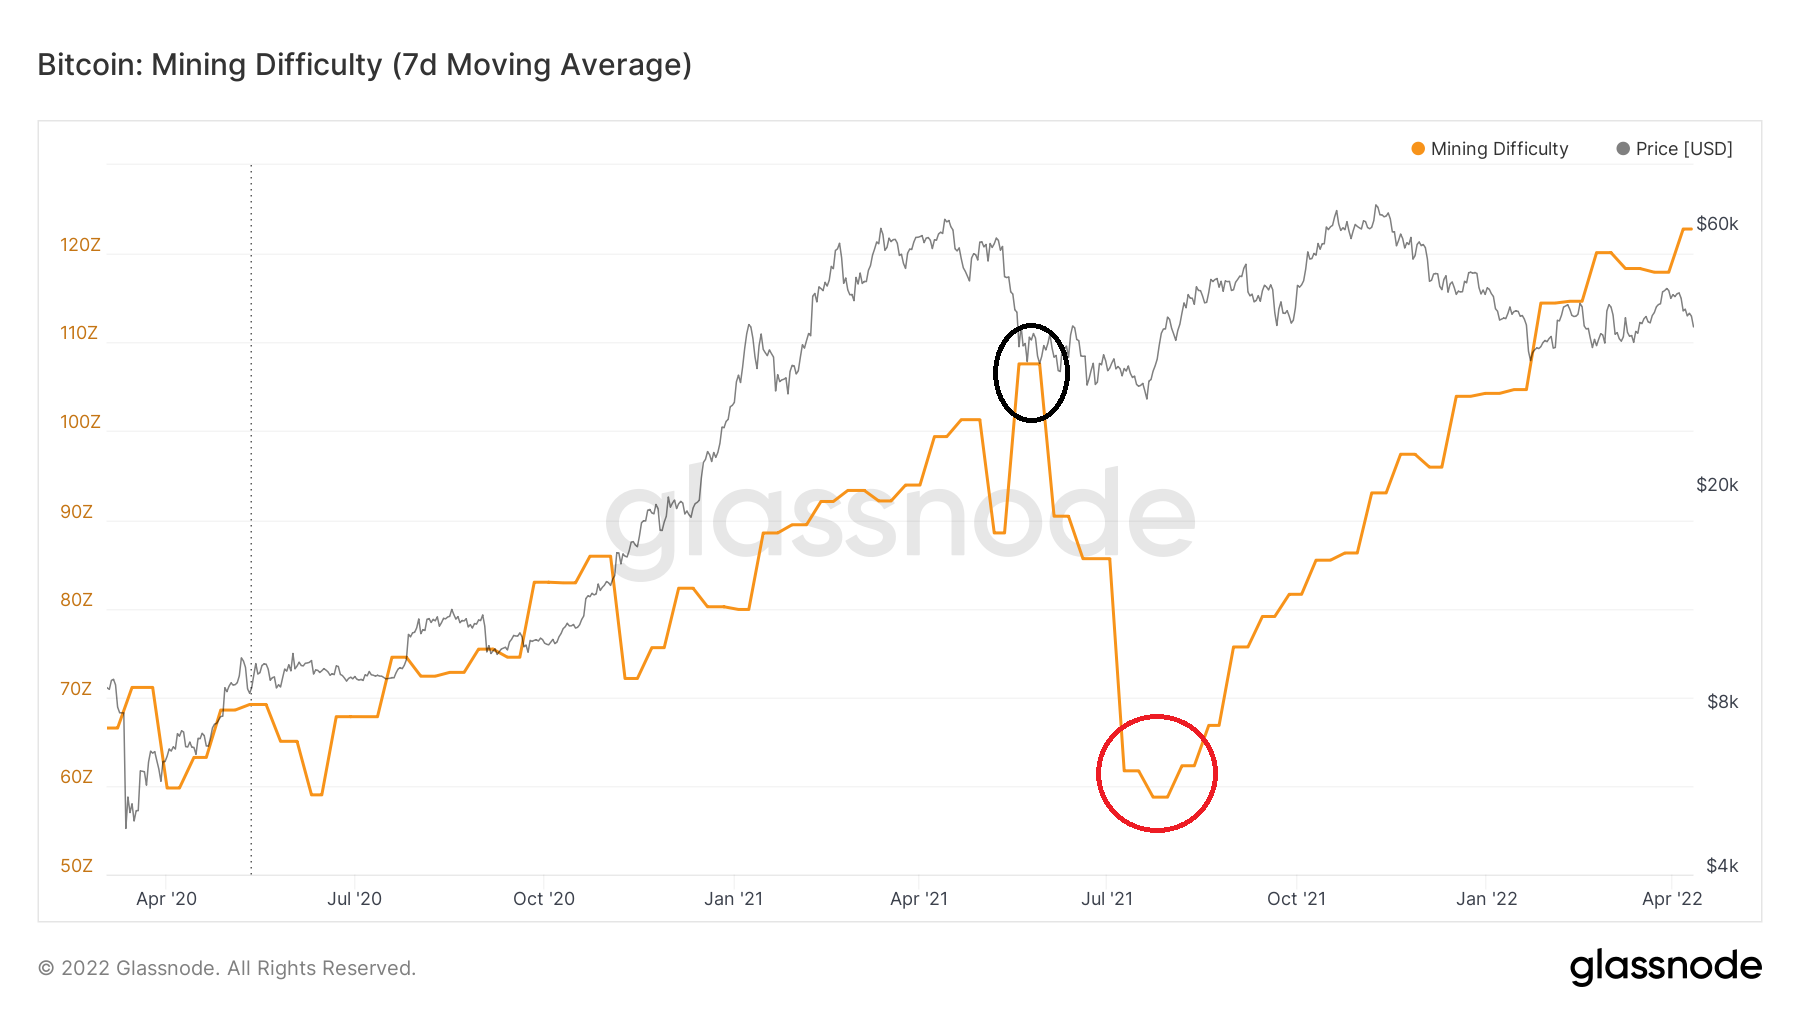
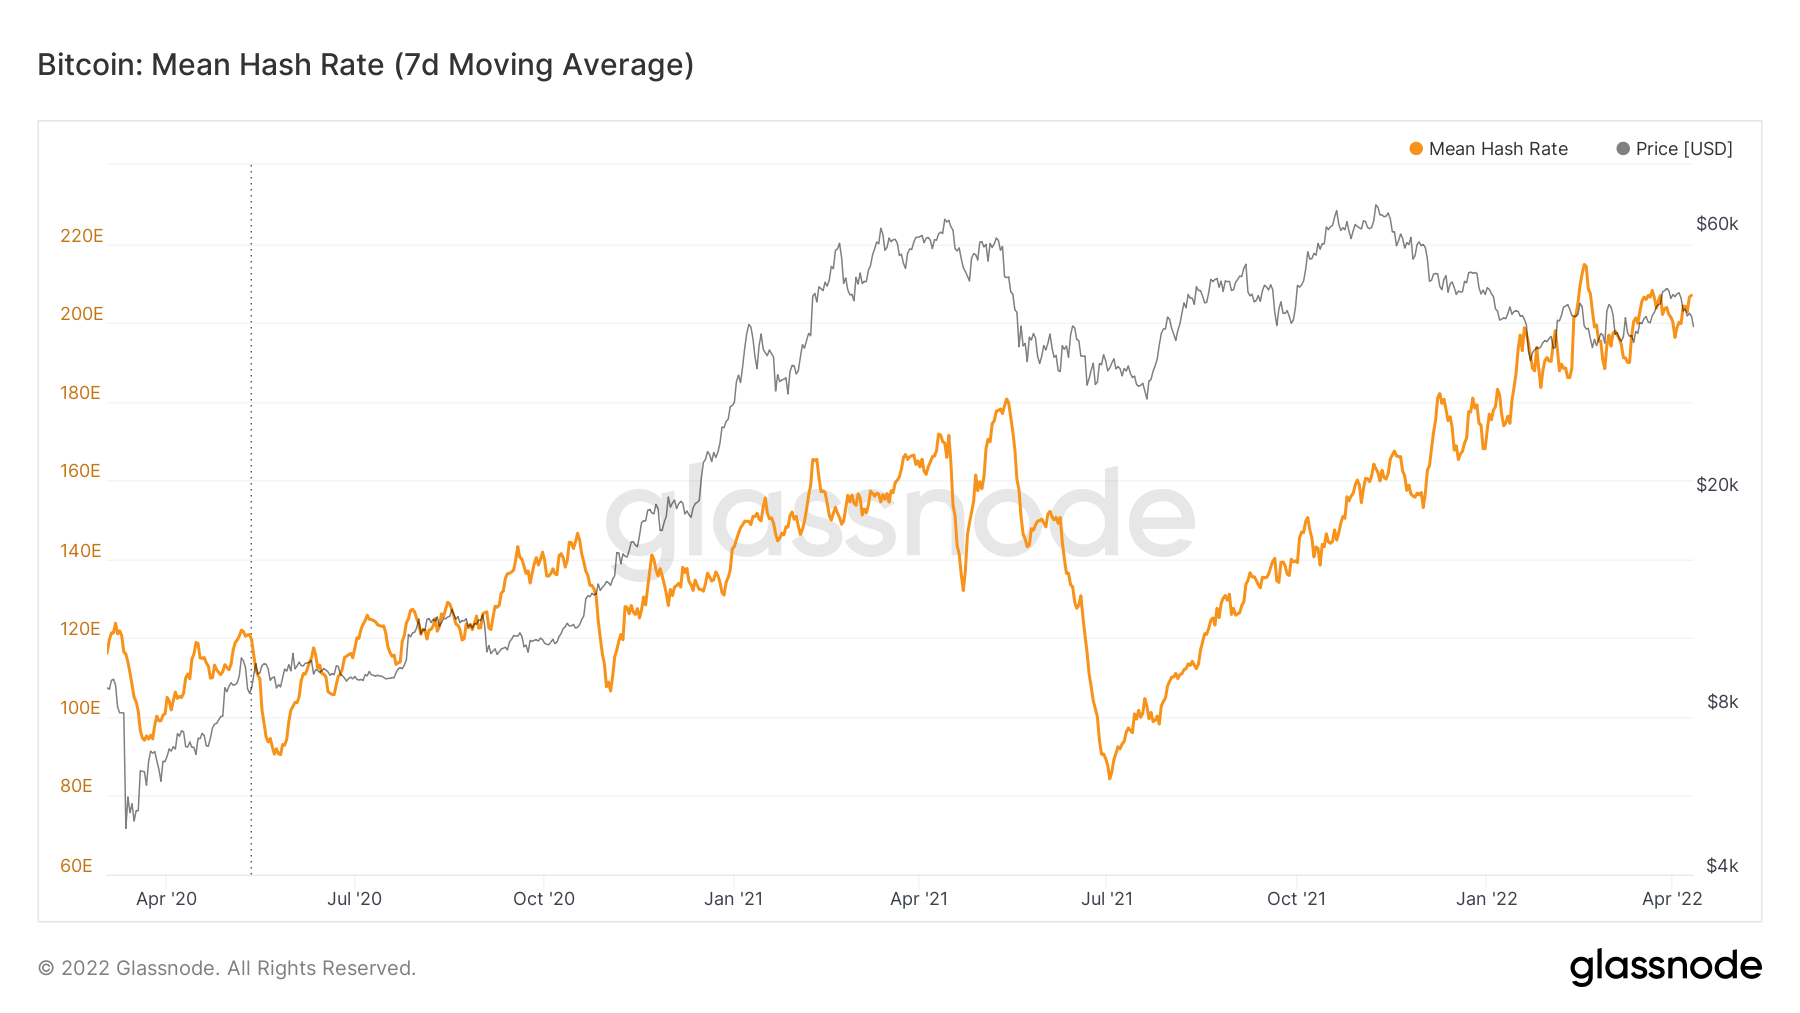
Considering that the hash rate is just below an all-time high, it is possible that a downward difficulty adjustment will transpire in the following weeks.
Fee ratio multiple
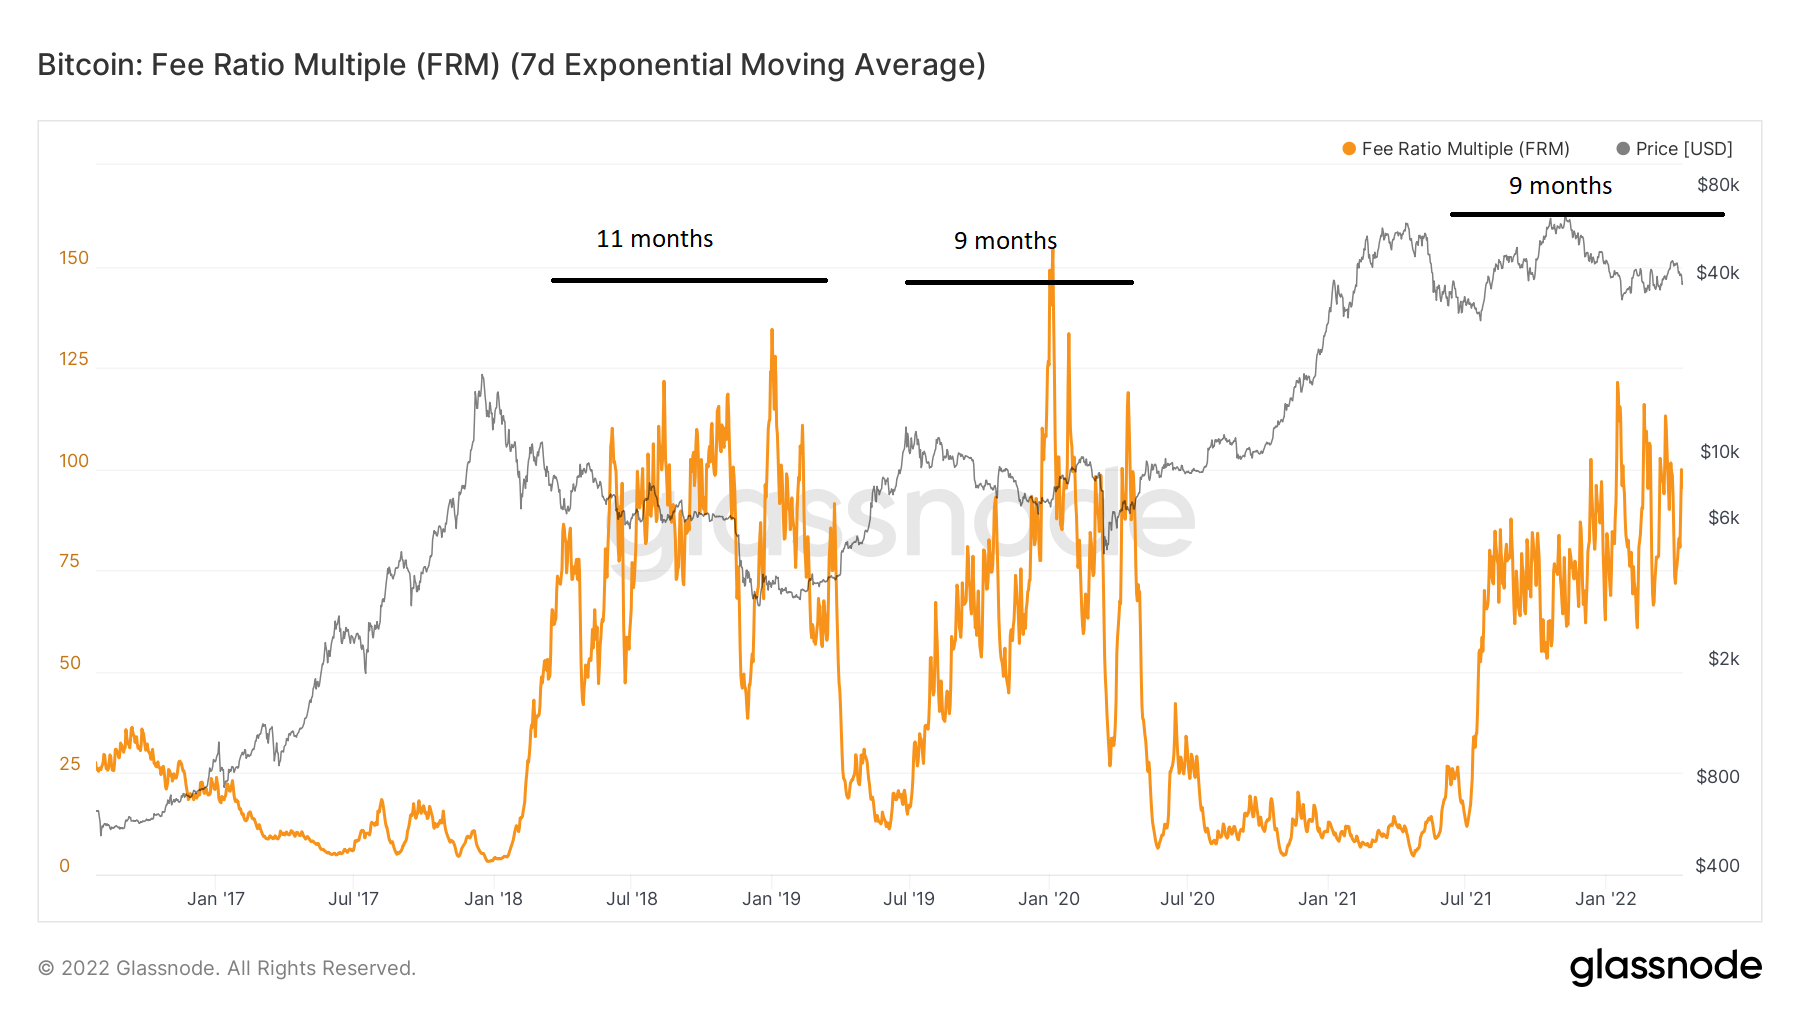
The Fee Ratio Multiple (FRM) is the ratio between miner revenue and transaction fees. It is a way to measure how secure the blockchain is if block rewards were to come to an end.
A low FRM indicates that the security can be maintained without block reward subsidies, while the opposite is true for high readings.
During bull markets, FRM is low, usually hovering below 20 (black line). However, the indicator spikes during corrections, reaching values above 100.
An interesting pattern comes from the length of time in which FRM stays high before a BTC bull run begins.
In 2018, it stayed above 60 for 11 months. In 2019, it did so for nine months.
FRM has been above 60 since Aug 2021, meaning that it has been high for the past nine months. Such readings have historically preceded bull runs.
Market Cap to Thermocap Ratio
The Thermocap is a BTC indicator that measures the cumulative sum of revenue generated by miners in order to secure the network.
The market cap to Thermocap ratio is an on-chain metric that measures the market value of BTC relative to miner spending. In a nutshell, it measures if BTC is at a premium or discount in comparison with the total amount that miners have spent.
Historically, values below 0.0000004 (highlighted in green) have been associated with bottoms. On the other hand, values above 0.000004 (highlighted in red) have been associated with tops.
Currently, it is at 0.0000014, which is closer to the bottom than it is to the top.
An interesting development has been transpiring since July 2021, when the BTC price was trading close to $30,000. At the time, the indicator showed a value of 0.00000125 (black line).
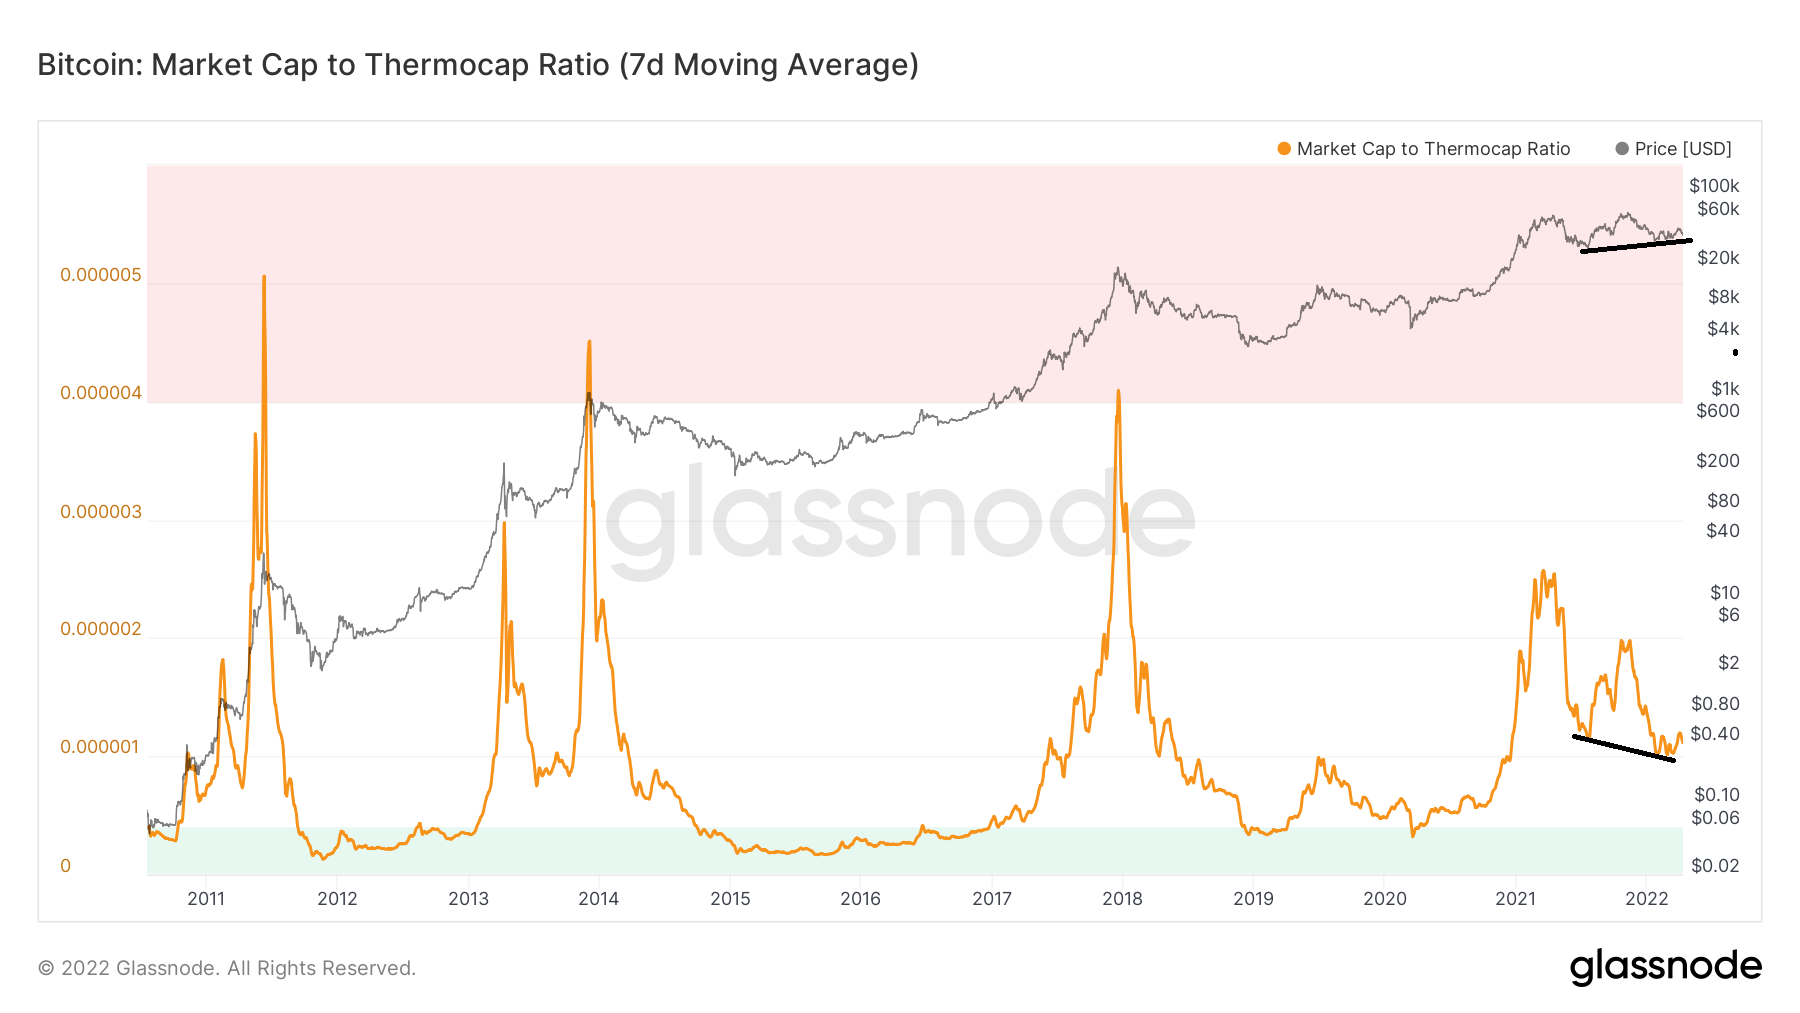
Currently, despite the BTC price being close to $40,000, the indicator is at 0.0000013
Therefore, according to this indicator, the BTC price is currently more undervalued than it was in July 2021
For Be[in]Crypto’s latest Bitcoin (BTC) analysis, click here
