

BeInCrypto takes a look at the Mayer Multiple (MM) and its components in order to determine if the long-term bias is bullish or bearish.
What is the Mayer Multiple?
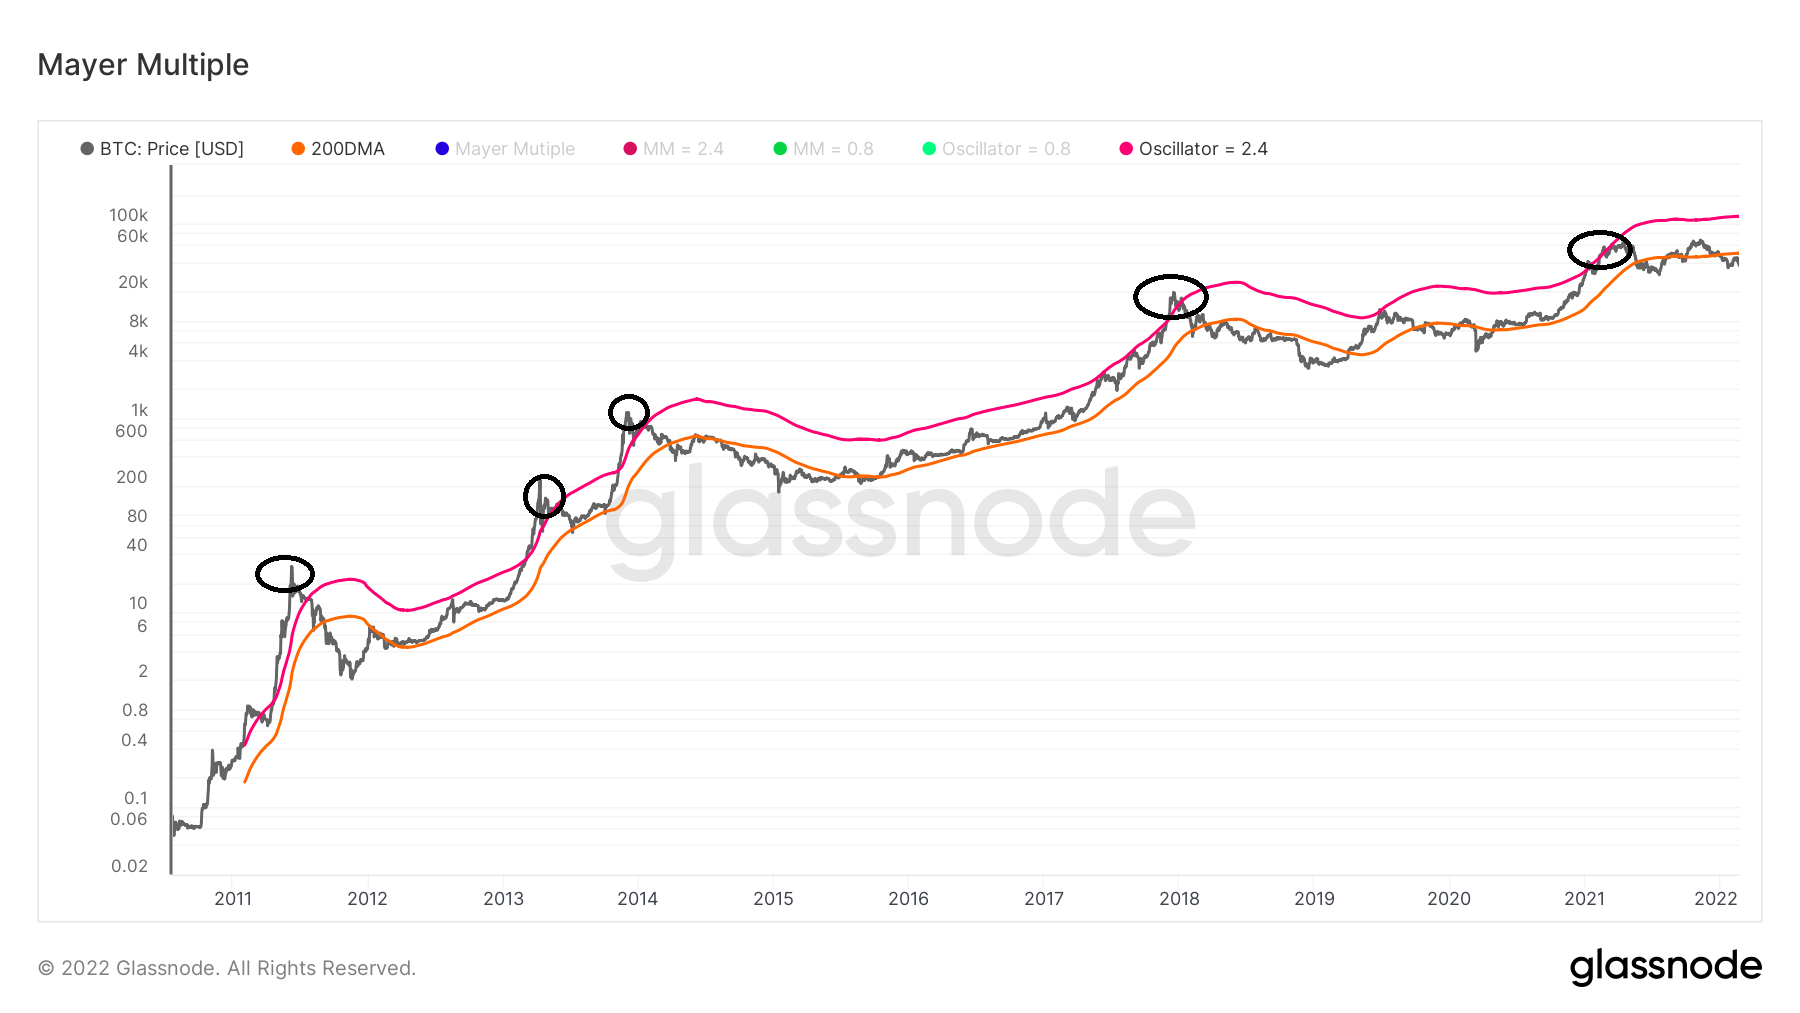
The Mayer Multiple is an oscillator that is calculated by taking the ratio between the BTC price and its 200-day moving average (MA), which is shown in orange.
To be more precise, the 2.4 multiplication of this MA (purple) is used in order to determine market cycle tops. In all previous market cycle tops, the BTC price moved above this MA (black circles) before correcting.
In the current bull run, the BTC price increased above this level on February 2021. At the time, it was breaking $50,000 for the first time. However, it has been falling since.
Movements below the 200-day MA have been historically associated with bottoms. However, unlike tops, the bottoms are not as precise, since the price usually hovers below the MA for a considerable period of time before a bottom is reached.
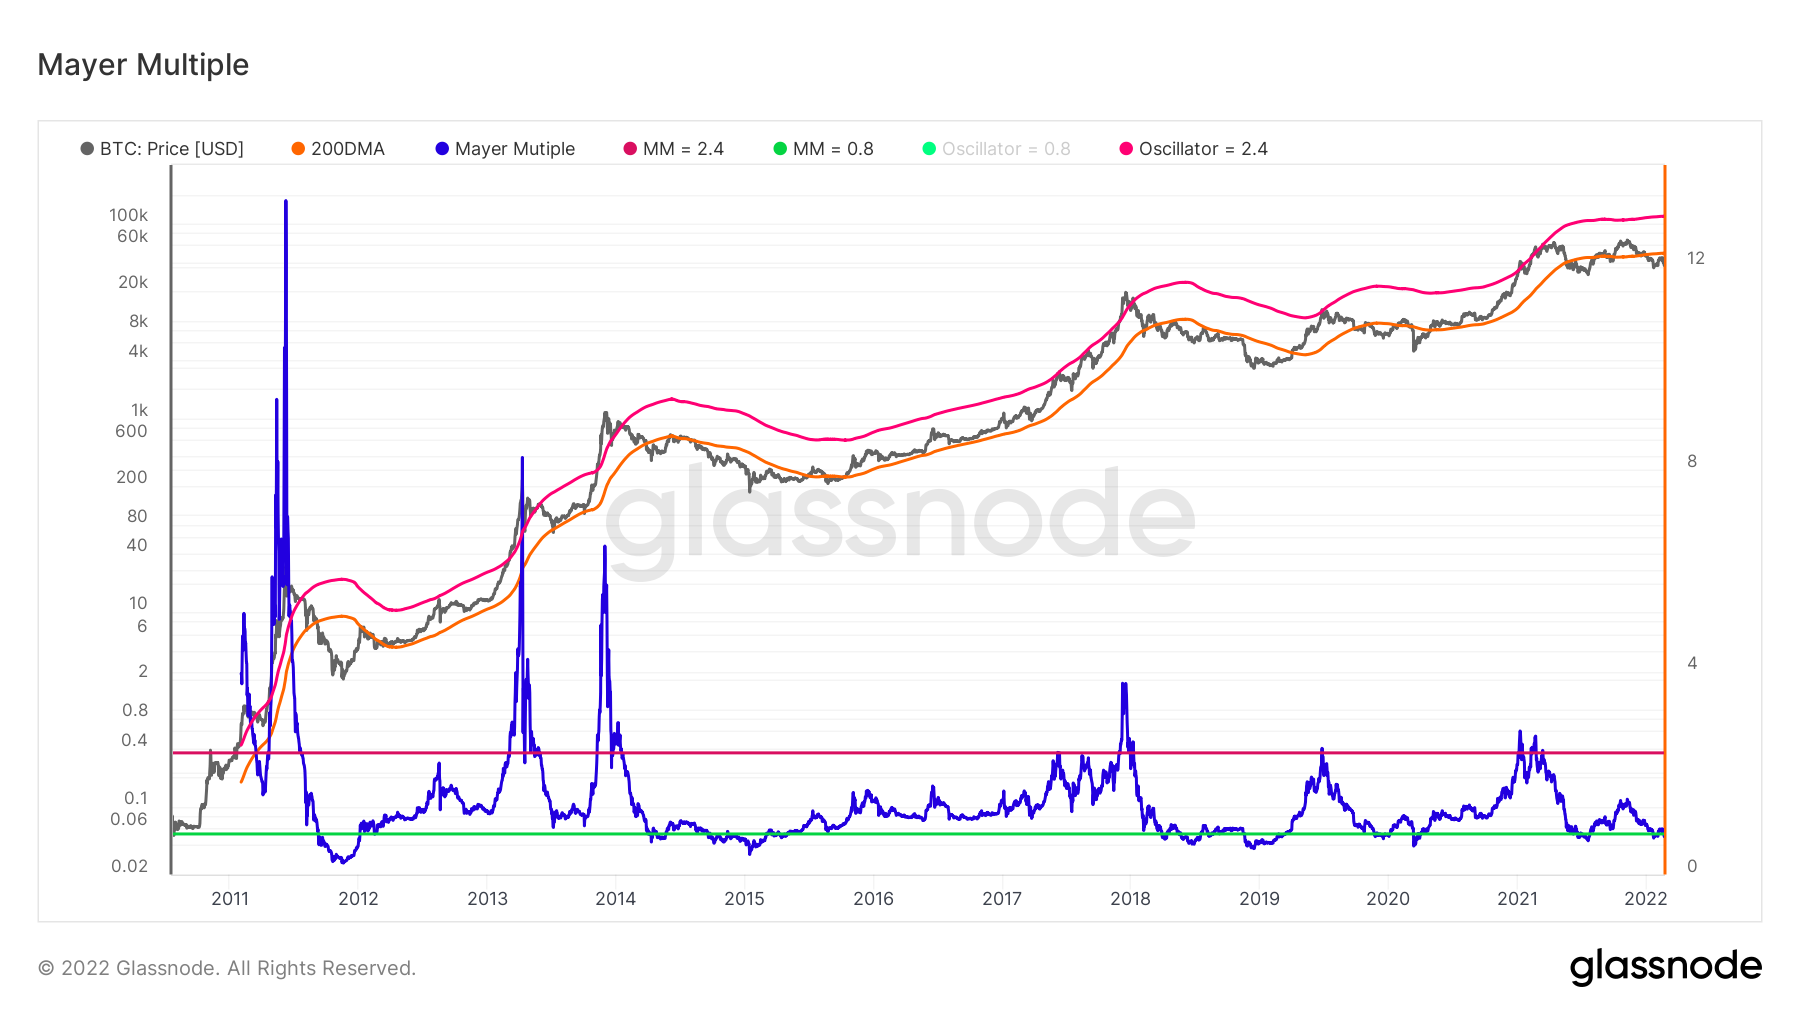
Afterwards, the actual MM reading is plotted as a line (blue), with horizontal multiples of 0.8 (green) and 2.4 (red) acting as the lower and upper bounds.
As can be seen by plotting both MM and the BTC price together, times in which the multiple moves above its 2.4 oscillator coincides with those in which the BTC price moves above the 2.4 oscillator of its 200-day MA.
However, when using MM, it can more easily be seen just by how much the price has deviated above its range.
Current reading
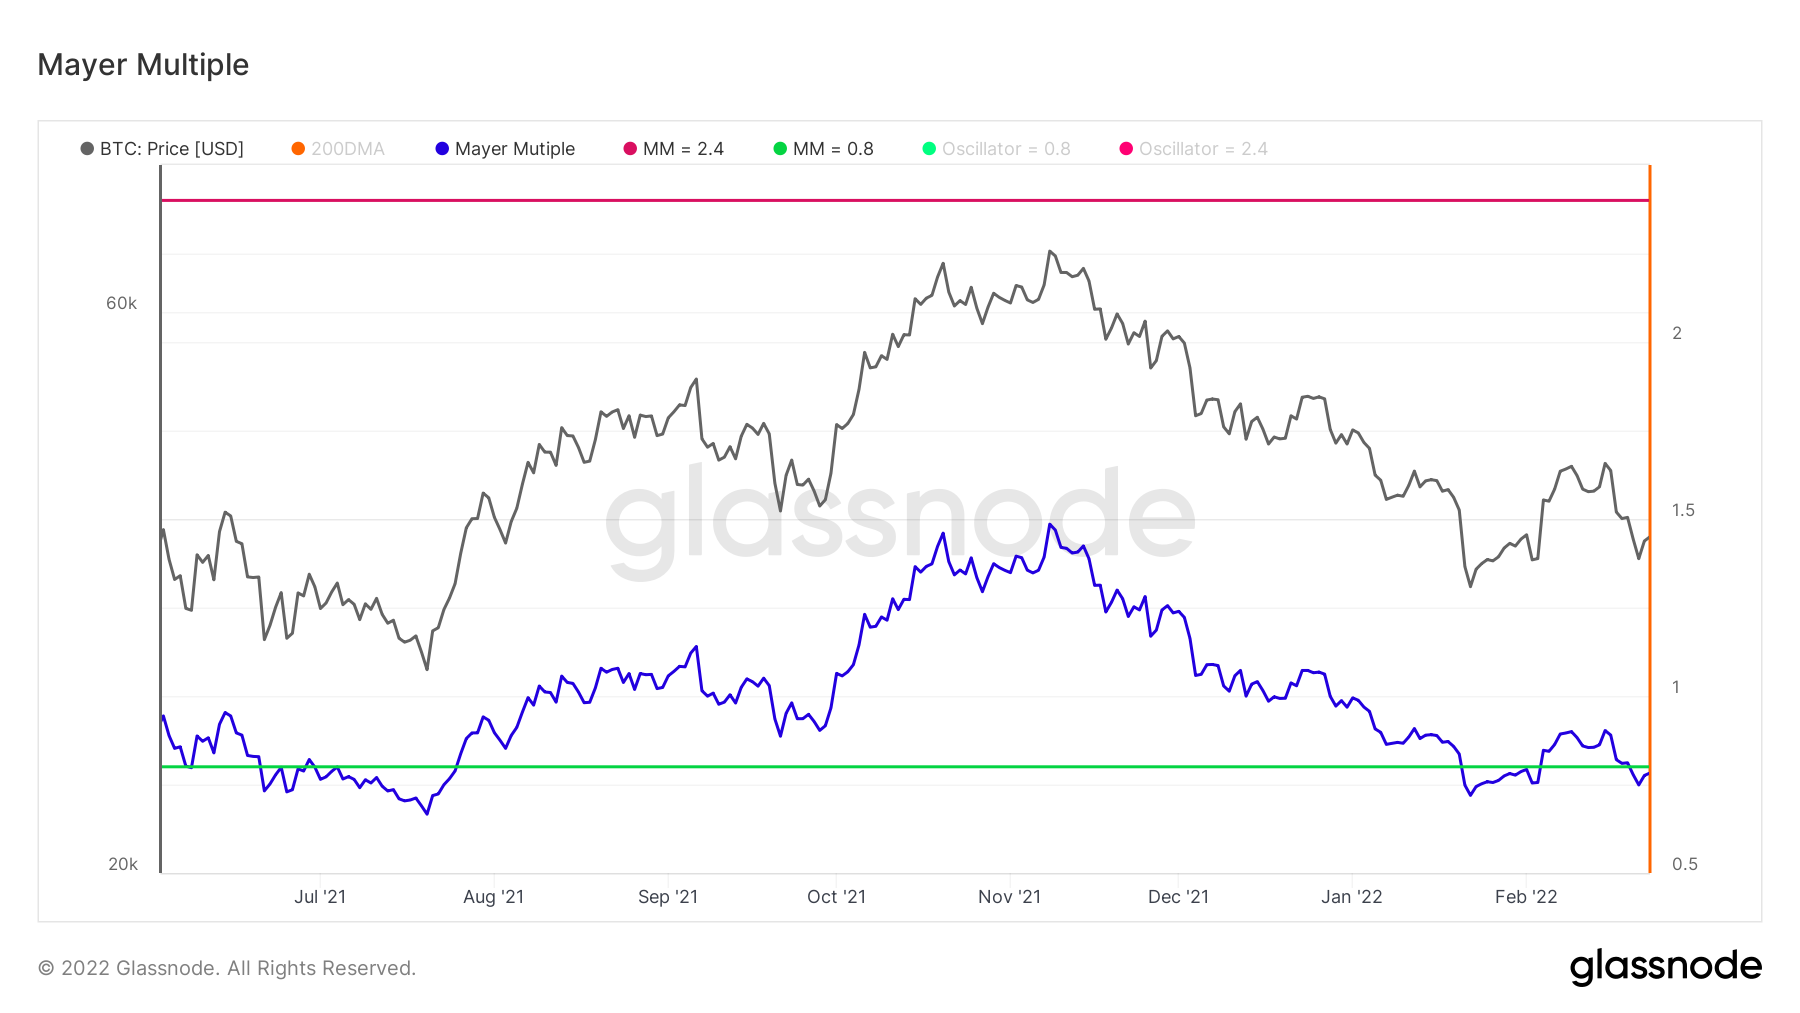
MM is currently trading below its 0.8 oscillator. As seen above, this historically has indicated that a bottom is in.
The previous time the indicator fell below this level was during the June/July 2021 bottom.
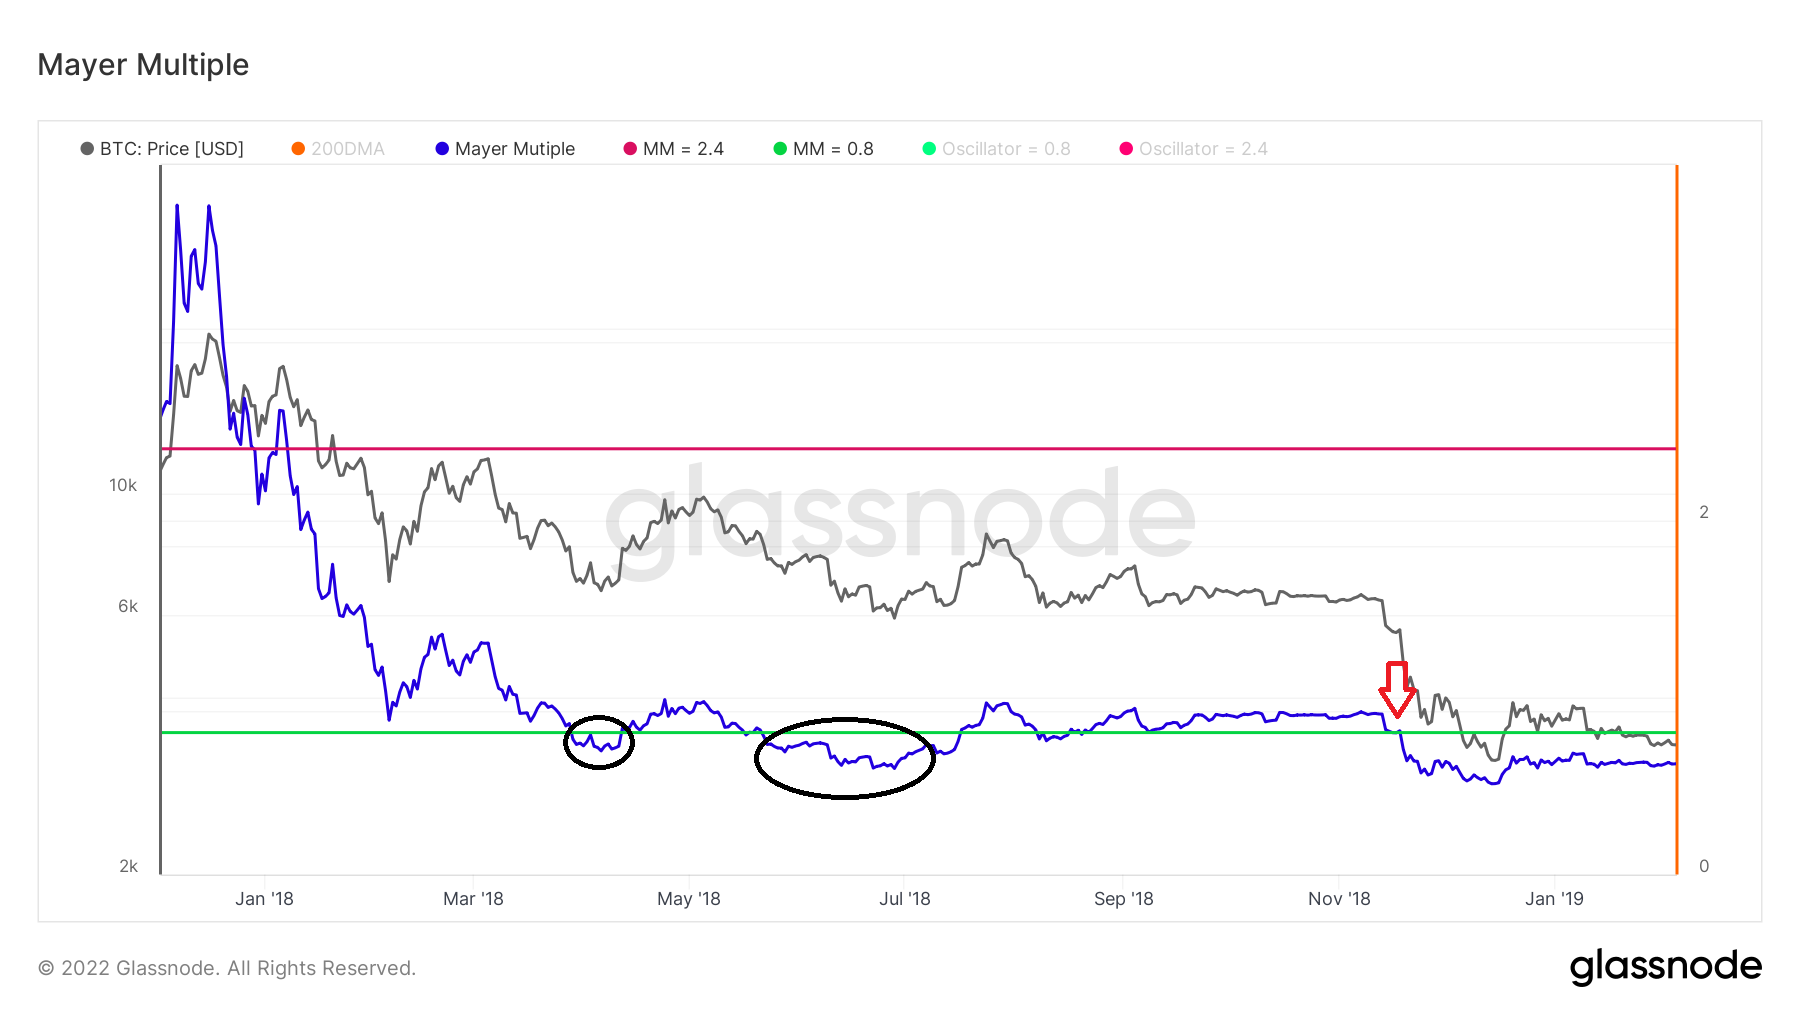
The movement since April 2021 can be used to draw parallels with that after the 2018 BTC top
In April 2018 MM fell below this oscillator twice, before reclaiming it. However, it only hovered above it for roughly six months before another breakdown followed.
Conclusion
To conclude, MM has fallen below its 0.8 oscillator, suggesting that the bottom might be in.
However, if MM fails to move above the oscillator and consolidates above it, it could mean that BTC is in a bear market instead.
For BeInCrypto’s latest Bitcoin (BTC) analysis, click here
Disclaimer
In line with the Trust Project guidelines, this price analysis article is for informational purposes only and should not be considered financial or investment advice. BeInCrypto is committed to accurate, unbiased reporting, but market conditions are subject to change without notice. Always conduct your own research and consult with a professional before making any financial decisions. Please note that our Terms and Conditions, Privacy Policy, and Disclaimers have been updated.
