


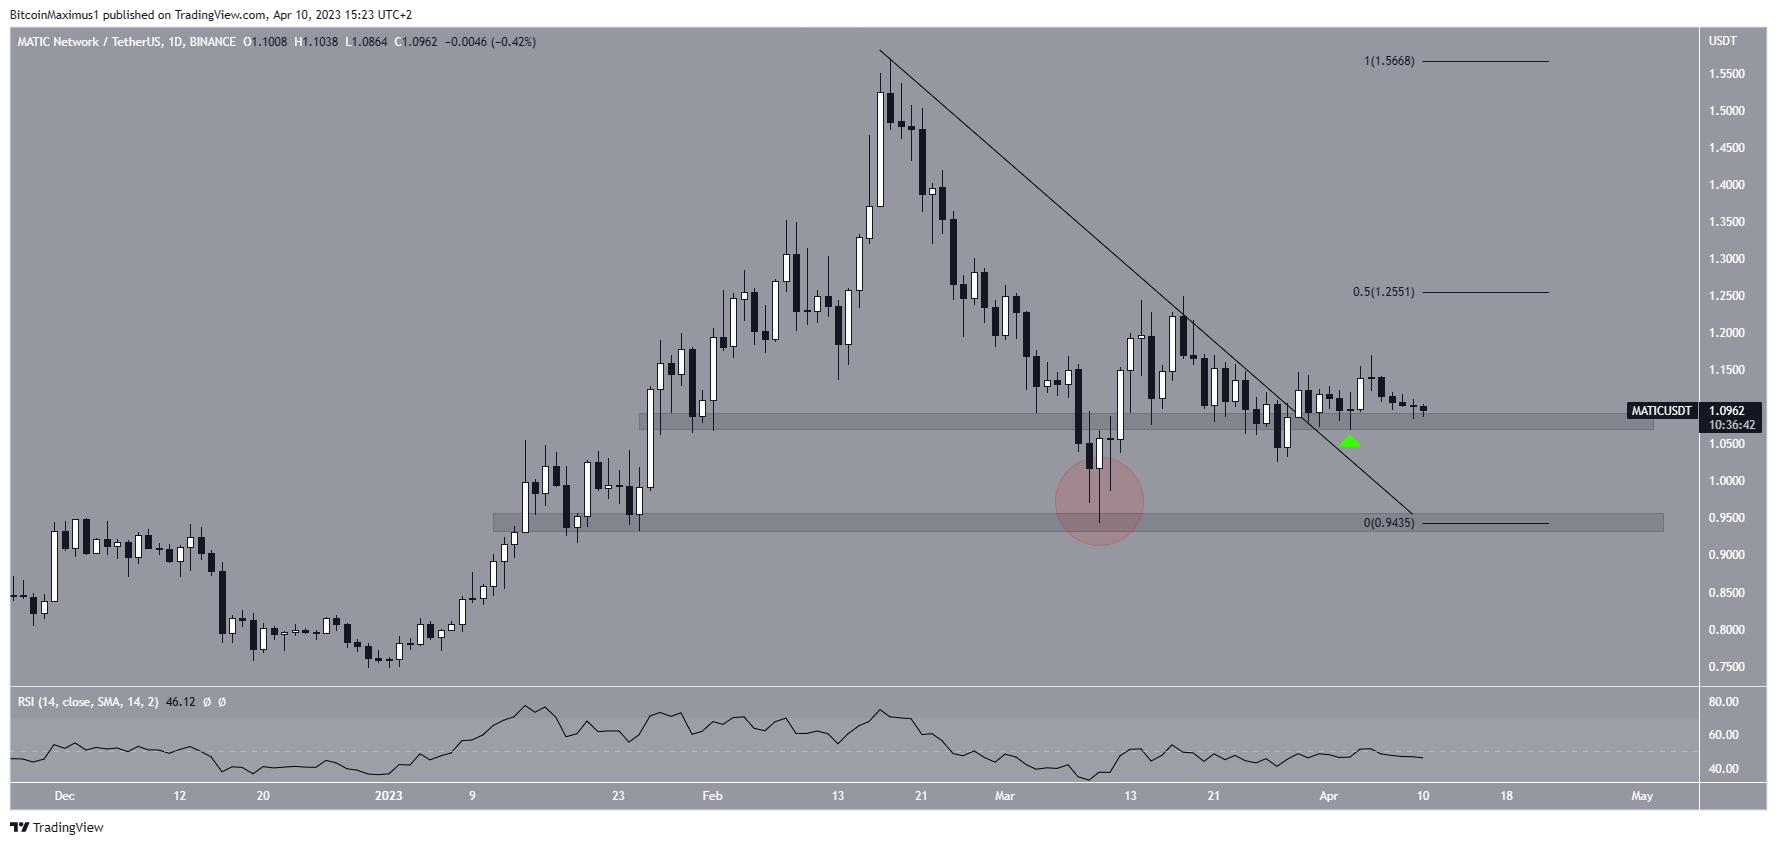
The Polygon (MATIC) price broke down from a short-term structure but still trades above a horizontal support area.
MATIC is the native token of the Polygon network, a layer-2 scaling solution that focuses on smart contracts. The technical analysis of the MATIC price on the daily time frame reveals that on March 29, the price broke out from a descending resistance line. This confirmed the reclaim of the minor support area at $1.08. Additionally, it renders the previous decline below that area (red circle) invalid.
However, the price has failed to sustain the upward movement despite the breakout. Moreover, it failed to even reach the 0.5 Fib retracement resistance level at $1.25. So, it allows for the possibility of another drop.
If the price falls below the $1.08 support area, it may trigger a significant drop toward the next closest support at $0.95. However, the MATIC token price could finally reach the $1.25 resistance if a bounce occurs.
The daily RSI is below 50 and decreasing. As a result, it aligns more with the possibility of a breakdown.
Short-Term Polygon (MATIC) Breakdown Could Catalyze Sharp Fall
The technical analysis from the short-term two-hour chart suggests that a breakdown below $1.08 is more likely. The reason for this is the breakdown from a short-term ascending support channel. Such channels usually contain corrective movements like the A-B-C structure inside the channel. Therefore, its presence indicates that the trend is bearish, and the previous increase was corrective.
A drop that travels the entire height of the previous descent (highlighted) would take MATIC to $0.95, providing more confluence to the support area.
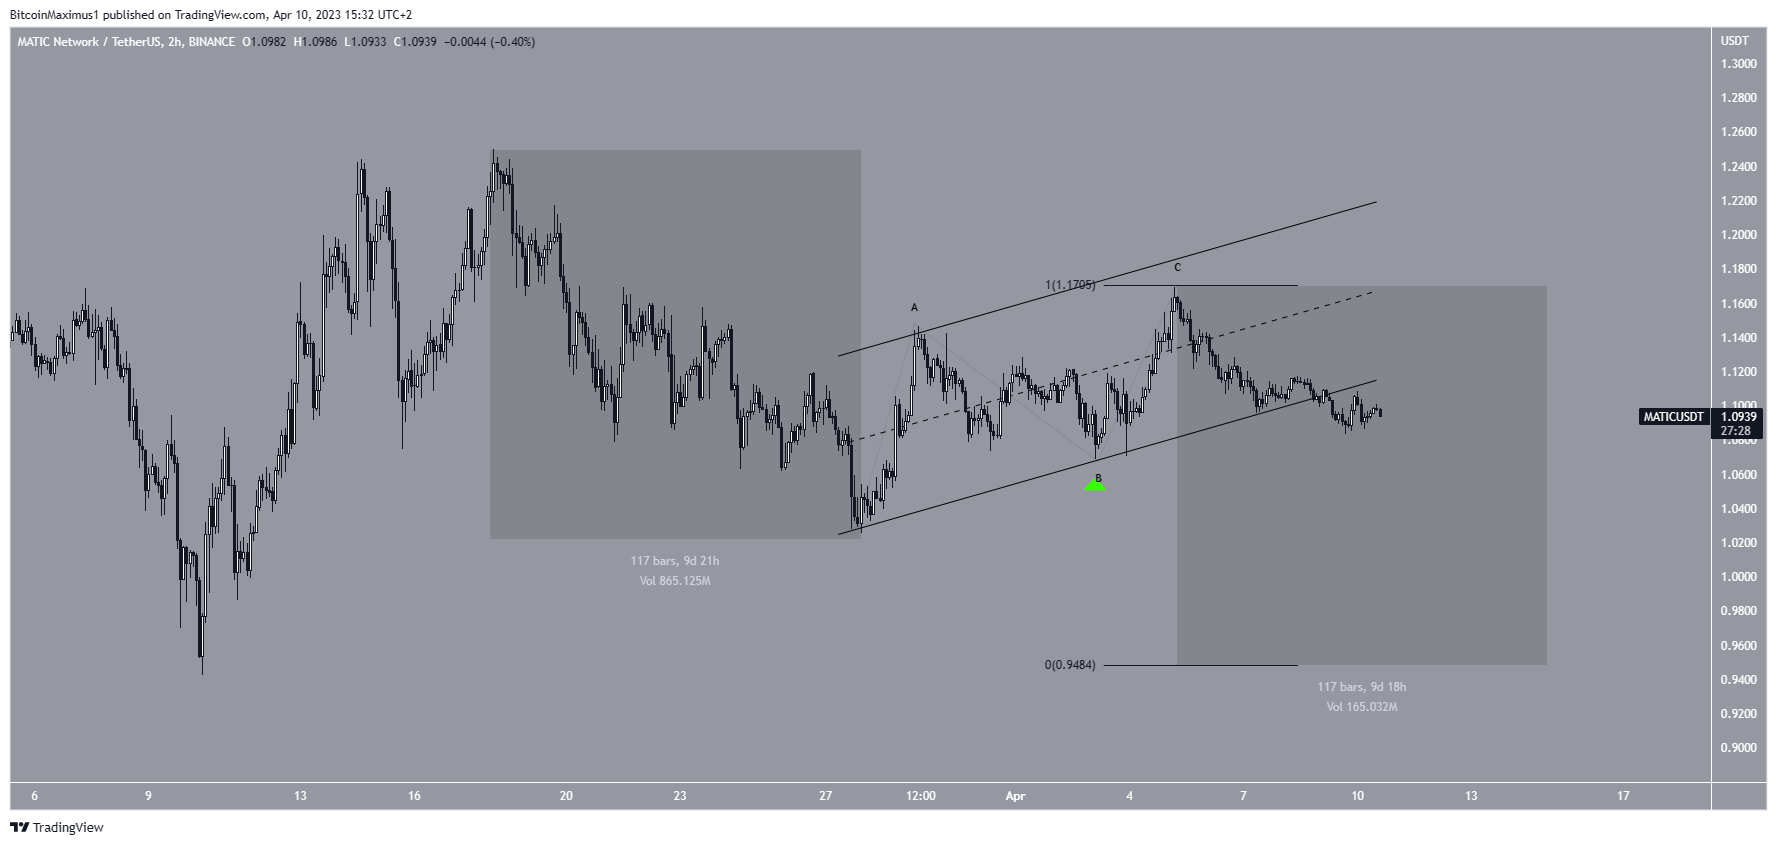
To conclude, the most likely Polygon price forecast is a breakdown from the $1.08 horizontal support area and a decrease to $0.95. Reclaiming the previous channel would invalidate this bearish hypothesis and could lead to a bounce toward $1.15.
For BeInCrypto’s latest crypto market analysis, click here.


