

Matic Network (MATIC) has broken down below an important horizontal support area and is showing bearish signs in multiple time frames.
Since May 2021, when MATIC first reached a high of $2.70, MATIC has been trading inside an ascending parallel channel. On December 27, 2021, the price reached an all-time high of $2.92, validating the resistance line of the channel.
The high was combined with bearish divergence in the RSI (green line). The divergence was very significant since it is transpiring in the weekly time frame. MATIC has been falling since and is currently very close to the support line of the channel.
A bearish development comes for the fact that the RSI has now fallen below 50 (red icon). Previously, the cross above 50 (green icon) marked the beginning of the upward movement that led to the all-time high.
Therefore, a decrease below 50 could potentially mark the beginning of the bearish trend.

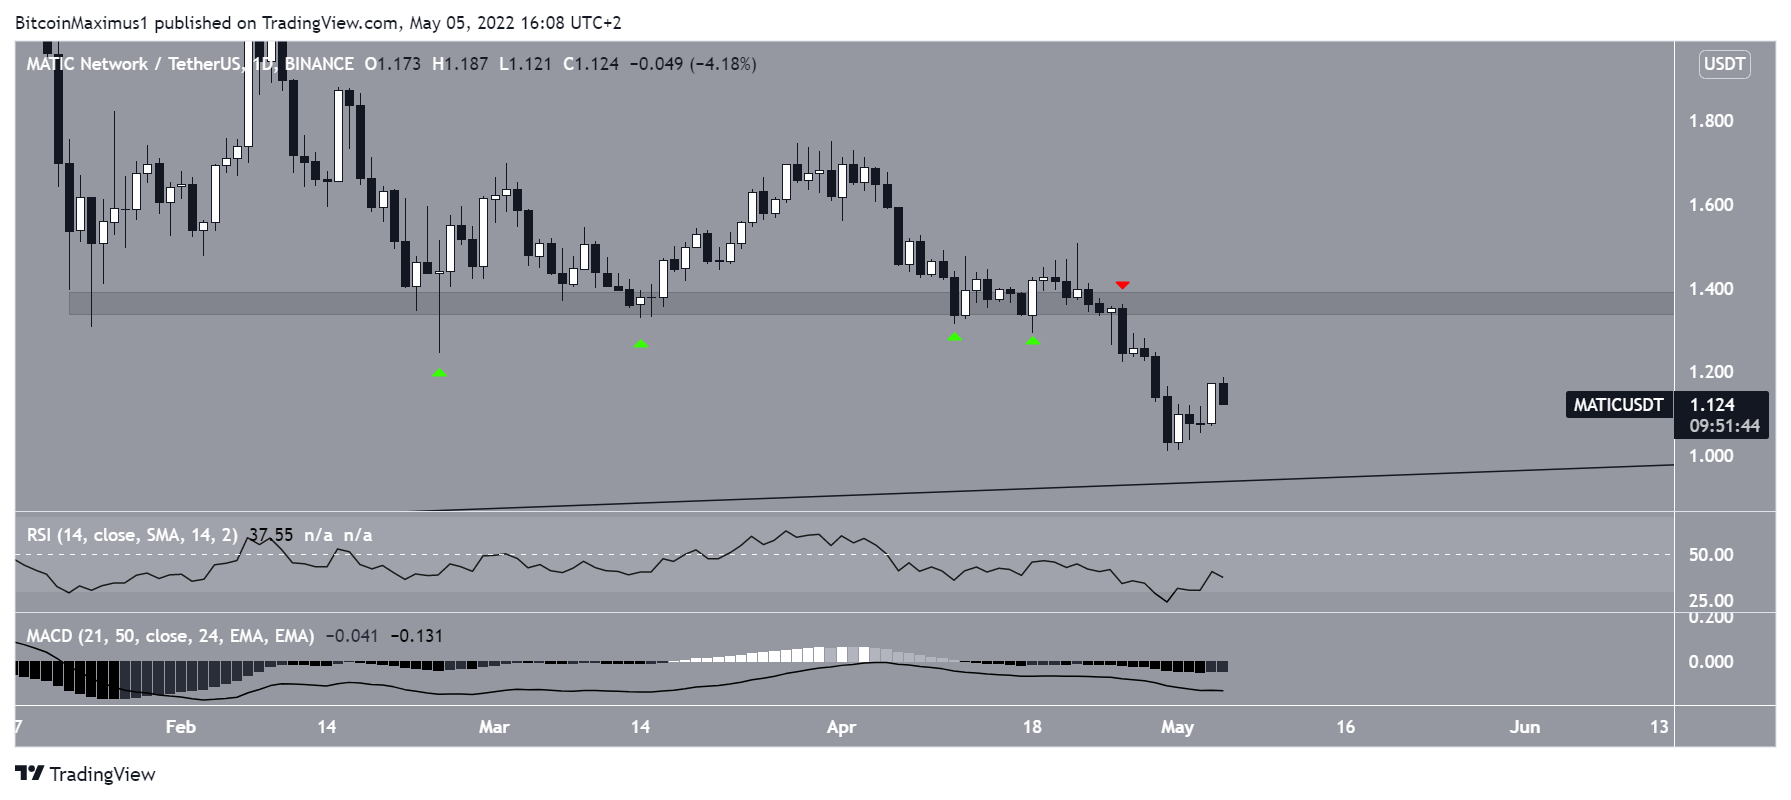
Short-term movement
The daily time frame shows that After bouncing above the $1.37 area four times (green icons), MATIC broke down below it on April 26 (red icon). The area is now expected to provide resistance.
Similarly to the weekly time frame, the RSI and MACD are both bearish and decreasing. While the RSI is extremely oversold, there is no bullish divergence in place.
As a result of both the price action and the bearish readings, a drop towards the support line of the channel would be expected.
Cryptocurrency trader @CryptoPoseidonn stated that MATIC is not yet done decreasing and will fall towards the support line of the long-term channel.

Since the tweet, MATIC has bounced and reached a high of $1.18. However, this validated the resistance line of a shorter-term ascending parallel channel, and the price has been falling since.
Due to the fact that such channels usually contain corrective movements, a decrease towards the support line of the channel and eventual breakdown seems to be the most likely scenario.

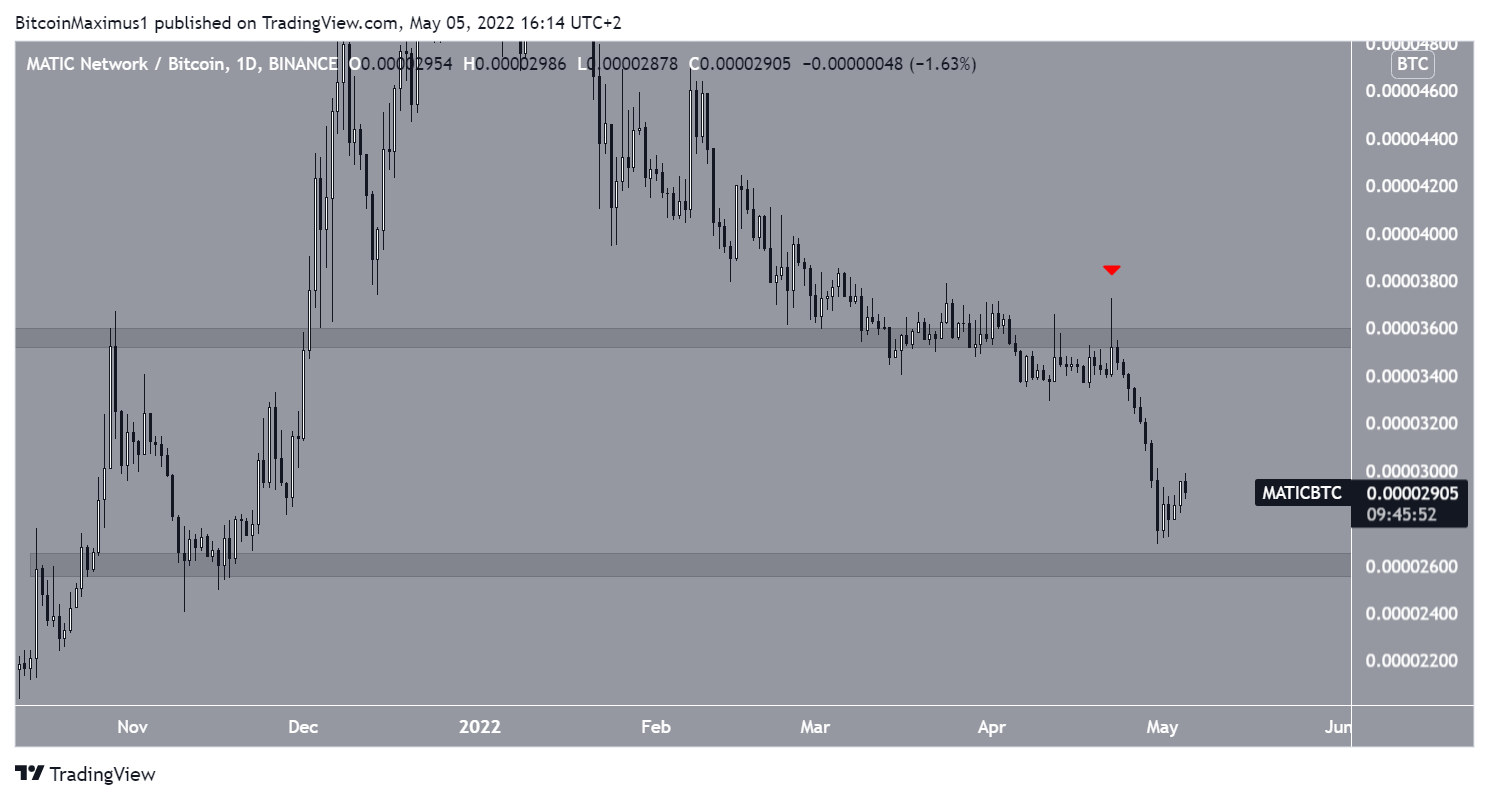
MATIC/BTC
Similarly to the USD pair, MATIC/BTC shows bearish price action. It broke down below the 3600 satoshi support area on April 4 (red icon) and has been falling at an accelerated rate since. The area is now expected to provide resistance.
The closest support area is found at 2600 satoshis.
For Be[In]Crypto’s previous Bitcoin (BTC) analysis, click here.
What do you think about this subject? Write to us and tell us!
Disclaimer
In line with the Trust Project guidelines, this price analysis article is for informational purposes only and should not be considered financial or investment advice. BeInCrypto is committed to accurate, unbiased reporting, but market conditions are subject to change without notice. Always conduct your own research and consult with a professional before making any financial decisions. Please note that our Terms and Conditions, Privacy Policy, and Disclaimers have been updated.
