

The Matic Network (MATIC) price had been trading in a range between 180-250 satoshis since suffering a major downturn on Dec 10, 2019. It finally broke out above resistance on March 3, 2020 and has been increasing since.
Matic (MATIC) Price Highlights
- The price broke out above a significant resistance area.
- It is following an ascending support line.
- There is resistance at 310, 355, and 400 satoshis.
06 – $MATIC +19%
— Loma (@LomahCrypto) March 4, 2020
– Indian Ban Lift might allow me to rebrand to Sandeep pic.twitter.com/6ViJziuvvG
We Have Liftoff!
The MATIC price has been following an ascending support line for quite a long time — more specifically since Aug 8, 2019. The line holds considerable significance since it has consistently reacted to the price throughout. Even after the rapid increase and subsequent decrease of Nov 20 – Dec 10, the price returned and validated this support line once more. Its validity is further strengthened since it is supported by the 200-day moving average (MA). The main resistance area for the entirety of 2020 was found at 250 satoshis. The price finally broke out above this area on March 3 and has been increasing since. The closest resistance areas are found by using a Fibonacci retracement on the entire decrease, which appear at 310, 355, and 400 satoshis.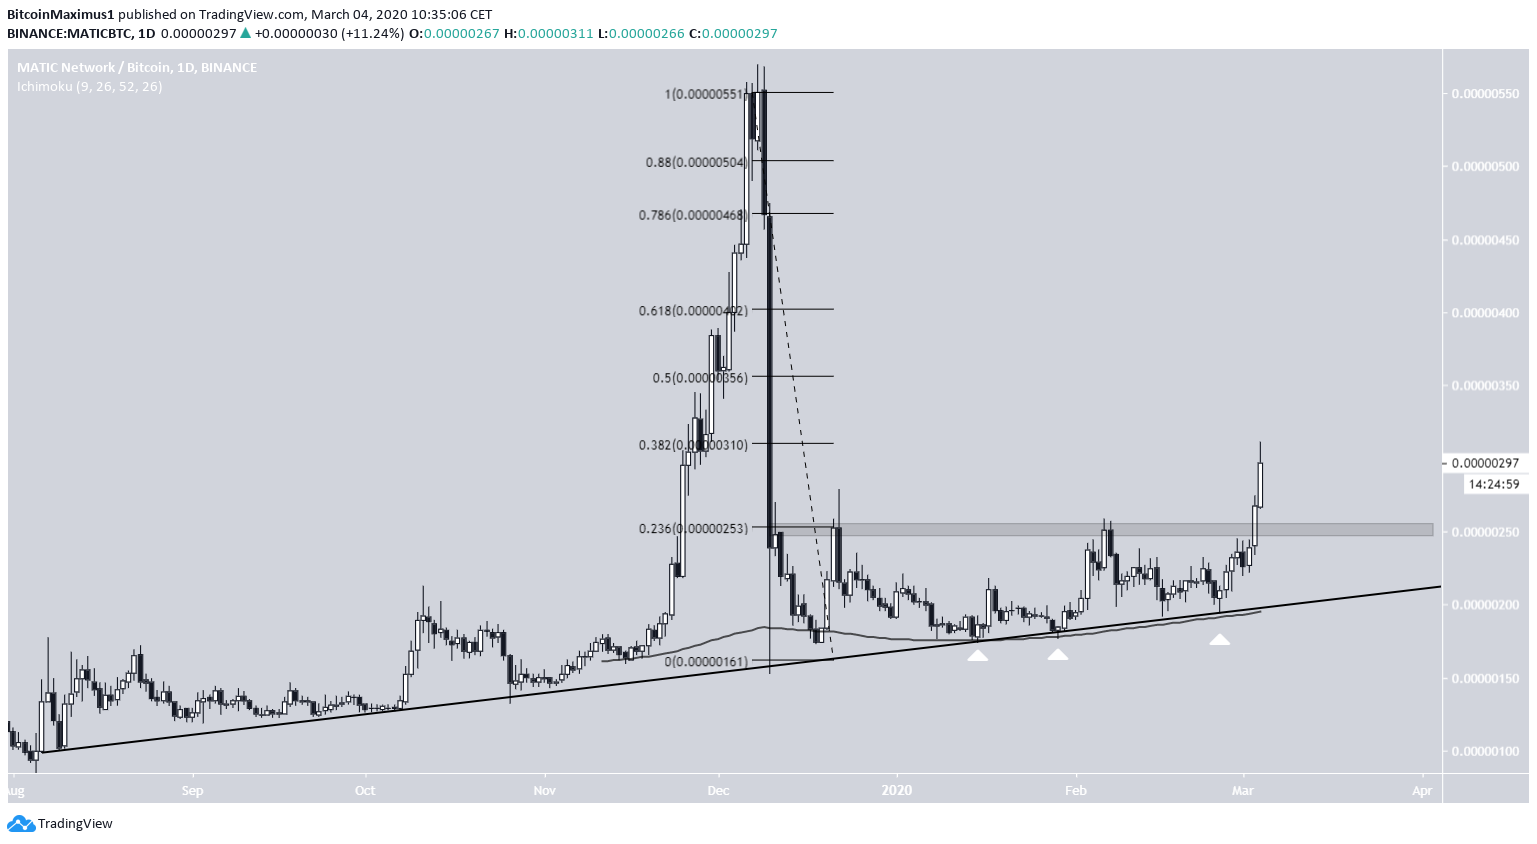
Future Movement
In the short-term, the price is following a steeper ascending support line. While it is customary that after a breakout the price returns to validate the breakout level, it has yet to do so. In addition, there is no bearish divergence to suggest that it will. Therefore, it is possible that the price will continue moving upwards without experiencing a retracement. Even if one occurs, the price would be expected to validate the breakout level and continue moving upwards afterward.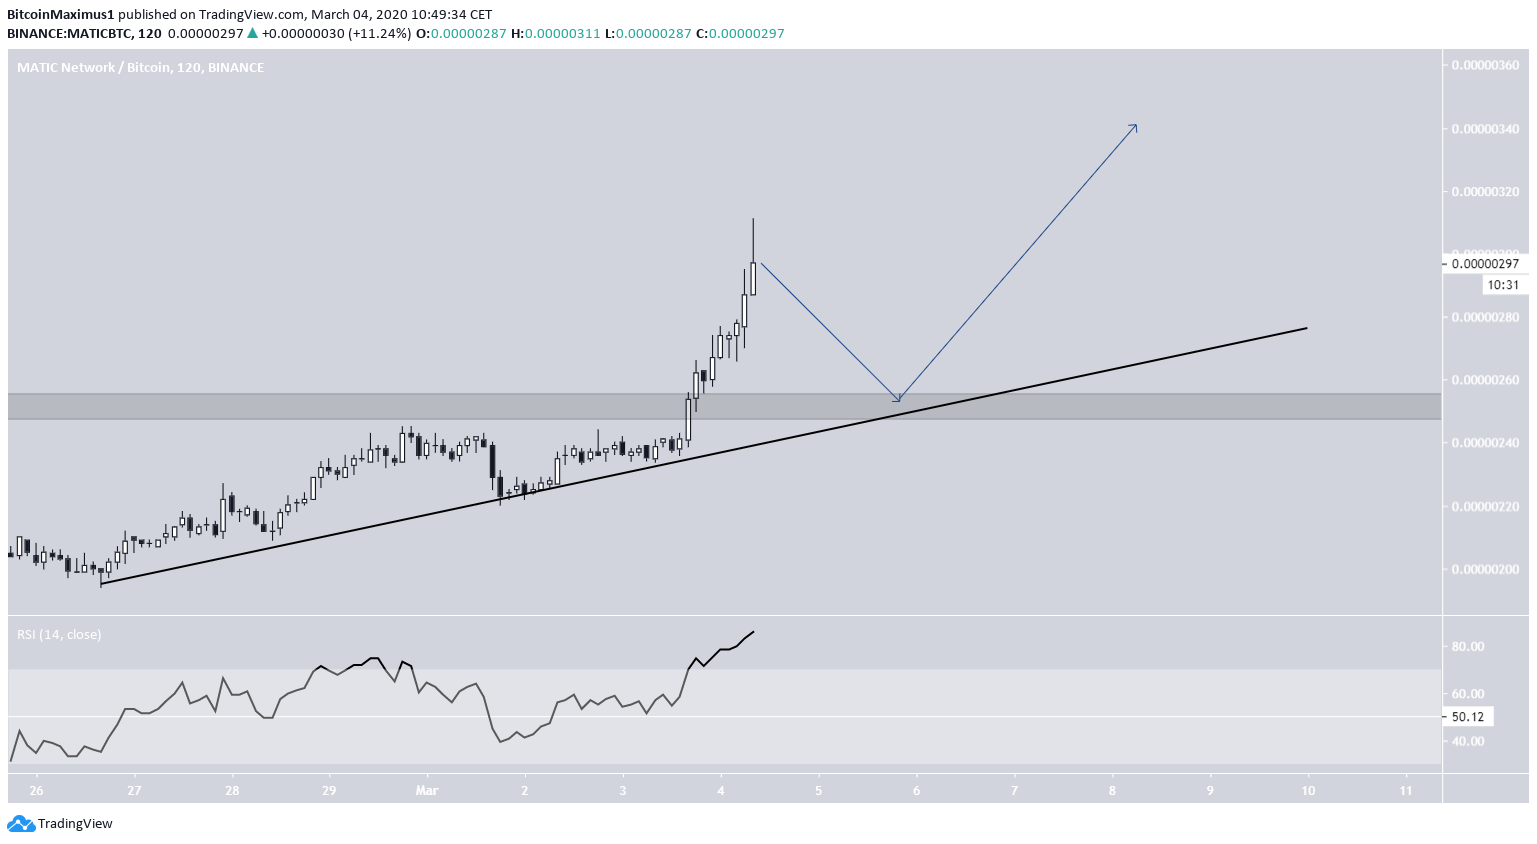 If the move continues without retracement, the target that is expected to be reached is 350 satoshis. There are three reasons for this area being picked as the expected resistance level:
- It is the entire height of the pattern projected to the breakout level.
- It is the 0.5 Fib level of the entire decrease.
- It coincides with the highs of August 2019.
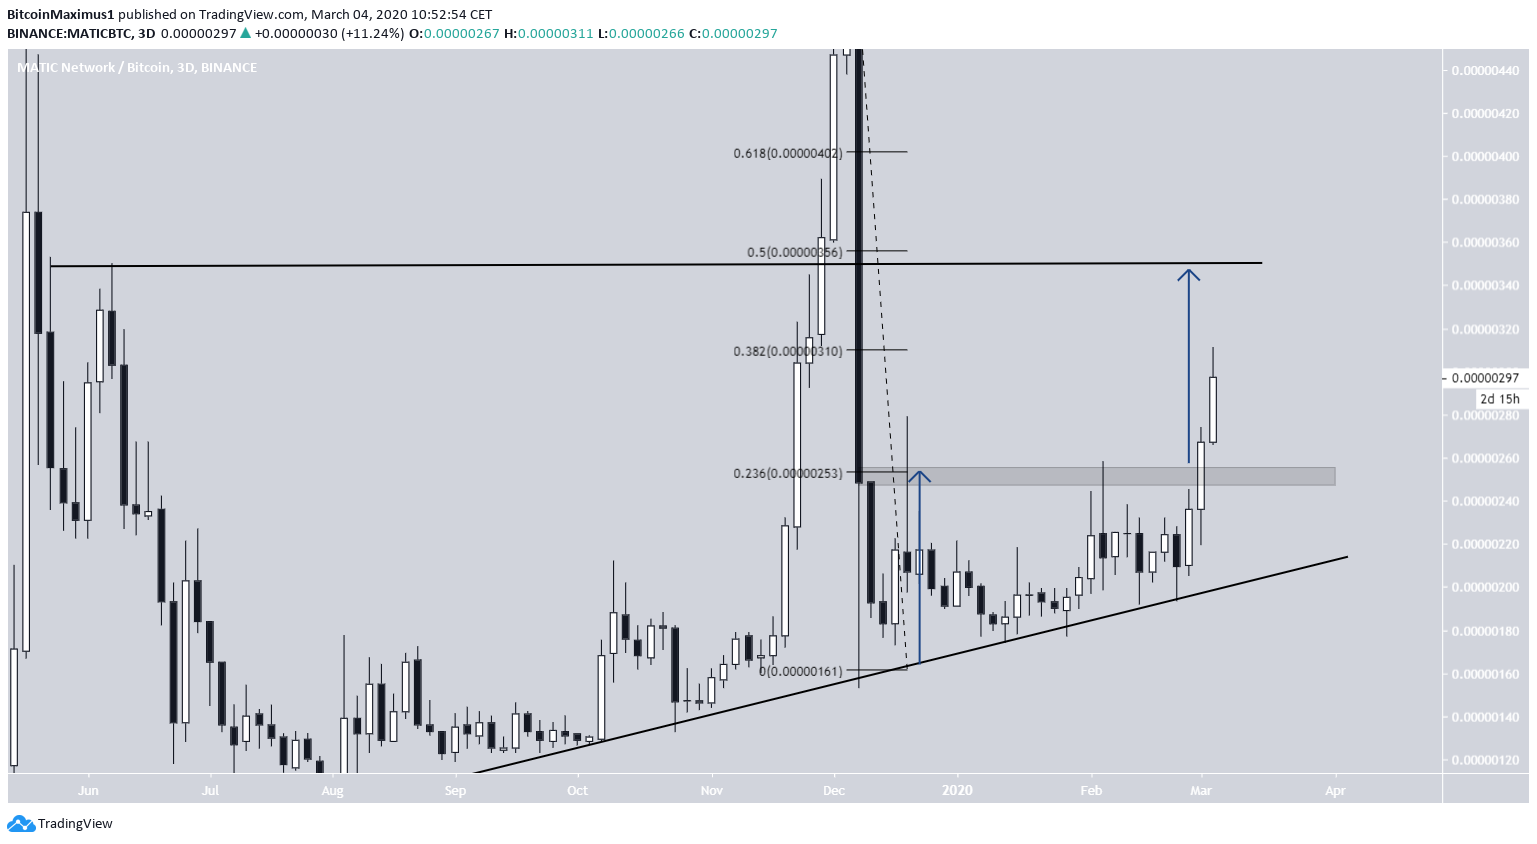 To conclude, the MATIC price has broken out above a significant resistance area. The rally may continue without halting until the price reaches 350 satoshis, after which a slight retracement is expected.
Disclaimer
In line with the Trust Project guidelines, this price analysis article is for informational purposes only and should not be considered financial or investment advice. BeInCrypto is committed to accurate, unbiased reporting, but market conditions are subject to change without notice. Always conduct your own research and consult with a professional before making any financial decisions. Please note that our Terms and Conditions, Privacy Policy, and Disclaimers have been updated.

Valdrin Tahiri
Valdrin discovered cryptocurrencies while he was getting his MSc in Financial Markets from the Barcelona School of Economics. Shortly after graduating, he began writing for several different cryptocurrency related websites as a freelancer before eventually taking on the role of BeInCrypto's Senior Analyst.
(I do not have a discord and will not contact you first there. Beware of scammers)
READ FULL BIO
Sponsored
Sponsored