


The Polygon (MATIC) price is at risk of breaking down from the $0.78 horizontal support area, which could lead to a downward movement toward $0.60.
Polygon is a layer-2 scaling solution for the Ethereum blockchain. It effectively transforms the Ethereum network into an internet of blockchains and improves its capabilities relating to smart contracts and decentralized applications.
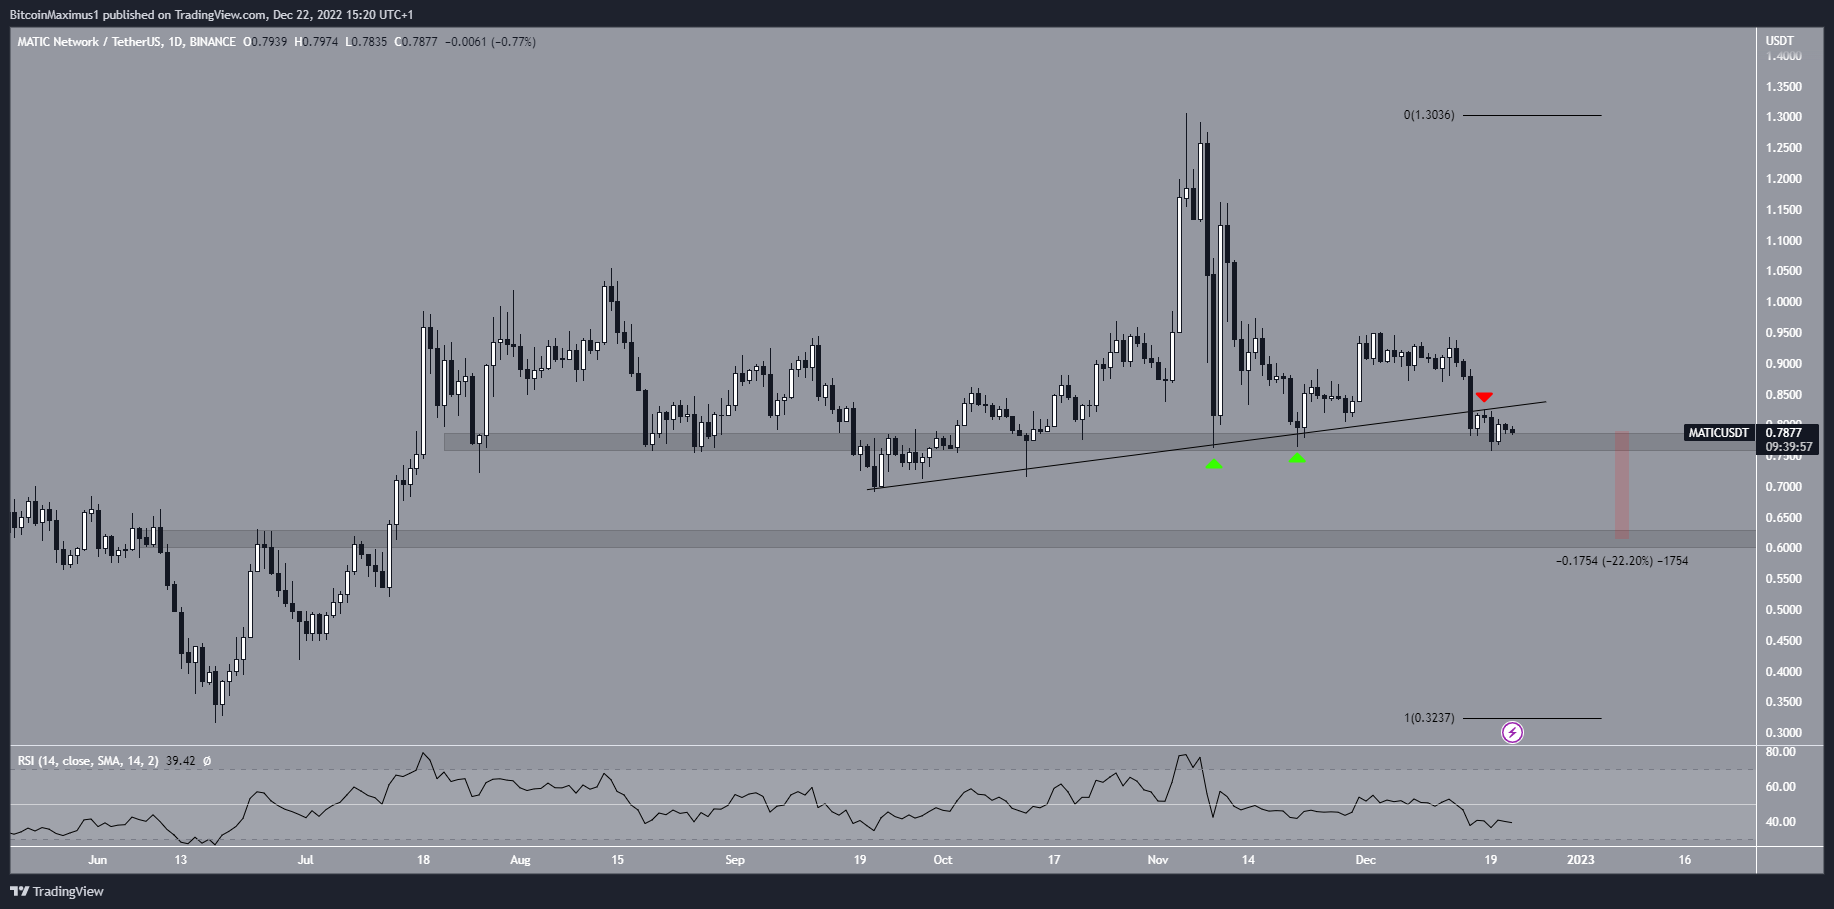
The MATIC price broke down from an ascending support line and now risks breaking down from a horizontal support area. If this occurs, it could catalyze a decrease of 22%.
MATIC Breaks Down From Key Support
The MATIC price has decreased since reaching a high of $1.30 on Nov. 5. Initially, the price bounced at an ascending support line (green icon), leading to a short-term rally. However, it broke down from the line on Dec. 16 and validated it as resistance the next day.
Currently, the Polygon price is trading just above the $0.78 horizontal support area. This is a crucial area since it has previously acted as support since the end of July. As a result, a potential breakdown below it could accelerate the rate of decrease.
The daily RSI is bearish, supporting the possibility of a breakdown. This is because it is decreasing and has moved below the 50 line. Therefore, the most likely MATIC token price move is a breakdown toward the $0.60 area. From the current price, this amounts to a 22% drop.
Conversely, reclaiming the ascending support line would indicate that the trend is bullish instead.
Short-Term Rally on the Horizon?
Despite the bearish readings from the daily time frame, the short-term six-hour chart indicates that an initial MATIC price rally is expected before the drop. The MATIC network price broke out from a descending resistance line after the RSI generated bullish divergence (green line). While it has not yet initiated a rally, it has validated the resistance line as support 24 hours after the breakout.
If the upward movement continues, there would likely be resistance at $0.82-$0.85, created by the 0.382-0.5 Fib retracement resistance area. This would also coincide with the long-term resistance from the daily time frame. Afterward, a drop would be expected. However, reclaiming the area could mean that the trend is bullish.
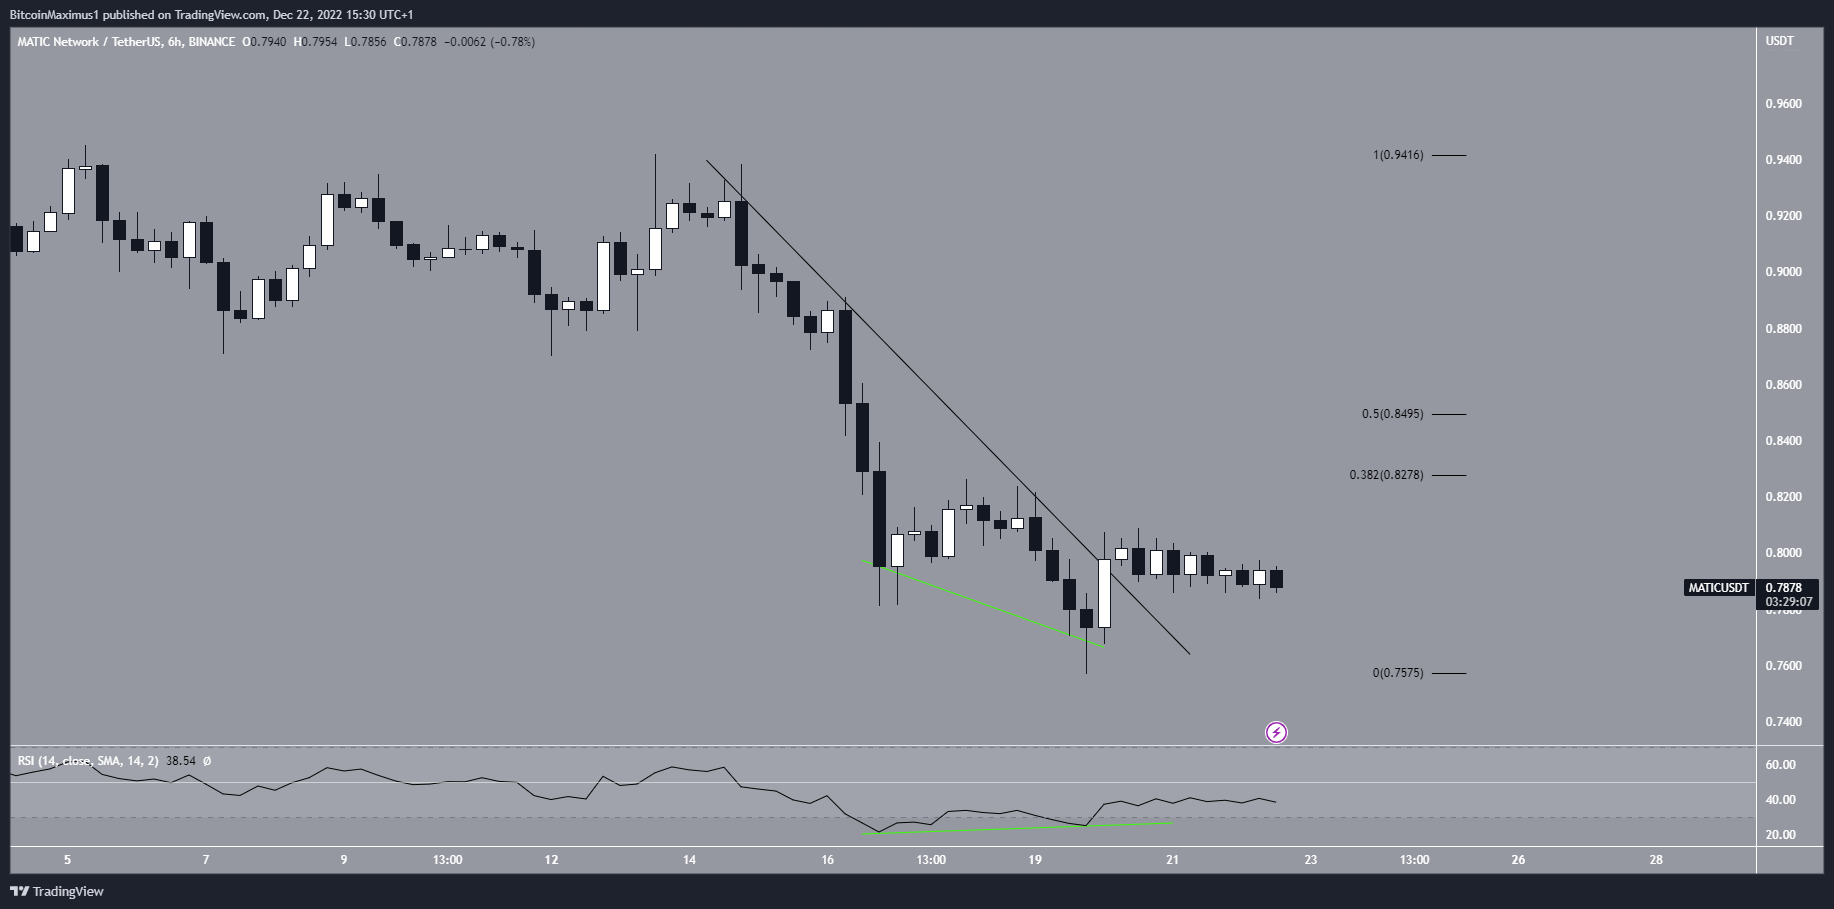
To conclude, the readings for MATIC in the daily time frame are bearish, supporting a drop toward $0.60. However, an initial short-term really toward $0.82-$0.85 is likely before the fall. Reclaiming this area would suggest that the trend is bullish instead.
For BeInCrypto’s latest crypto market analysis, click here.


