


Mask Network (MASK) price has been falling since Nov. 3. However, the ongoing bounce and short-term breakout bodes well for the continuation of the preceding increase.
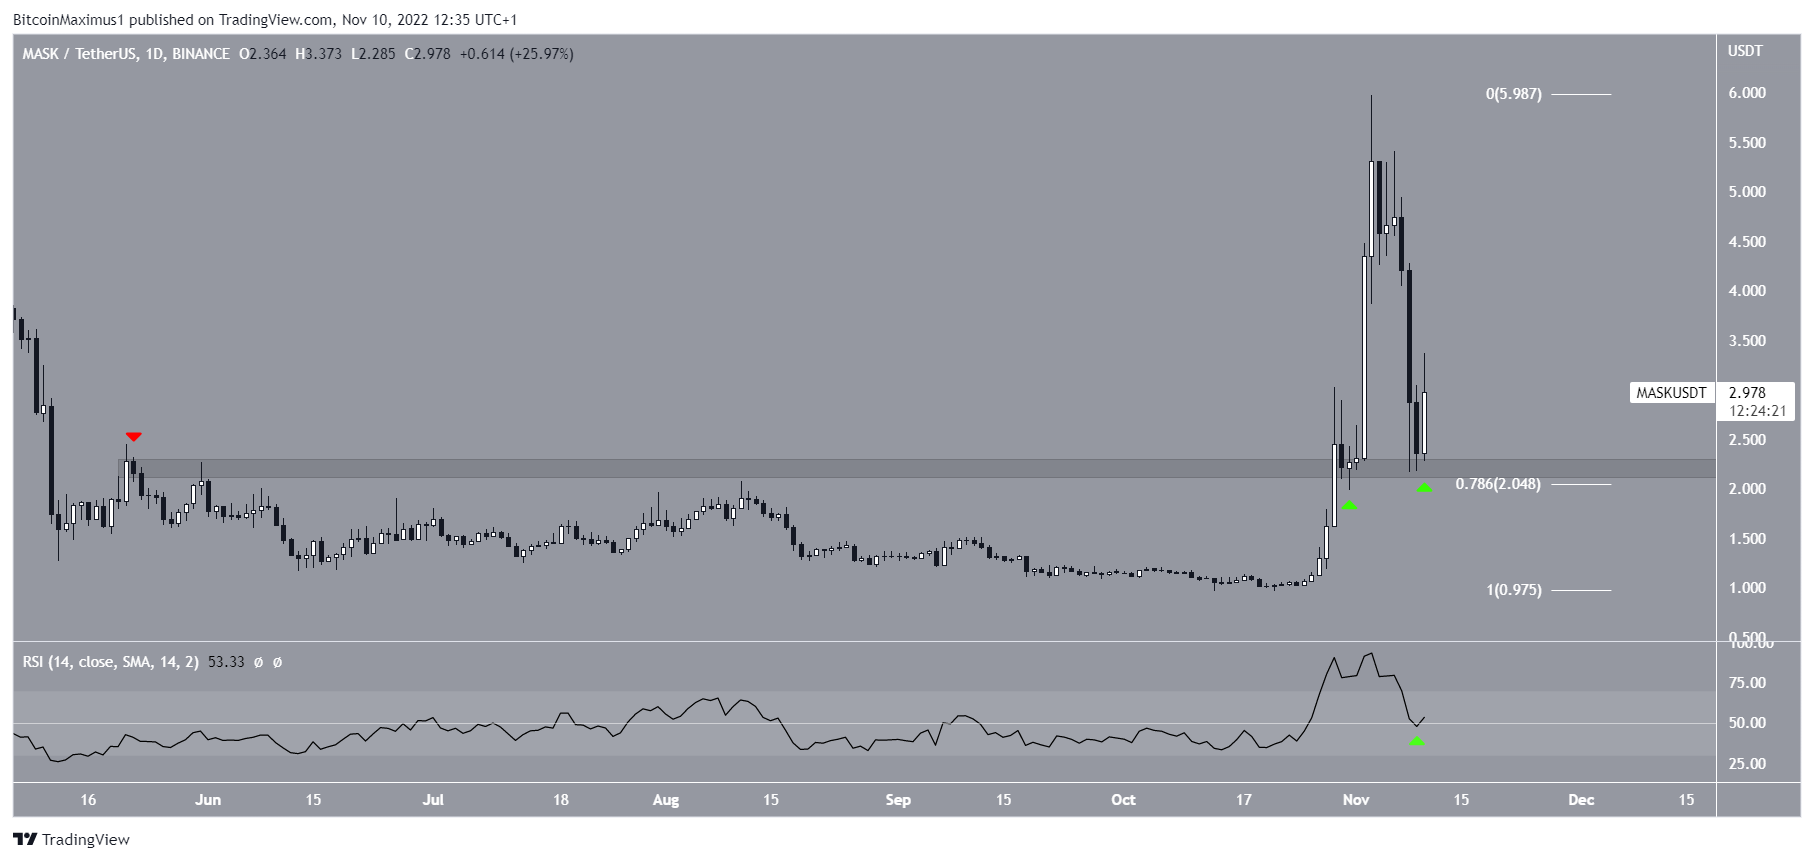
A technical analysis of the daily time frame shows that the Mask Network price has been decreasing since reaching a high of $5.98 on Nov. 3. The downward movement followed the rest of the crypto market and created of a long upper wick. So far, it has led to a low of $2.16.
However, the MASK price bounced afterward (green icon), validating the $2.25 area as support. The area also coincides with the 0.786 Fib retracement support level.
Furthermore, the daily RSI could be in the process of bouncing above 50. If this occurs alongside a bounce from the price action, it would be expected to initiate a relief rally.
Conversely, a daily close below the $2.25 area would give a bearish Mask Network price prediction.
MASK Network Price Prediction: Wave Count Supports Increase
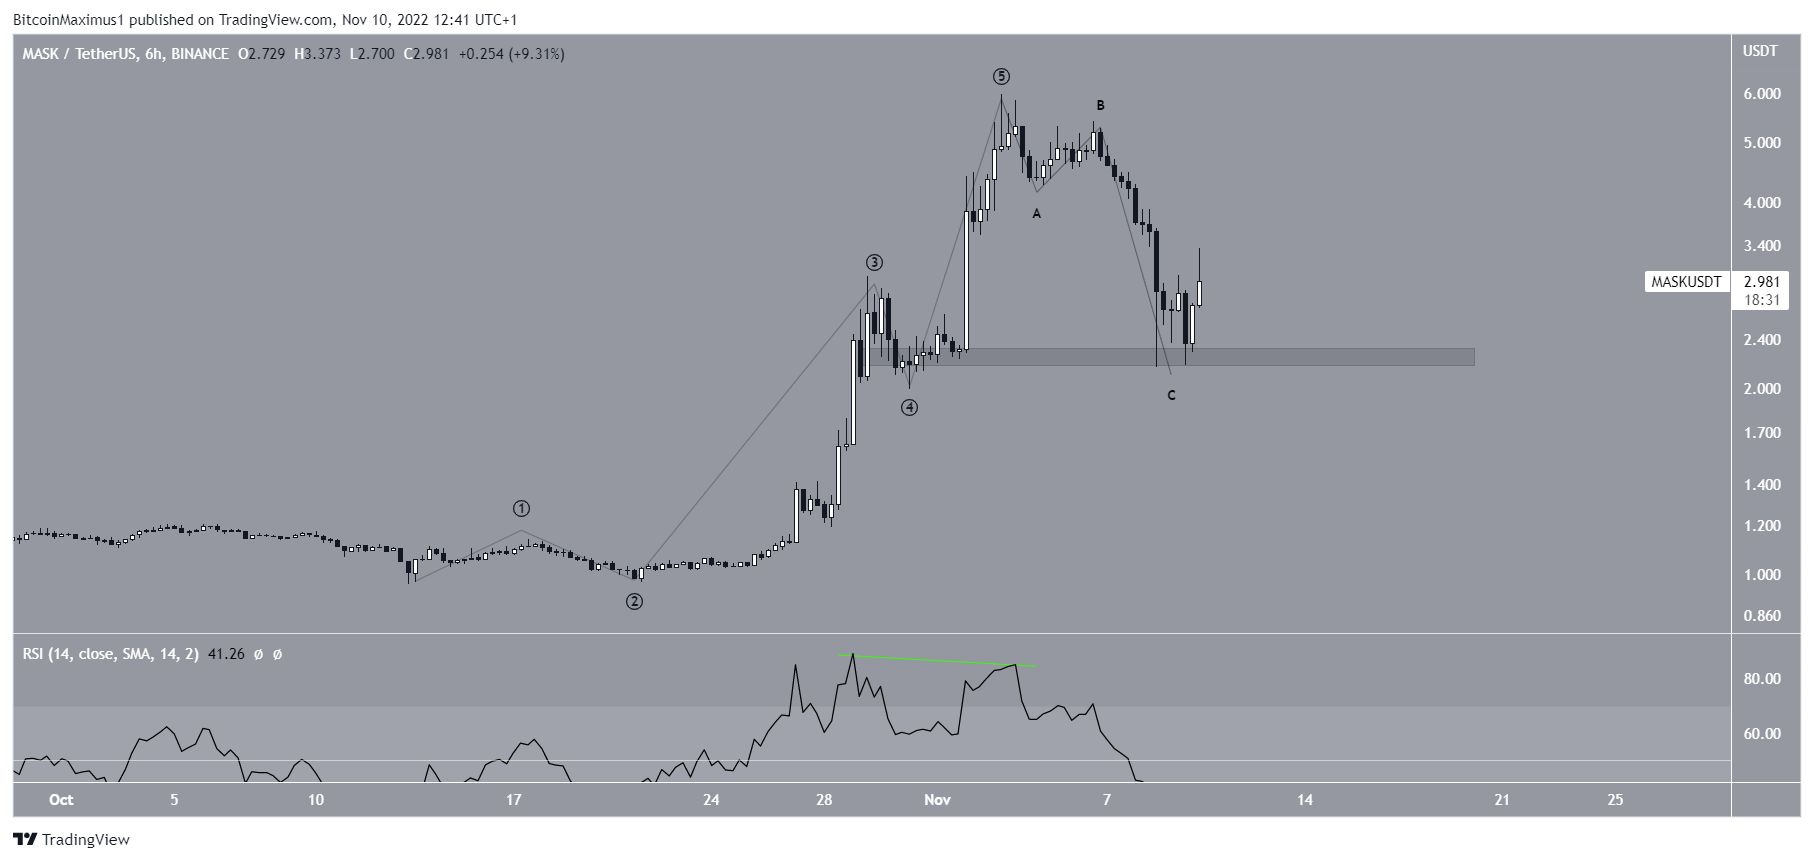
The price history shows that the MASK price completed a long-term five-wave upward movement starting on Oct. 14. This means that the price began a new upward movement.
If so, the price completed an A-B-C corrective structure afterward. The correction was preceded by bearish divergence in the RSI (green line), increasing its legitimacy.
The bounce mentioned above occurred at the wave four level, a common level where correction come to an end. So, it increases the chance that this is the correct count.
Short-Term Invalidation levels
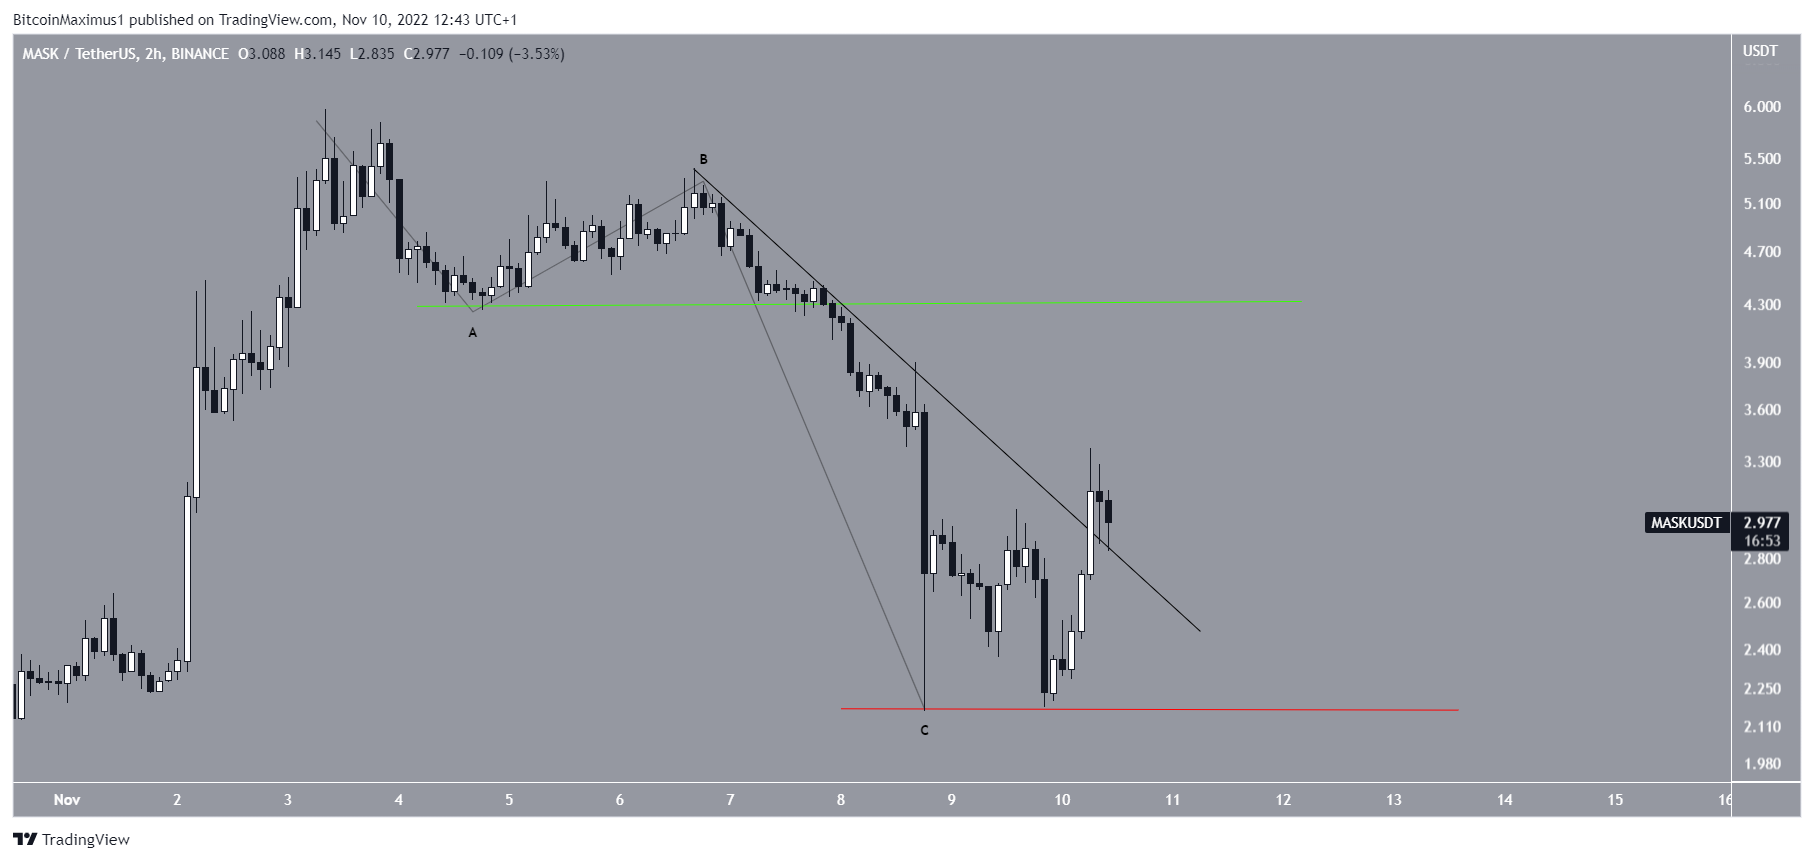
The confirmation of the bullish count would be reached with an increase above the wave A low (green line) at $4.26. The short-term descending resistance line breakout also supports this possibility.
If the bullish scenario is confirmed, it will lead to a bullish Nov. 2022.
Conversely, a decrease below the wave C low at $2.16 (red line) would be bearish. It would also mean that the MASK price broke down from the $2.25 horizontal support area. As a result, it would most likely lead to lower prices.
For BeInCrypto’s latest Bitcoin (BTC) analysis, click here.
Disclaimer: BeInCrypto strives to provide accurate and up-to-date information, but it will not be responsible for any missing facts or inaccurate information. You comply and understand that you should use any of this information at your own risk. Cryptocurrencies are highly volatile financial assets, so research and make your own financial decisions.
