
Mantra (OM) Price has surged an impressive 46% in the past 30 days, reaching a new all-time high on October 7. This sharp rally has put OM in the spotlight, but with its momentum showing signs of weakening, traders are left questioning whether a correction is imminent.
The Average Directional Index (ADX) has dropped from 30 to 21.96, signaling a notable decline in trend strength. Moreover, Ichimoku Cloud indicators and short-term moving averages suggest that the bullish momentum might be losing steam. Will OM pull back before attempting another run at new highs, or can it sustain its upward trajectory?
OM’s Strong Uptrend Is Fading Away
OM’s ADX is currently at 21.96, down from 30 just two days ago. The ADX (Average Directional Index) is a technical indicator that helps to measure the strength of a market trend, regardless of its direction.
It operates on a scale from 0 to 100, with key thresholds that help interpret the trend. An ADX below 25 generally suggests a weak or directionless trend, while values between 25 and 50 indicate a strong trend. Anything above 50 reflects an extremely strong trend.
Read more: What Are Tokenized Real-World Assets (RWA)?
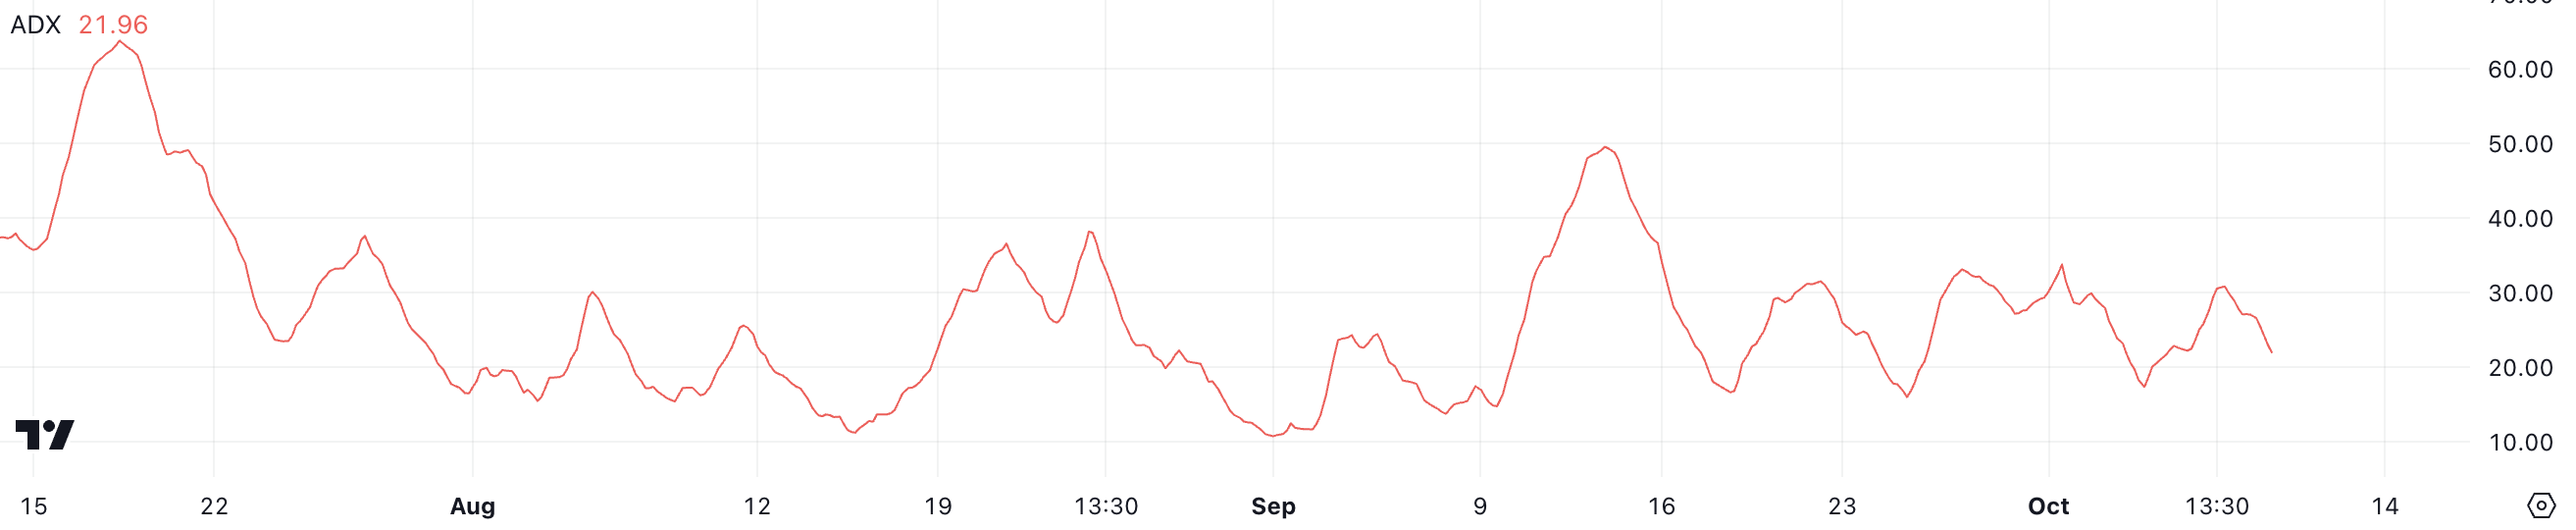
Although OM is still in an uptrend, its ADX at 21.96 suggests that the trend is not as strong as it was a few days ago, when its price reached a new all-time high of $1.47. This weakening of the trend suggests that the bullish momentum may be losing steam, making the uptrend less convincing and more susceptible to potential slowdowns or sideways movement.
Traders should watch this closely, as the reduced ADX indicates that the uptrend is not as powerful as it was just a few days ago, increasing the risk of a reversal or a stall in price growth.
Ichimoku Cloud Shows Mantra Could Be Losing Momentum
The Ichimoku Cloud chart for OM reveals a price currently situated above the cloud, which indicates it is in a bullish phase. However, recent price action suggests a loss of momentum, as OM has pulled back from its recent high, near $1.45, to the current level of around $1.34.
Despite this pullback, the cloud (Kumo) below acts as a critical support zone, and its thickness implies that this support is relatively strong. The future cloud appears green and thick, reinforcing the idea that bullish momentum could persist in the longer term, but this depends on whether the price maintains itself above key levels.
The Tenkan-sen (blue line) and Kijun-sen (red line) are showing some interaction here. The Tenkan-sen has crossed below the Kijun-sen, which often signals a short-term bearish or corrective move. However, the fact that the price remains above the cloud suggests that this might just be a temporary correction rather than a trend reversal.
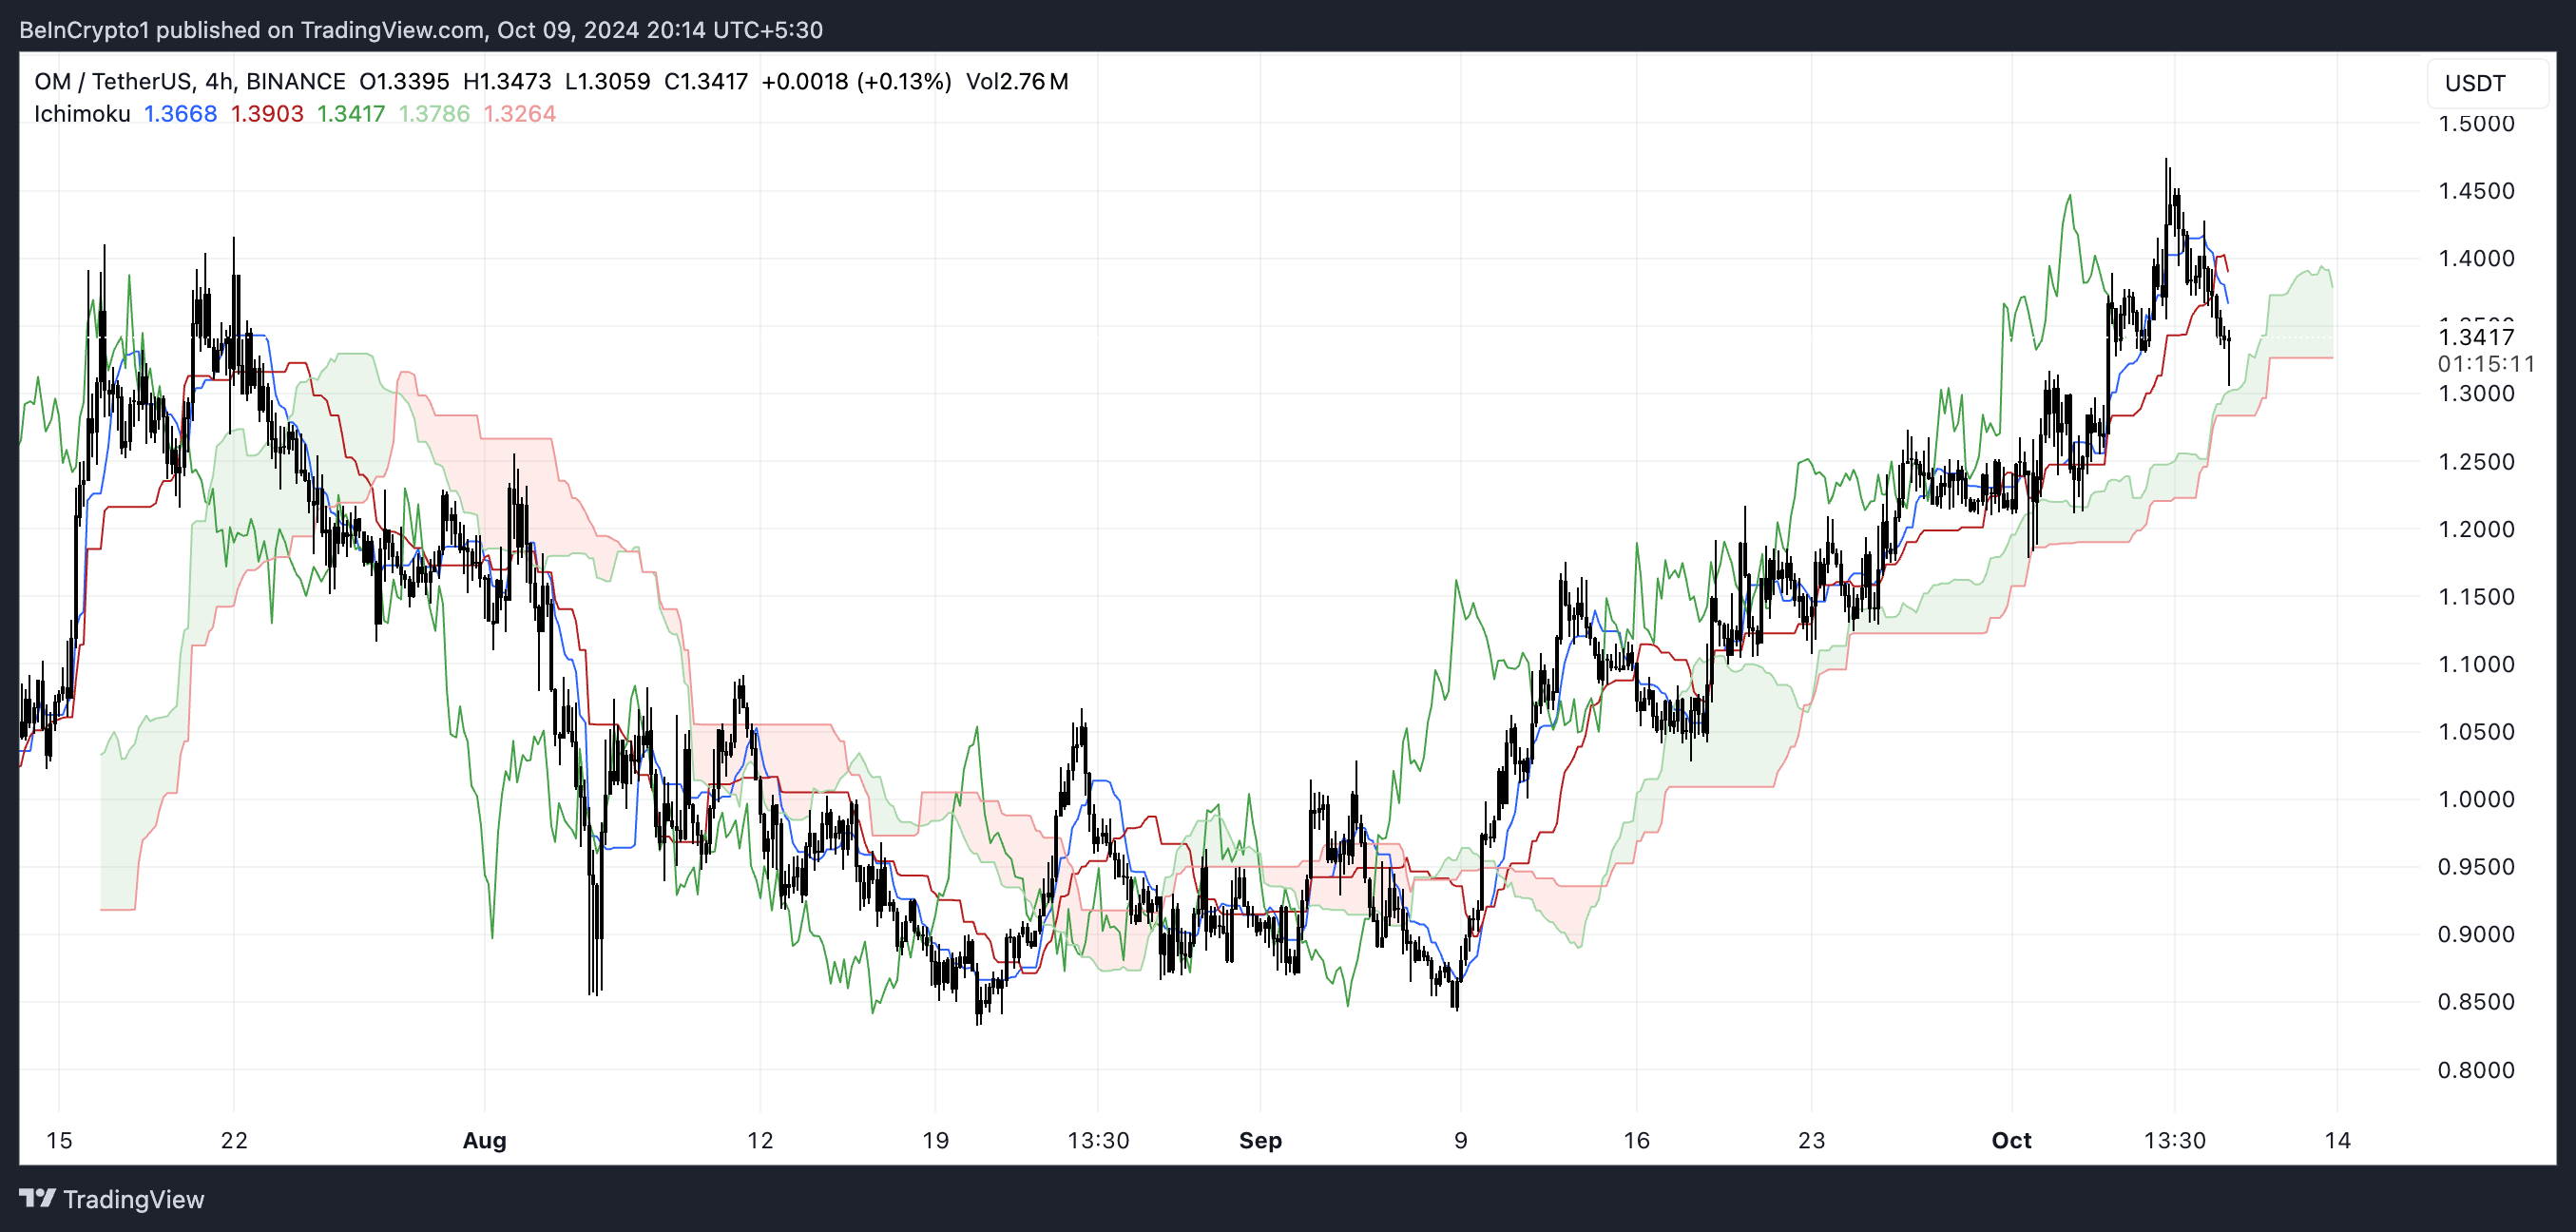
Additionally, the Chikou Span (green lagging line) is well above the price level, reinforcing that the overall sentiment remains bullish. However, the distance between the Chikou Span and the price is narrowing. This could be an early signal that bullish momentum is fading.
While OM remains in a bullish trend as indicated by the price being above the Ichimoku Cloud, the recent short-term signals suggest that the uptrend is weakening. The thick cloud below offers strong support, and as long as the price stays above this level, the broader bullish sentiment is likely to persist.
OM Price Prediction: A Correction Before A New All-Time High?
OM’s EMA lines are currently showing a bullish structure, with the short-term EMAs positioned above the long-term ones, a typical sign of upward momentum. However, the short-term EMAs are starting to point downward, indicating that the strength behind the uptrend is fading.
If these short-term EMAs continue their downward movement and cross below the long-term EMAs, a “death cross” would occur. That would signal the start of a potential downtrend. This is a critical bearish indicator that could shift market sentiment.
EMA (Exponential Moving Average) lines are popular technical tools used to smooth out price action and give more weight to recent data, making them highly responsive to market changes. They help traders identify trends and potential reversals more effectively than simple moving averages.
Read more: How To Invest in Real-World Crypto Assets (RWA)?
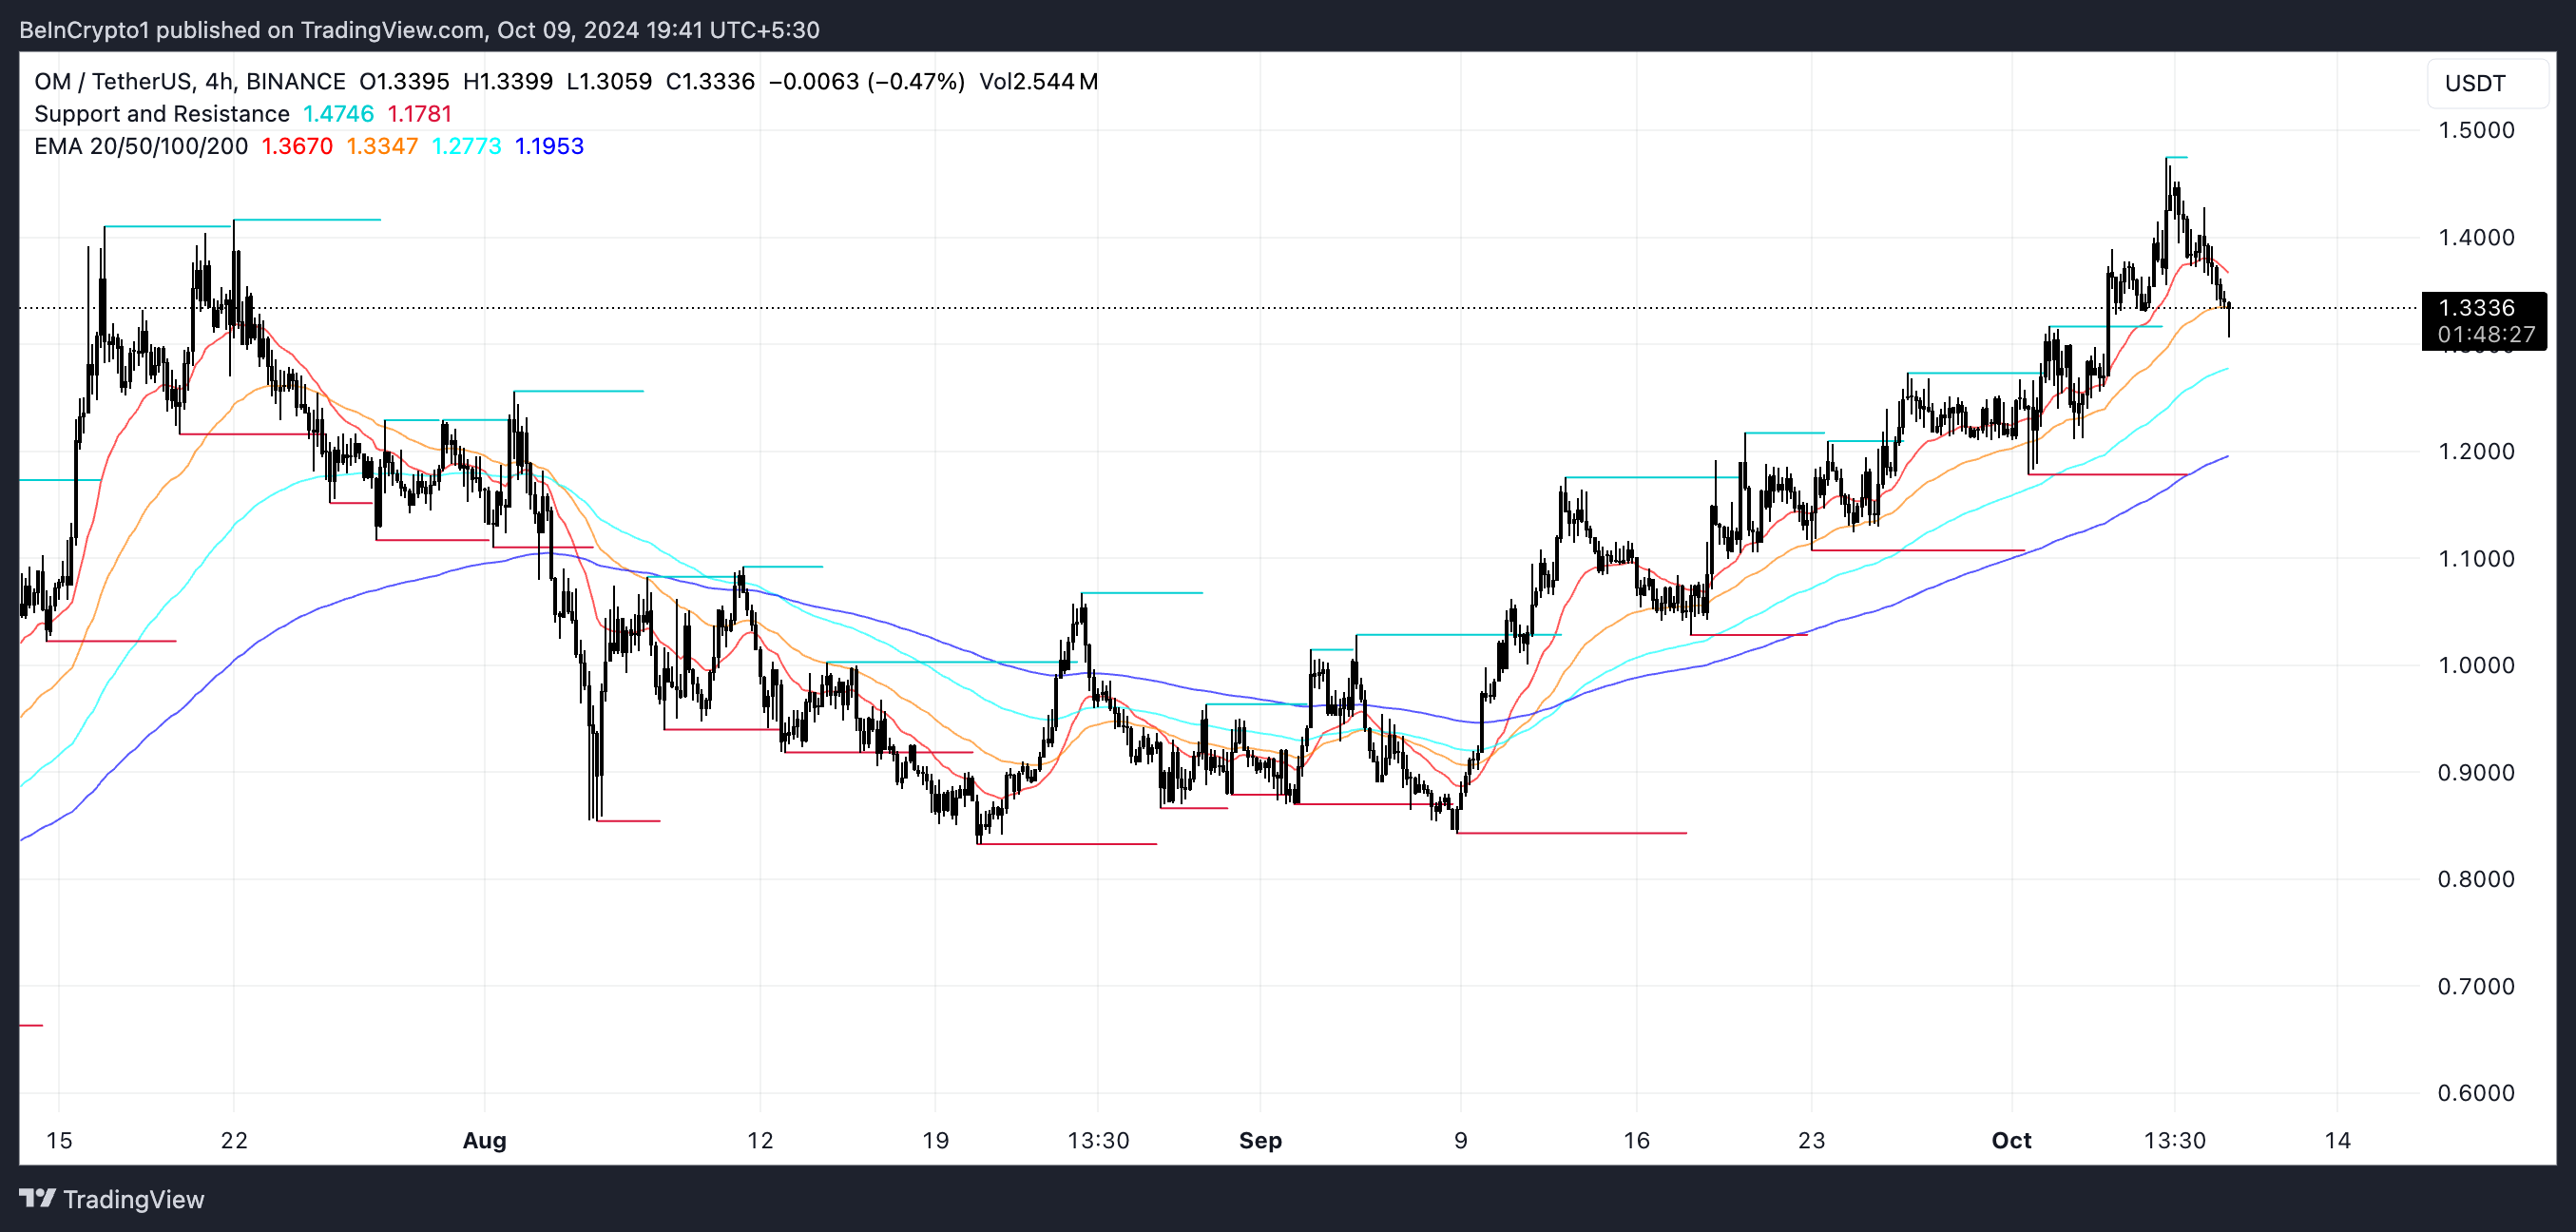
In the event of a downtrend, OM has strong support levels around $1.18 and $1.10. If bearish momentum increases in the coming days, these zones could be tested. A correction in the OM price could happen before the price tries to reach a new all-time high after it surged 46% in one month.
On the flip side, if the market sentiment improves and the uptrend strengthens again, OM could gather enough momentum to retest its all-time high of $1.47. A break above this level would likely push the price into new highs, potentially sparking further bullish activity.
