The Bitcoin dominance rate (BTCD) is currently trading inside a crucial resistance area, a rejection from which could trigger an accelerated move down.
Similarly, Ethereum has created a bearish pattern inside a strong resistance area, forewarning of a similar decrease.
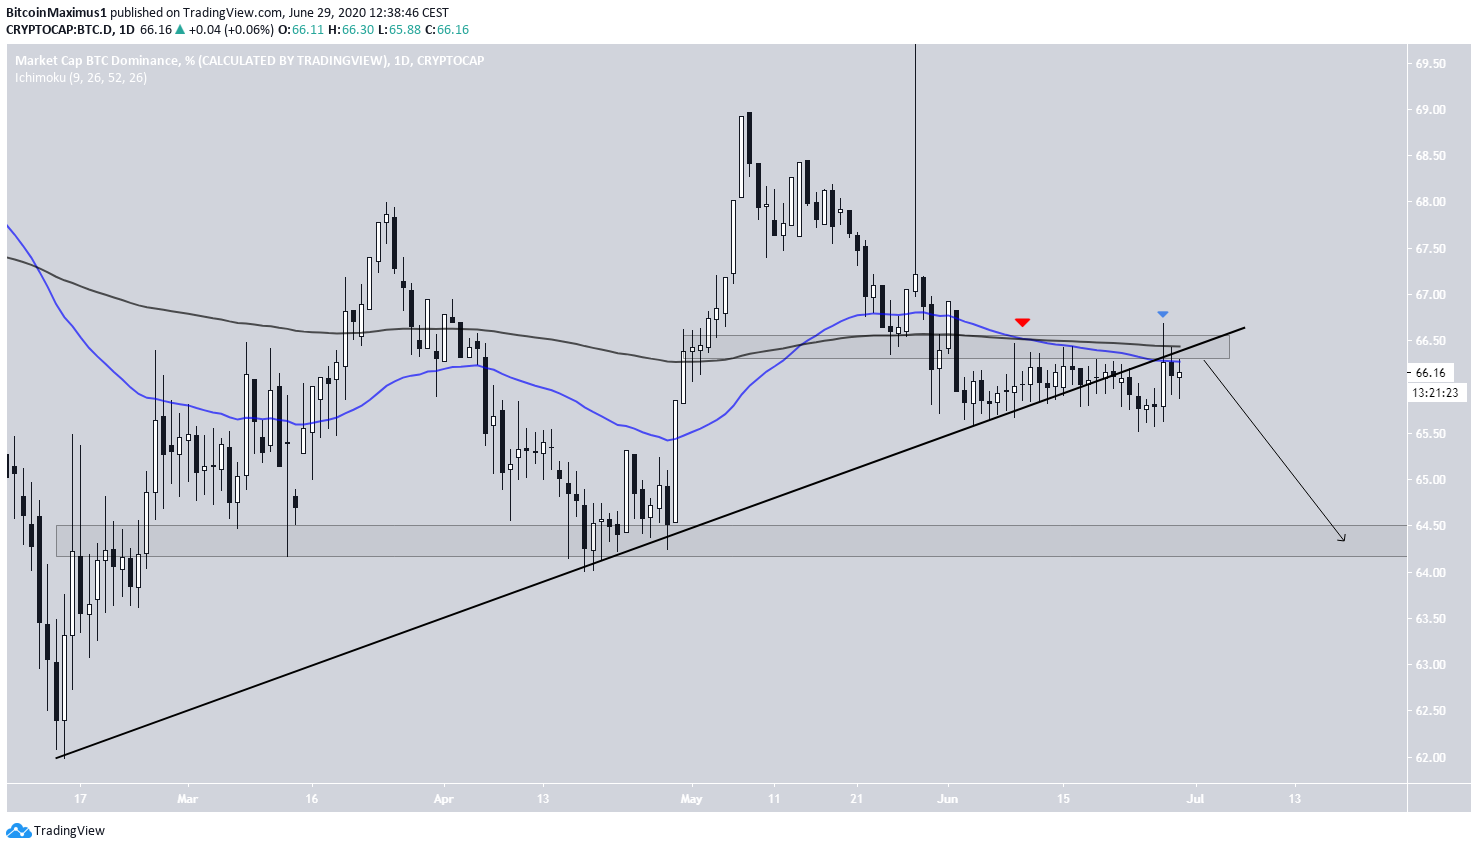
Bitcoin Dominance Rate
The daily chart provides a bearish picture for the BTCD. It broke down from a long-term ascending support line on June 18 and the subsequent increase on June 27 resembles a re-test of that support line.
Furthermore, the 66.5% area previously acted as support before turning to resistance on June 3. Until BTCD reclaims this level and confirms it as support, the current trend cannot be considered bullish.
Finally, the 50 and 200-day moving averages (MA) have already made a bearish cross and both are providing close resistance to the current rate. If it begins to fall, the nearest support area is found at 64.5%.
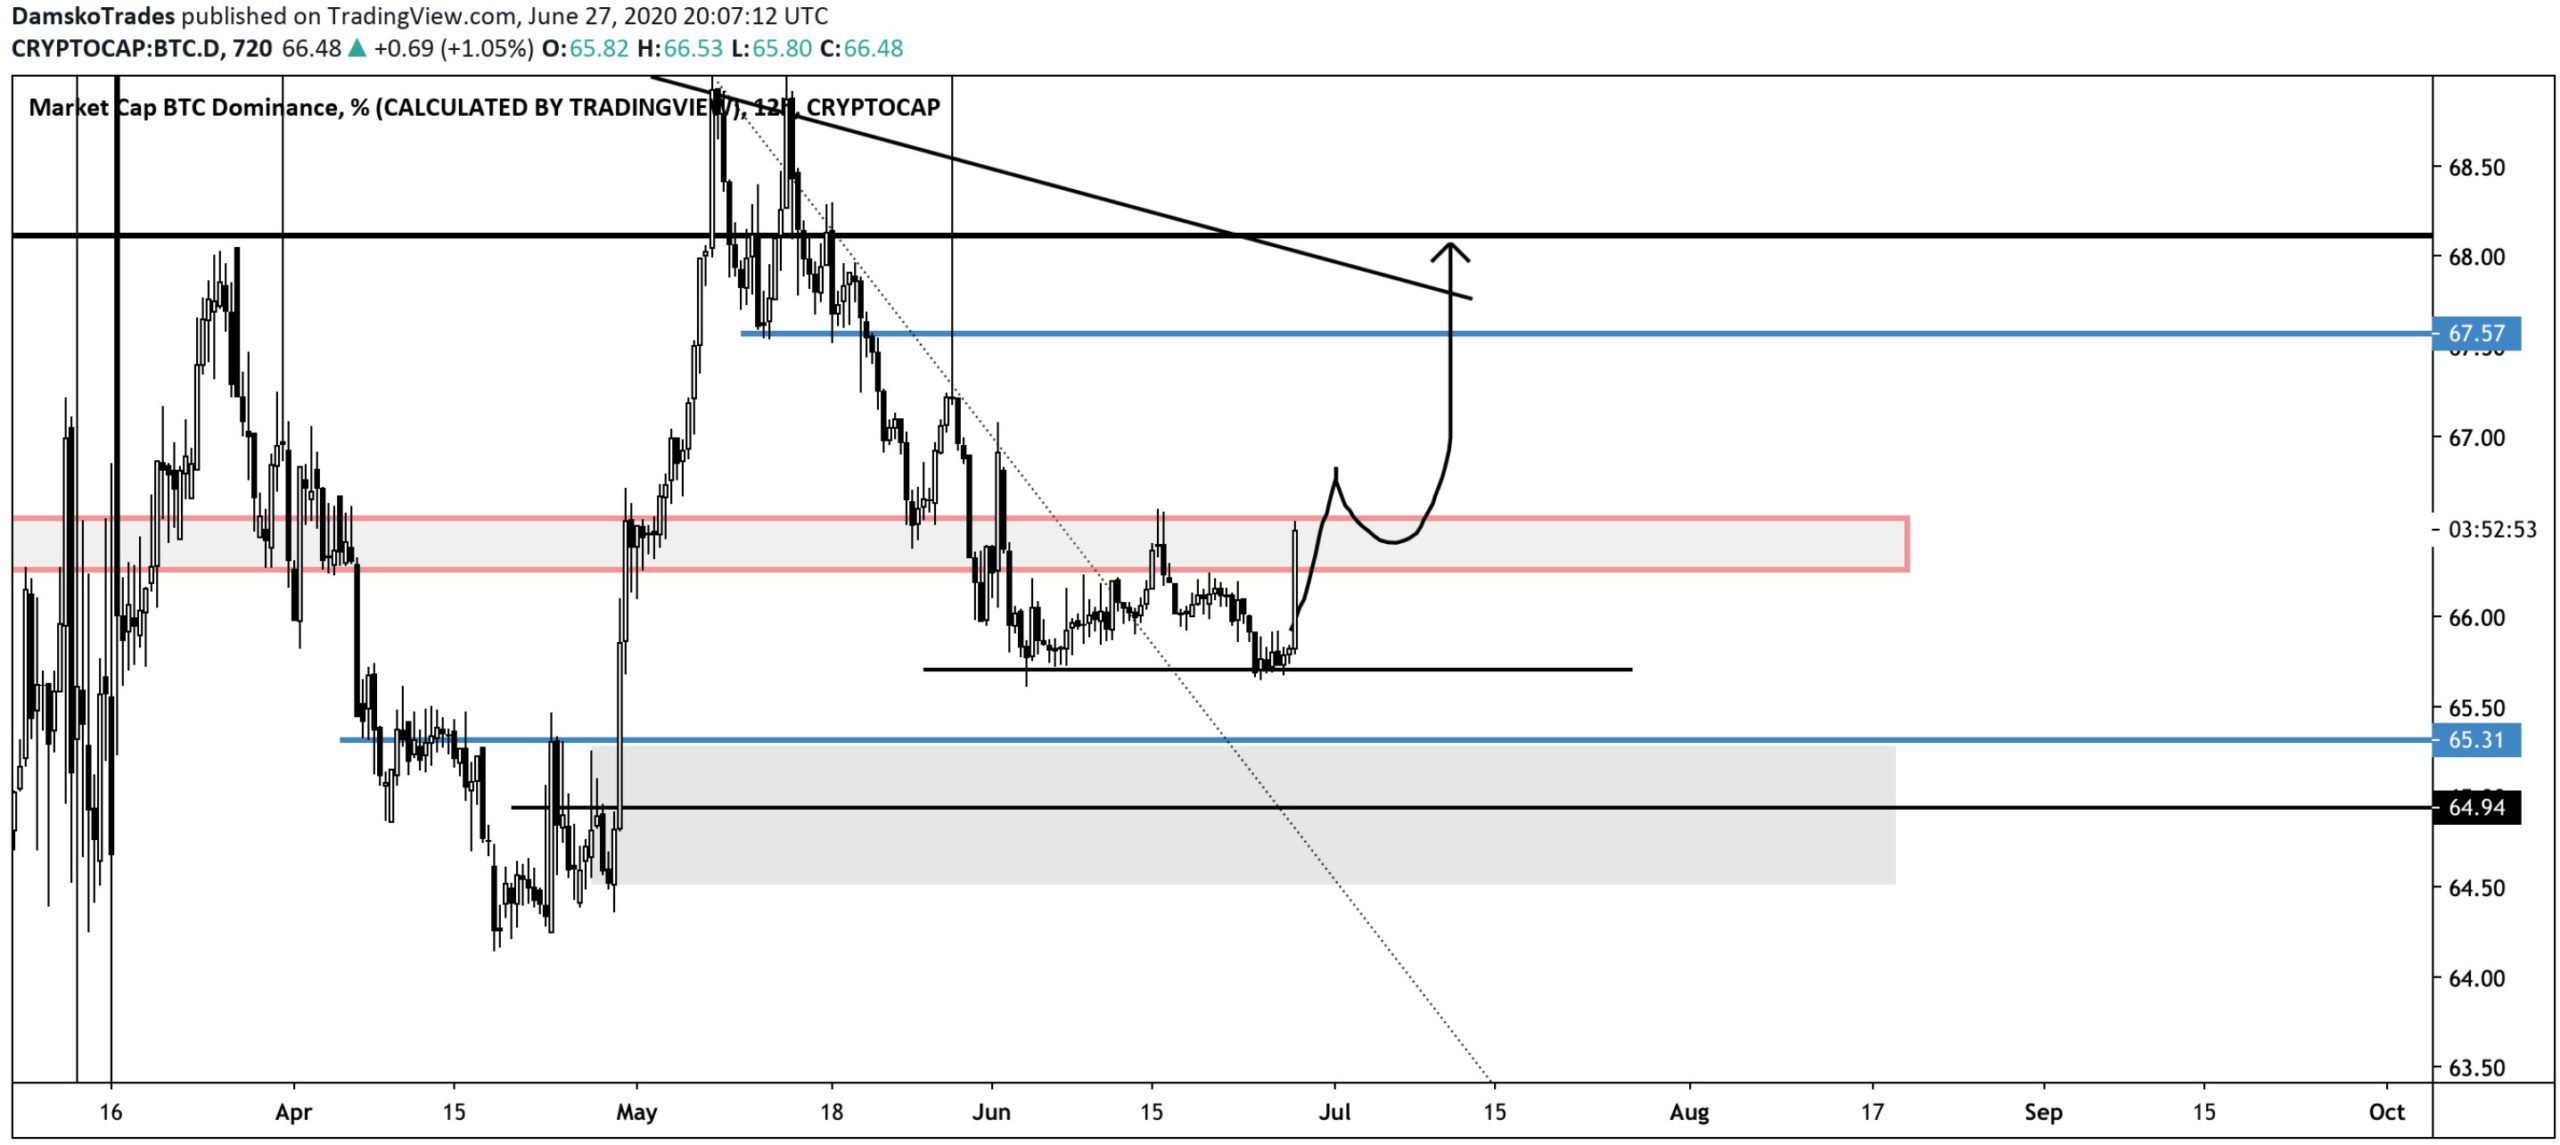
However, there are differing opinions regarding BTCD. Cryptocurrency trader @Damskotrades outlined a ‘doomsday’ scenario for altcoins, in which:
1 – Bitcoin drops.. hard / Started to break down
2 – ETH breaks down / Started to break down
3 – Dominance bounces in the grey and reclaims the broken level / Started to bounce towards the resistance
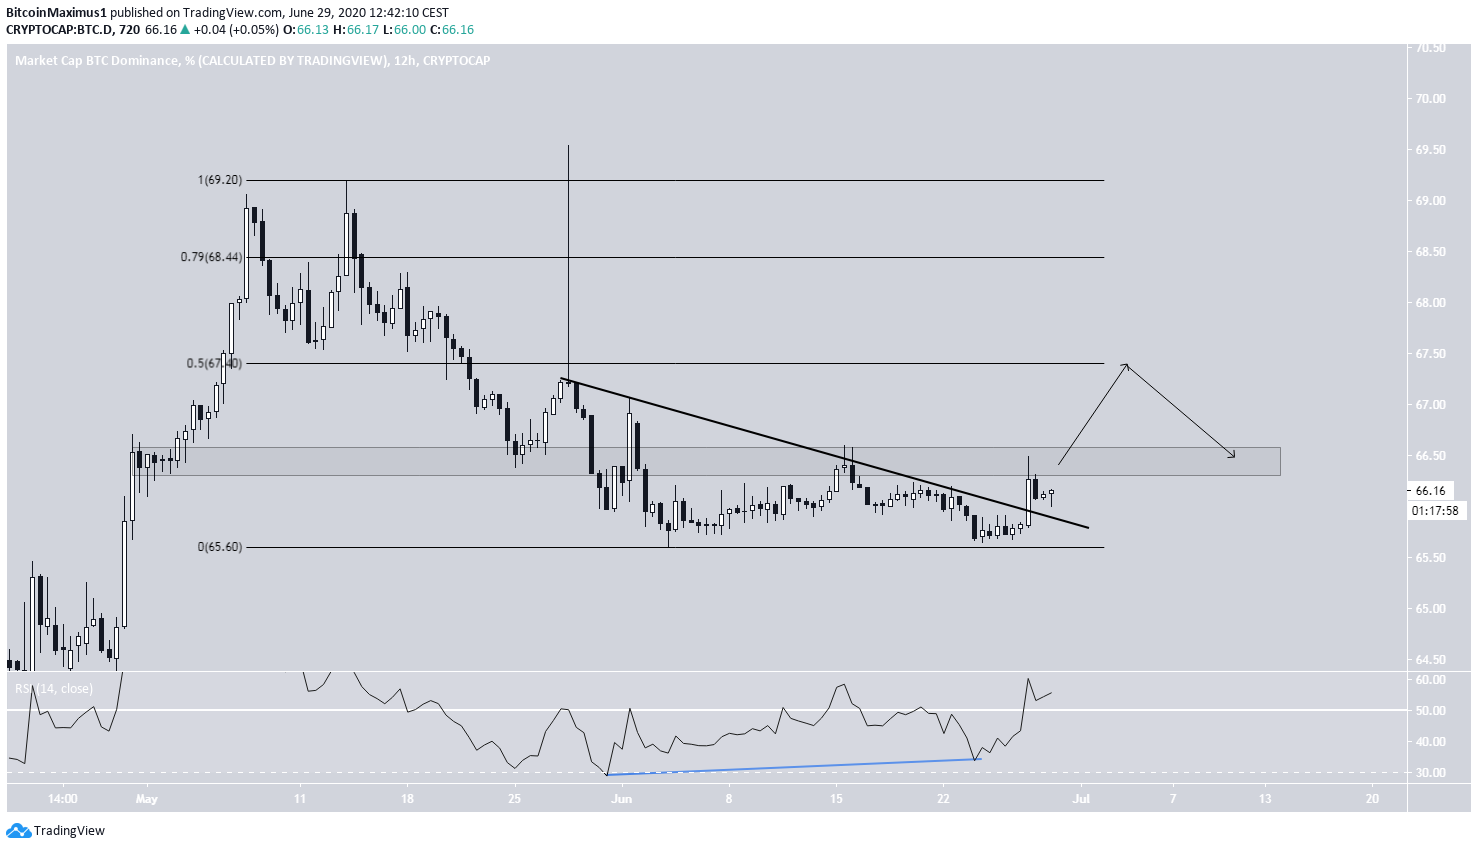
Indeed, the shorter-term chart provides some semblance of bullishness, even if it is not sufficient to negate the bearishness from the daily chart.
The rate has created a double-bottom pattern, which has been combined with a bullish divergence in the RSI. Afterward, it broke out from a shorter-term descending resistance line in place since the beginning of June.
However, as stated previously, BTCD has to flip the 66.5% area as support in order to be considered bullish. If so, the closest resistance level to the upside would be found at 67.5%, the 0.5 Fib level of the entire downward move.
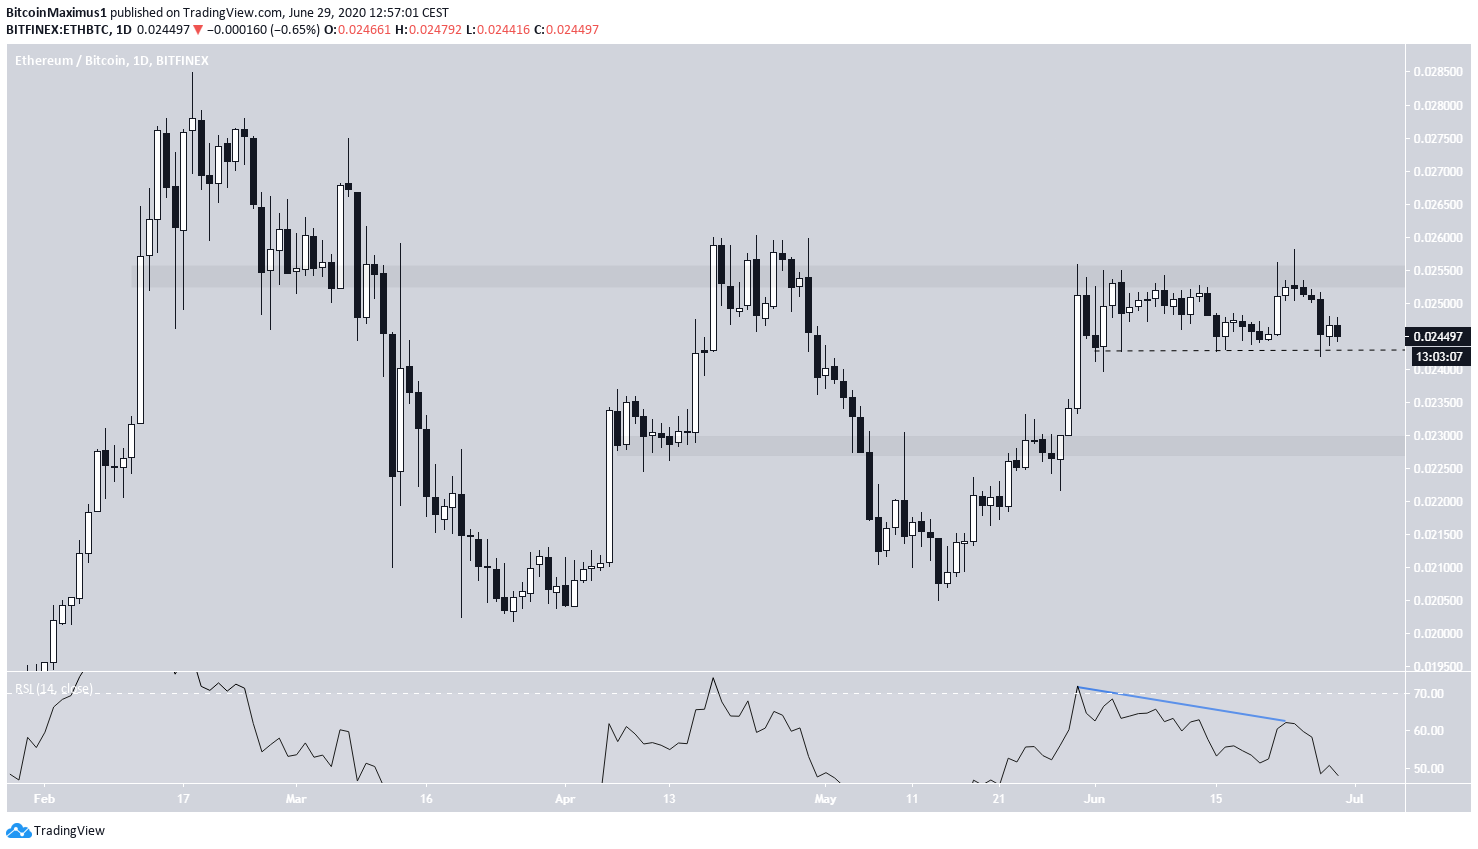
Ethereum
The Ethereum price movement looks bearish. Beginning on June 1, the price has created a double-top inside the ₿0.0255 resistance area. Furthermore, the second top was combined with a gravestone Doji, a bearish reversal sign, and bearish divergence in the RSI.
If the price loses the current ₿0.024 support, it could initiate a rapid downward move towards ₿0.023.
However, even though ETH is the biggest altcoin by market cap, its decrease will not necessarily cause the BTCD rate to go upwards since this could be nullified by other altcoins increasing.