


The Altcoin Market Cap (TOTAL2) trades at a confluence of resistance levels, a breakout above which could lead to a sharp increase.
The weekly time frame for TOTAL2 shows that the price trades at a confluence of important resistance levels at $610 billion. The resistance is created by a long-term descending resistance line and the $610 billion resistance area. The line has existed since the all-time high, measuring 518 days.
Therefore, if TOTALCAP2 successfully breaks out, it could increase to the next resistance at 922 billion. This would likely pave the way for a new altcoin season (alt season). This resistance is created by the 0.382 Fib retracement resistance level and a horizontal resistance area.
The weekly RSI movement supports the validity of the breakout. After generating a bullish divergence, the indicator finally moved above 50, indicating a bullish trend.
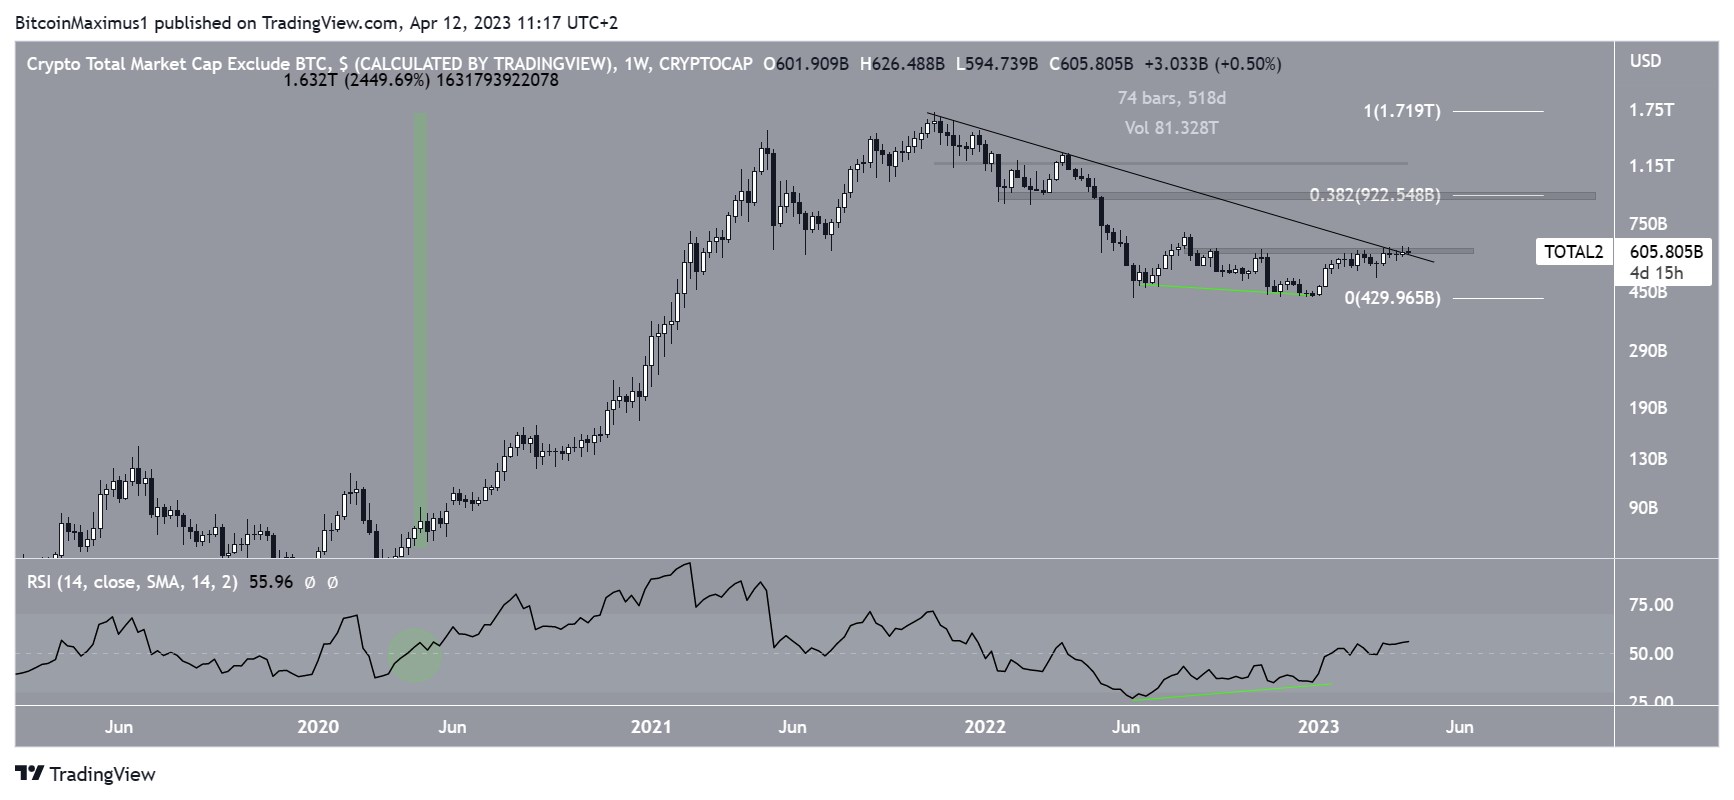
The previous time the indicator moved above 50 was in May 2020, preceding a 2550% increase that led to the all-time high.
On the other hand, if TOTAL2 fails to break out, a decrease toward the 450 billion support area could ensue.
Does The Bitcoin Dominance Rate (BTCD) Signal an Altseason?
Despite the aforementioned Altcoin Market Cap increase, the Bitcoin (BTC) price has increased at a faster rate, noticeable by the sharp uptick in Bitcoin Dominance (BTCD).
BTCD is in the process of breaking out from the 48% resistance area, which has been in place since May 2021. If BTCD breaks out, it could trigger a sharp increase toward 58%.
However, it is worth mentioning that the weekly RSI is overbought. The two previous times the indicator reached these levels (green circles) led to sharp decreases.
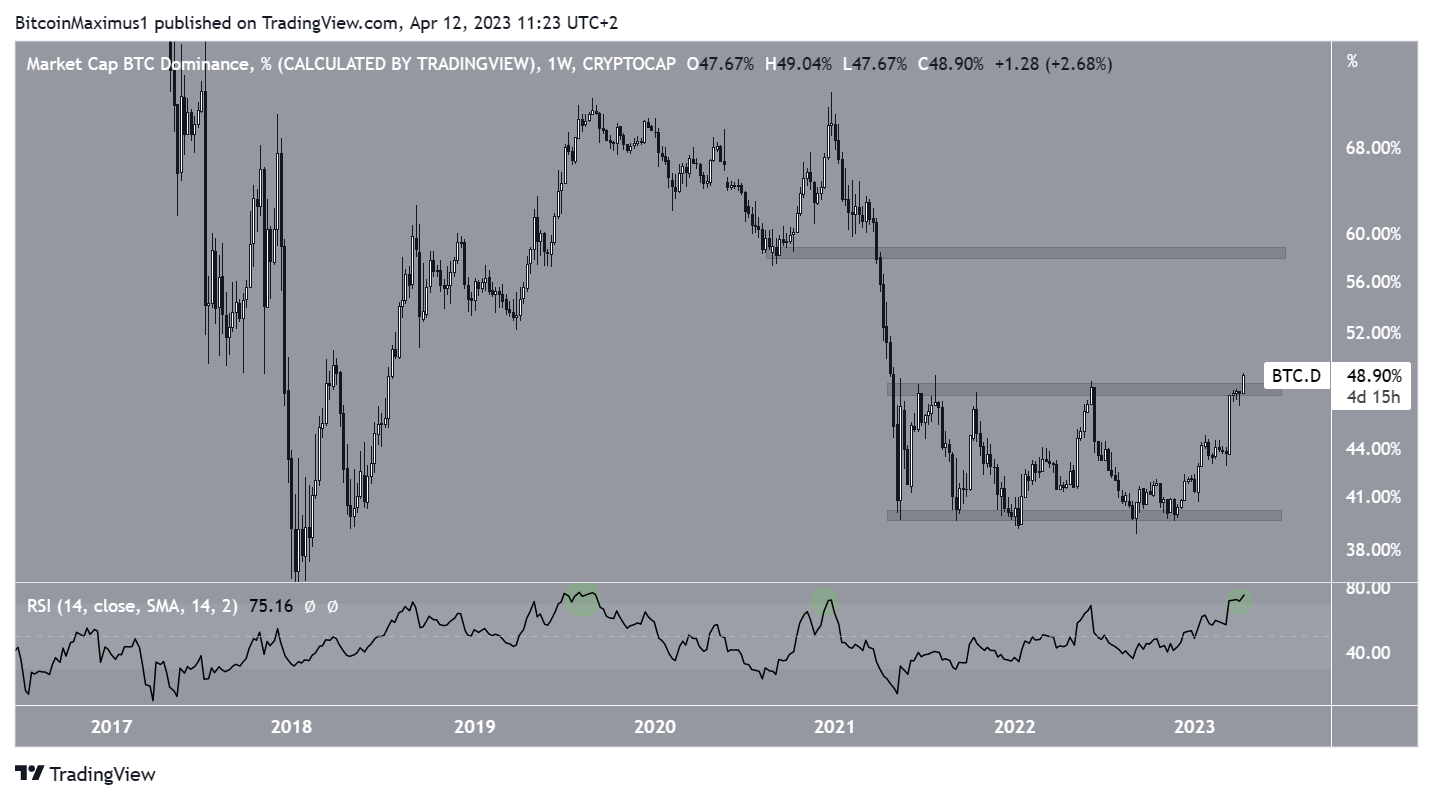
Since the weekly close is not for another four days, it is possible that BTCD falls and creates a long upper wick, invalidating the breakout in the process. This would greatly increase the chance of an upcoming altseason
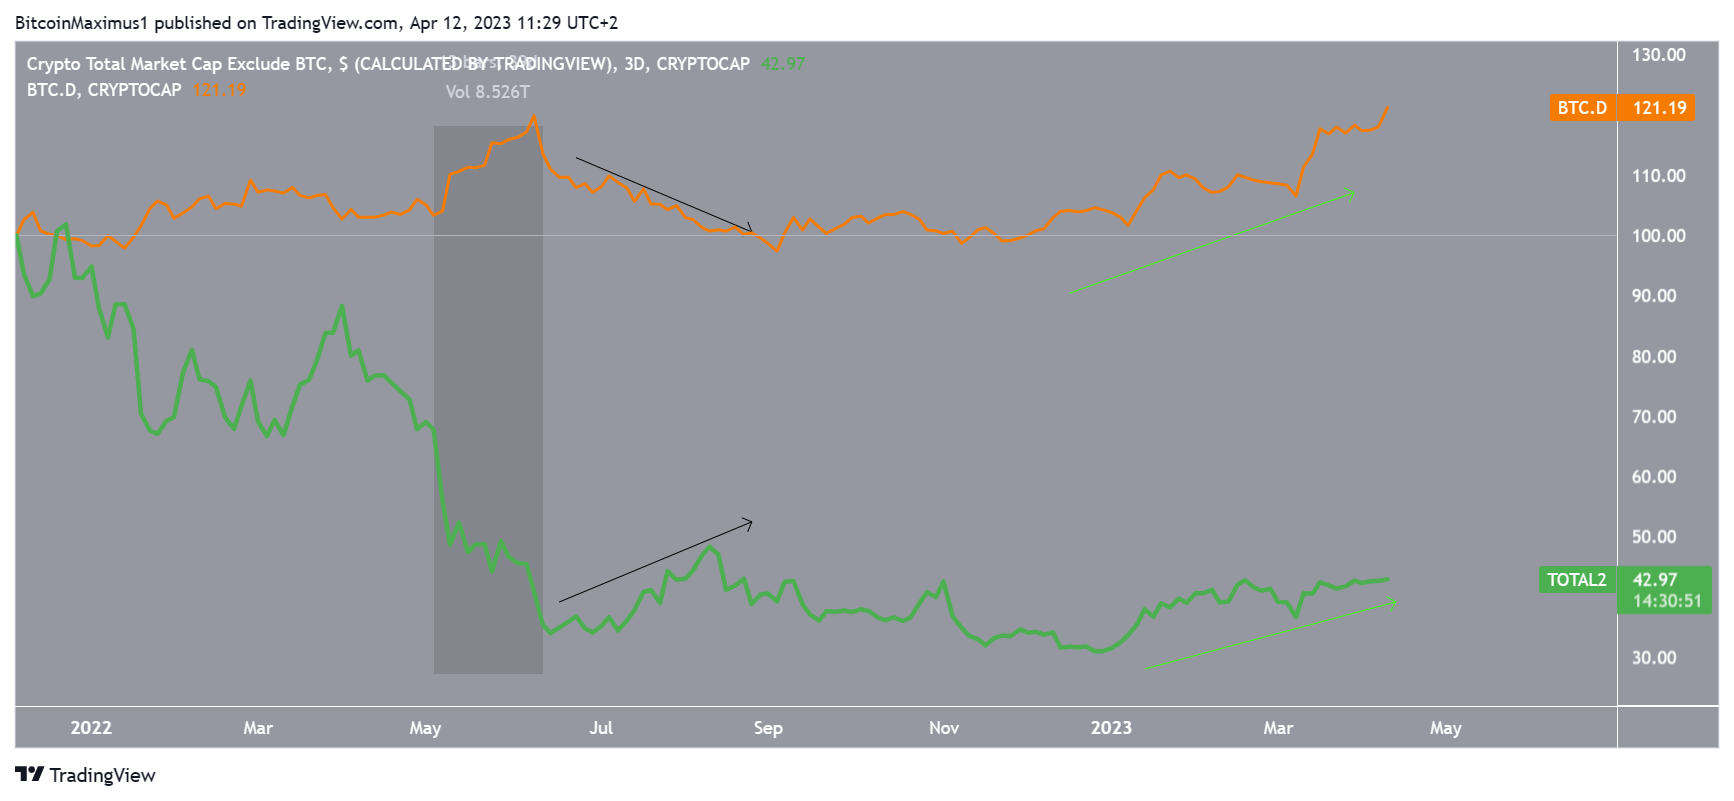
What Is the Relationship Between BTCD, BTC, and TOTAL2?
The relationship between BTC, BTCD and TOTAL2 is complicated and the price movement does not always adhere to the same rules.
Compared to the BTCD (orange), TOTAL2 (green) usually drops when BTCD increases rapidly. This was visible in May 2021 (highlighted), when BTC fell below $20,000. The reason for the increase in BTCD was that altcoins fell at a more accelerated rate than BTC. Afterward, BTCD gradually fell while Altcoins regained momentum (black arrows).
Currently, both BTCD and TOTAL2 are increasing at an accelerated rate. This is a sign of a strong and healthy market, since not all investors are flocking into BTC.
Next, a look at the TOTAL2 chart against the price of Bitcoin (BTC) shows that the periods in which the former outperforms Bitcoin are after BTC finishes a sharp upward movement and then begins to consolidate. This was evident in May 2021, when the Bitcoin price created a lower high after the then-all-time high of $30,000.
So, once BTC settled down, investors stopped chasing it, and money started flowing into altcoins.
The stage could be set for another similar increase if the BTC price halts its rapid upward movement and begins to consolidate.
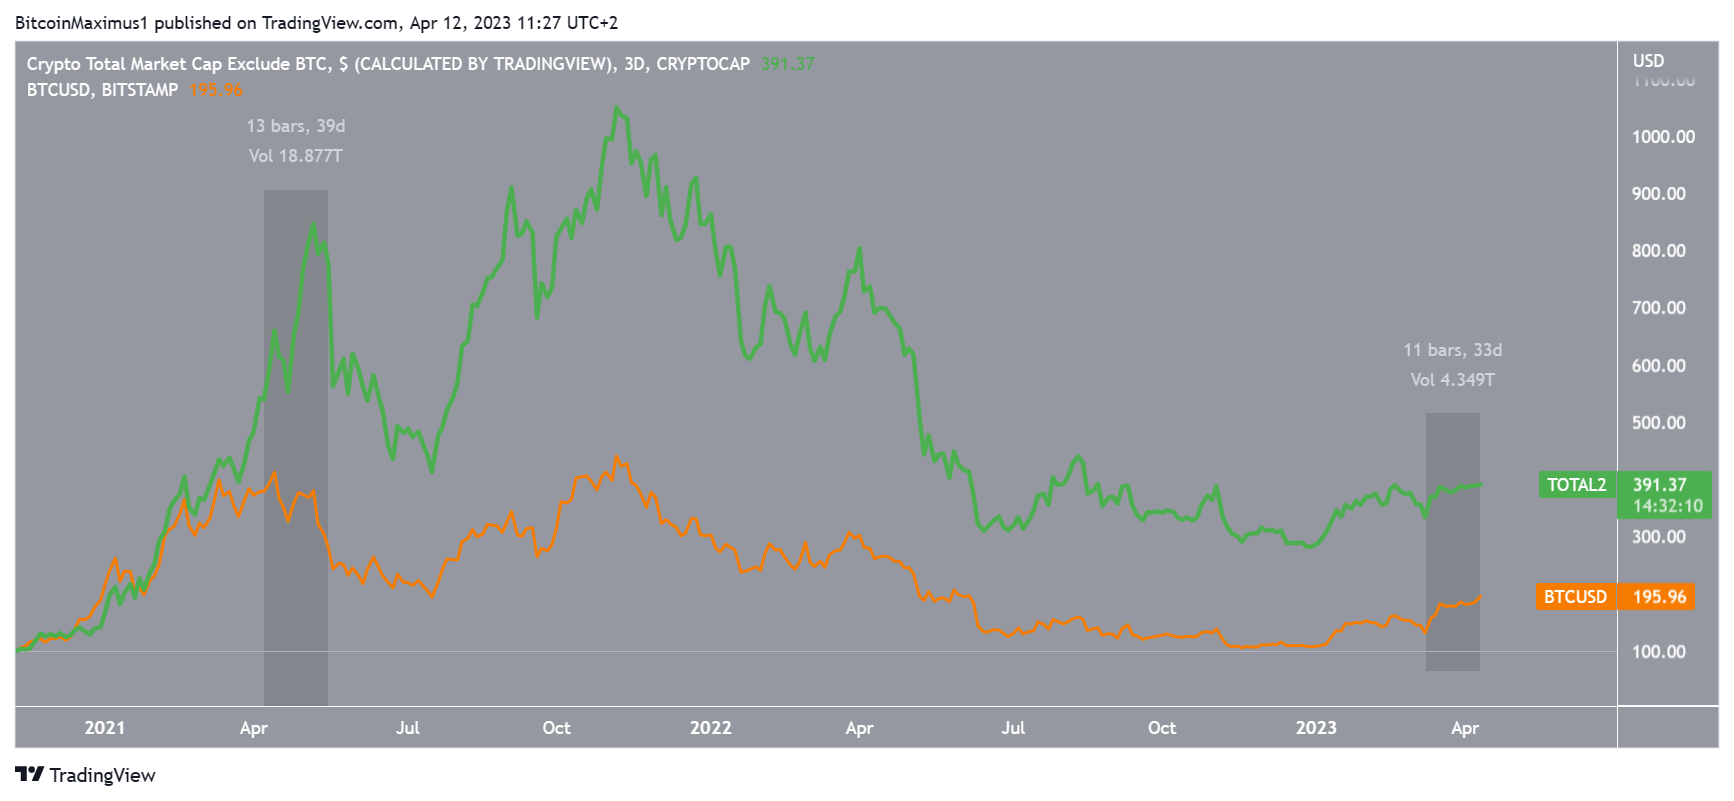
As a result of this analysis, the scenario which would most likely lead to a massive TOTAL2 increase would be a slight decrease or consolidation in the BTC price.
For BeInCrypto’s latest crypto market analysis, click here.


