
BeInCrypto takes a look at the seven altcoins that increased the most over the past seven days, from July 2 to July 9.
These altcoins are:
- Axie Infinity (AXS) : 93.54%
- KuCoin Token (KCS) : 77.76%
- Synthetix (SNX) : 59.91%
- Harmony (ONE) : 38.39%
- Aave (AAVE) : 29.95%
- Terra (LUNA) : 27.81%
- Stacks (STX) : 26.91%
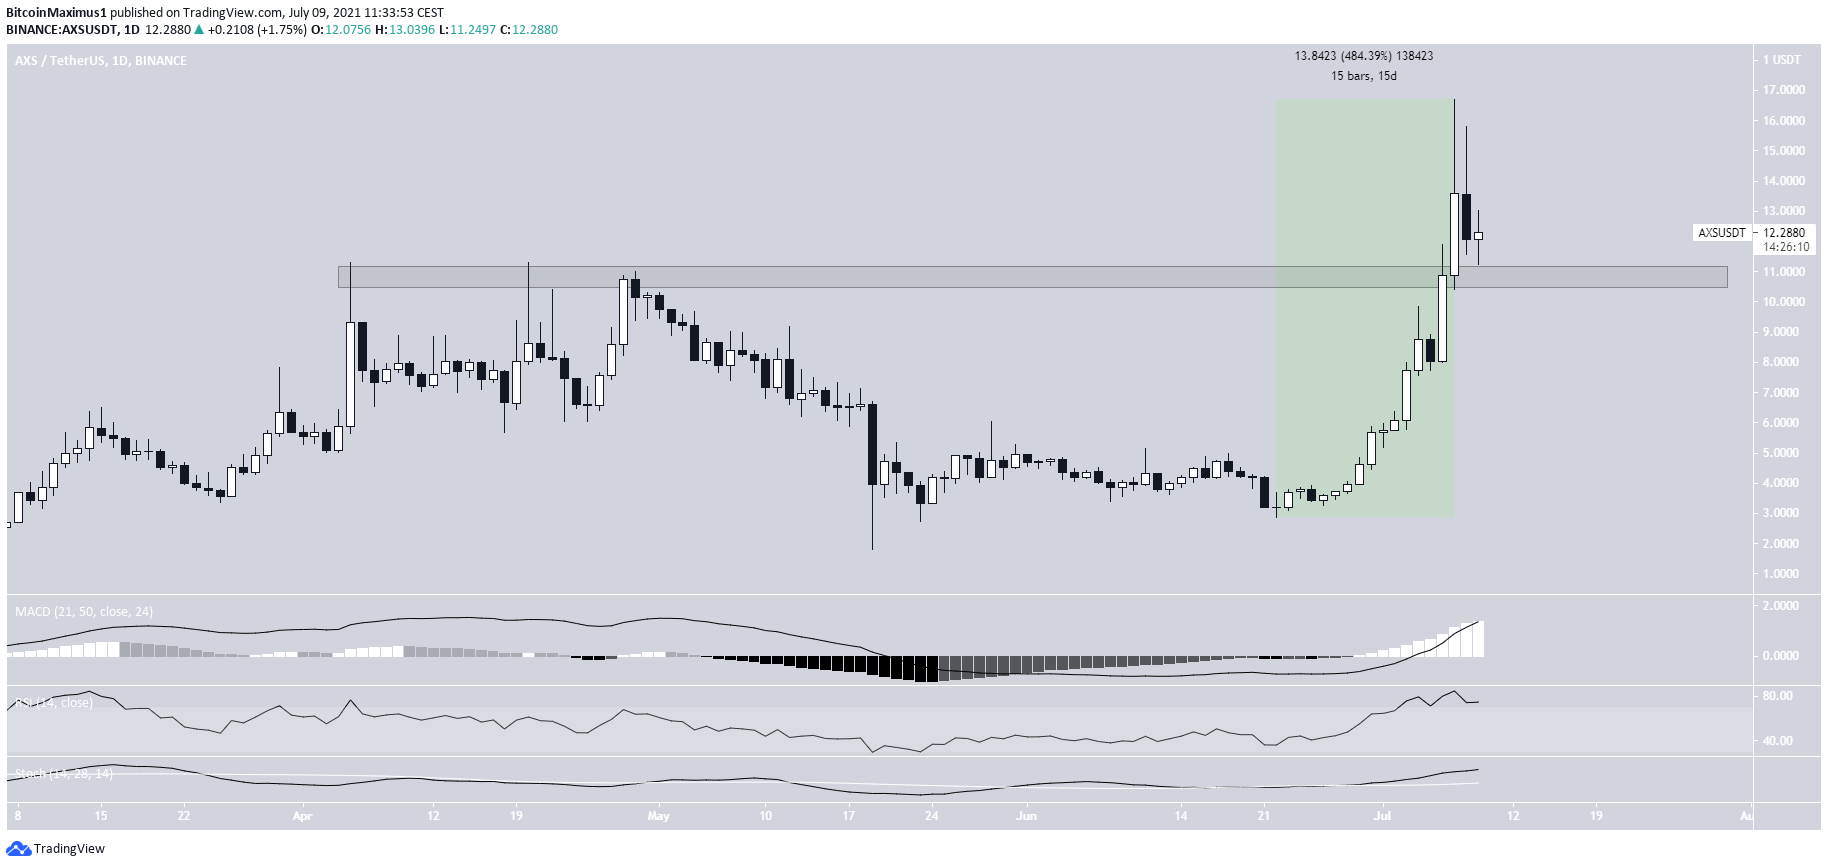
AXS
AXS has been moving upwards since May 19, after it reached a low of $1.80. It created a higher low on June 22 and resumed its upward movement at an accelerated rate.
On July 7, it reached a new all-time high price of $16.70. This amounted to an upward movement of 484% in fifteen days.
While AXS has been decreasing since July 7, technical indicators are still bullish. In addition, it’s trading above the $10.80 horizontal support area.
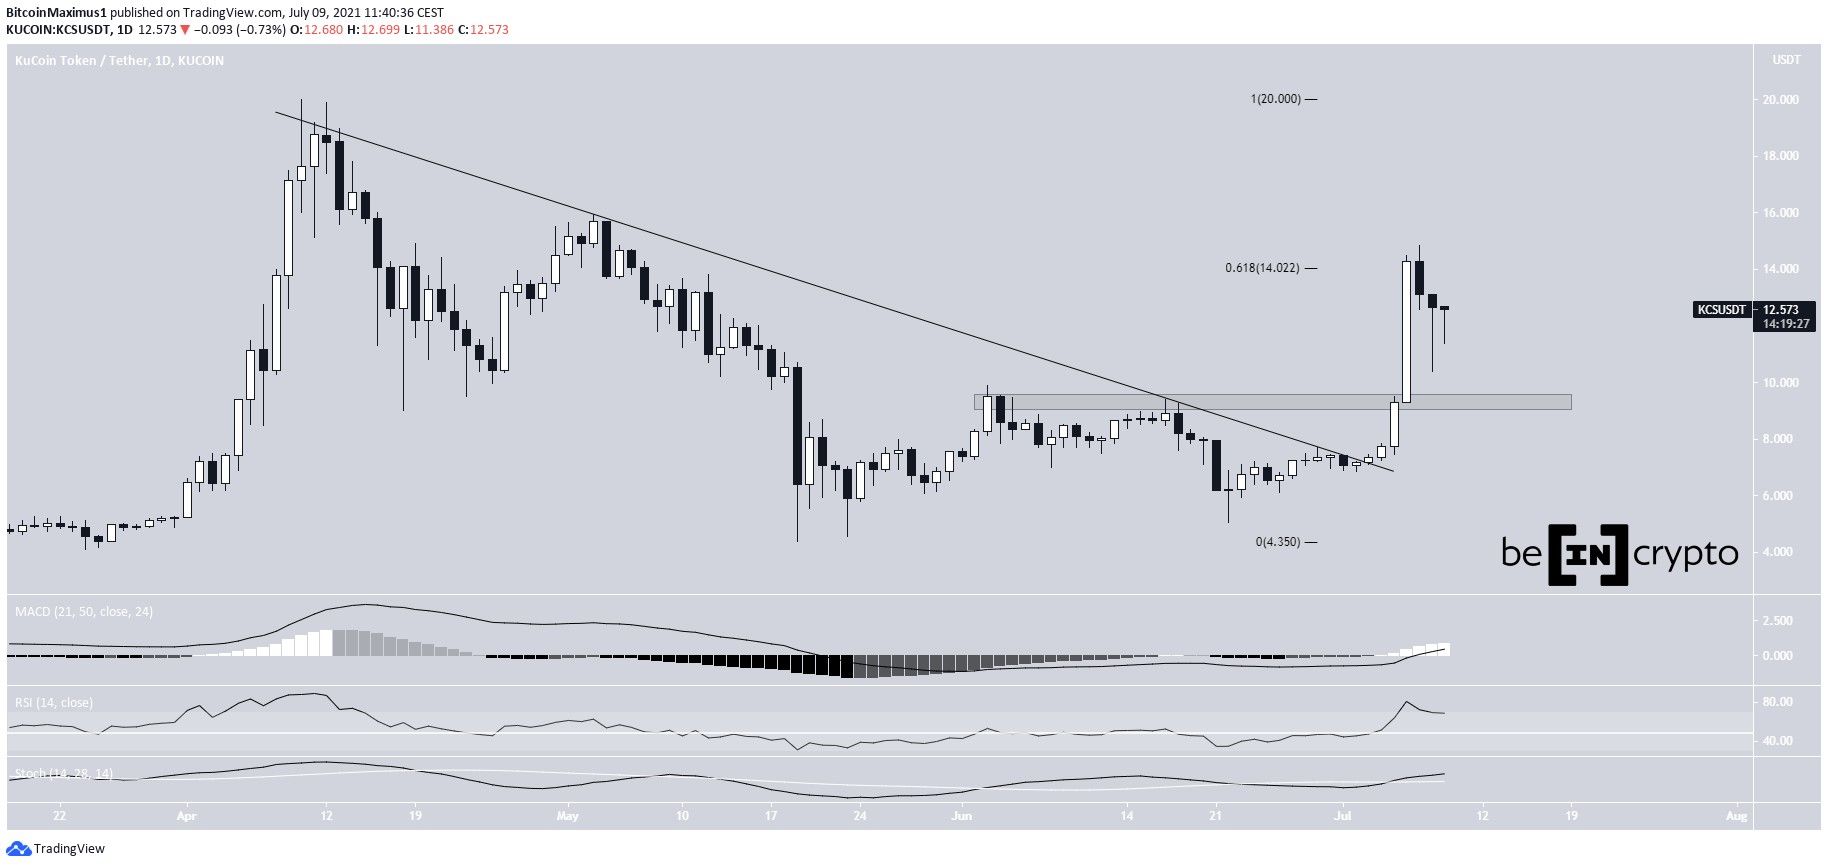
KCS
On July 3, KCS broke out from a descending resistance line that had been in place since April 10. It proceeded to reach a high of $14.85 on July 7 before retracing. The high was made at the 0.618 Fib retracement resistance level.
KCS reached a low of $10.40 on July 8, but immediately created a long lower wick and bounced. The low was made slightly above the $9.30 horizontal support area.
Technical indicators are still bullish.
A breakout from the $14 resistance area would likely take KCS towards the $20 all-time high once again.
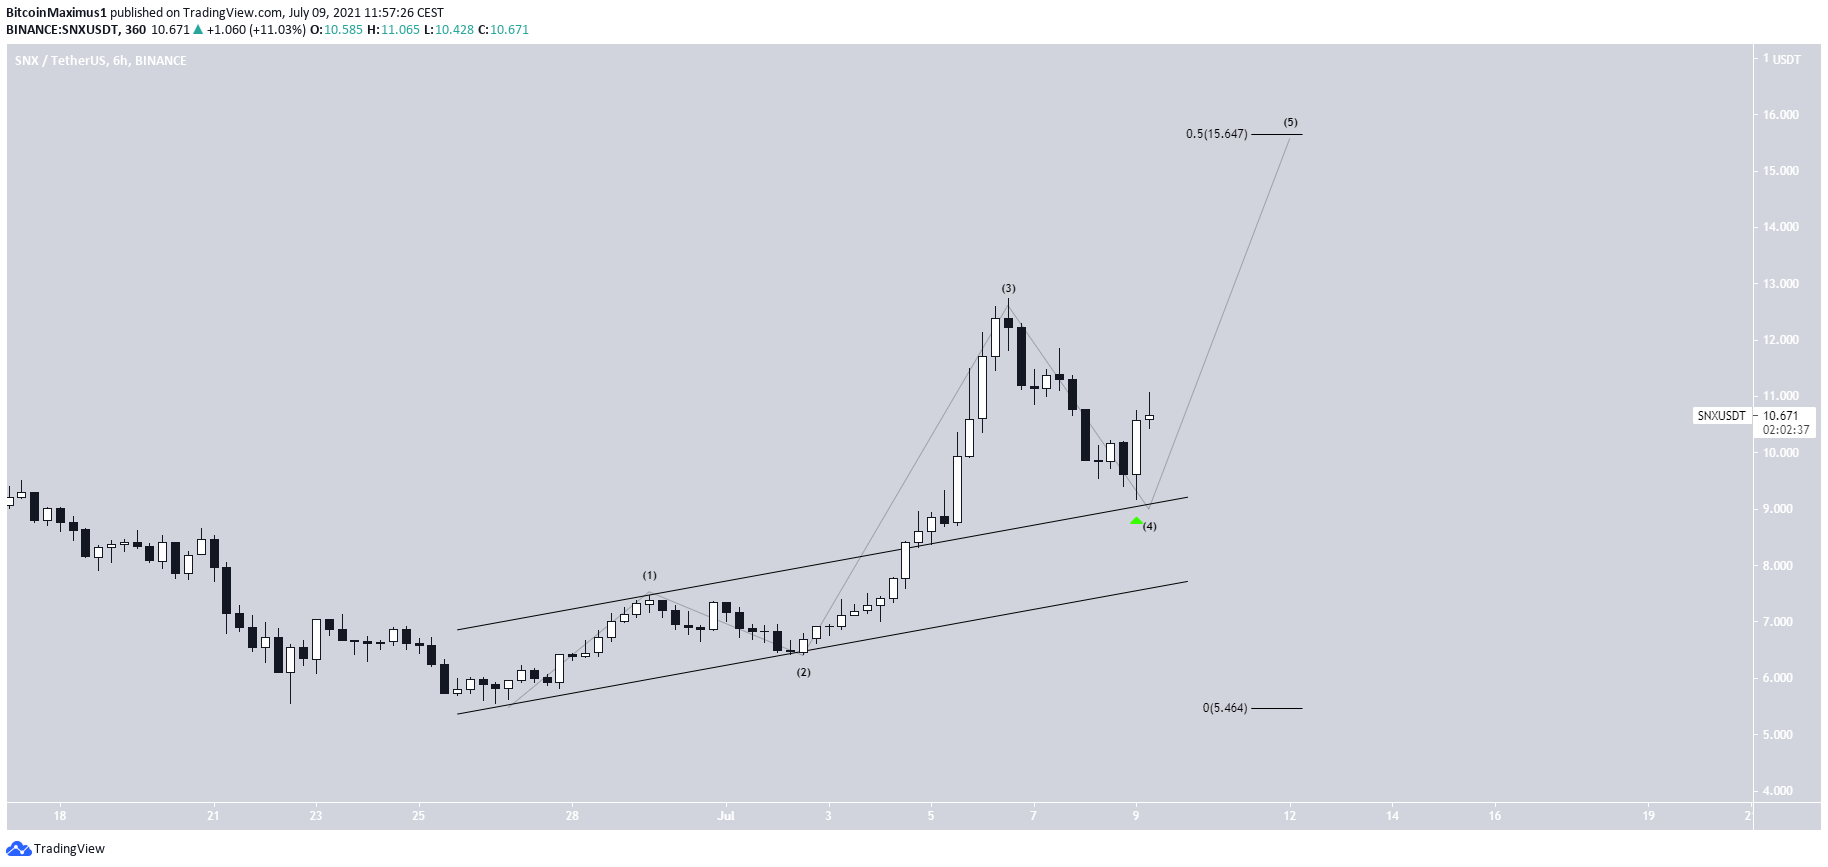
SNX
SNX began an upward movement on June 26. On July 4, it broke out from an ascending parallel channel and proceeded to reach a high of $12.74 two days later.
Since then, it has returned to the resistance line of the channel and validated it as support. This might have completed a fourth wave pullback pattern.
In this pattern, SNX could increase toward the next resistance at $15.64 (the 0.5 Fib retracement resistance level).
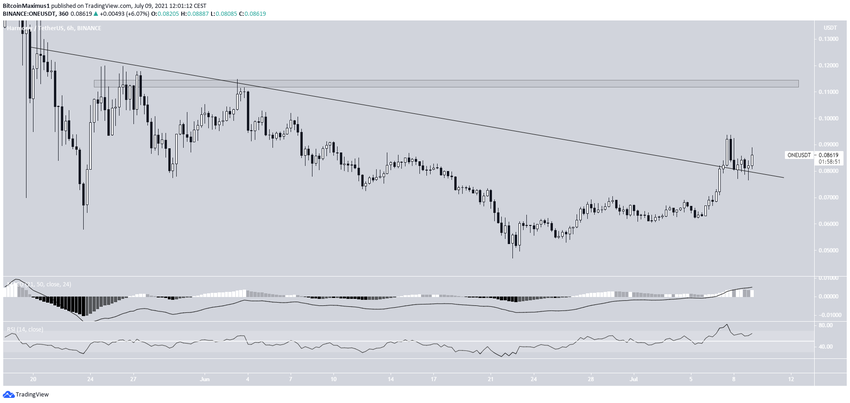
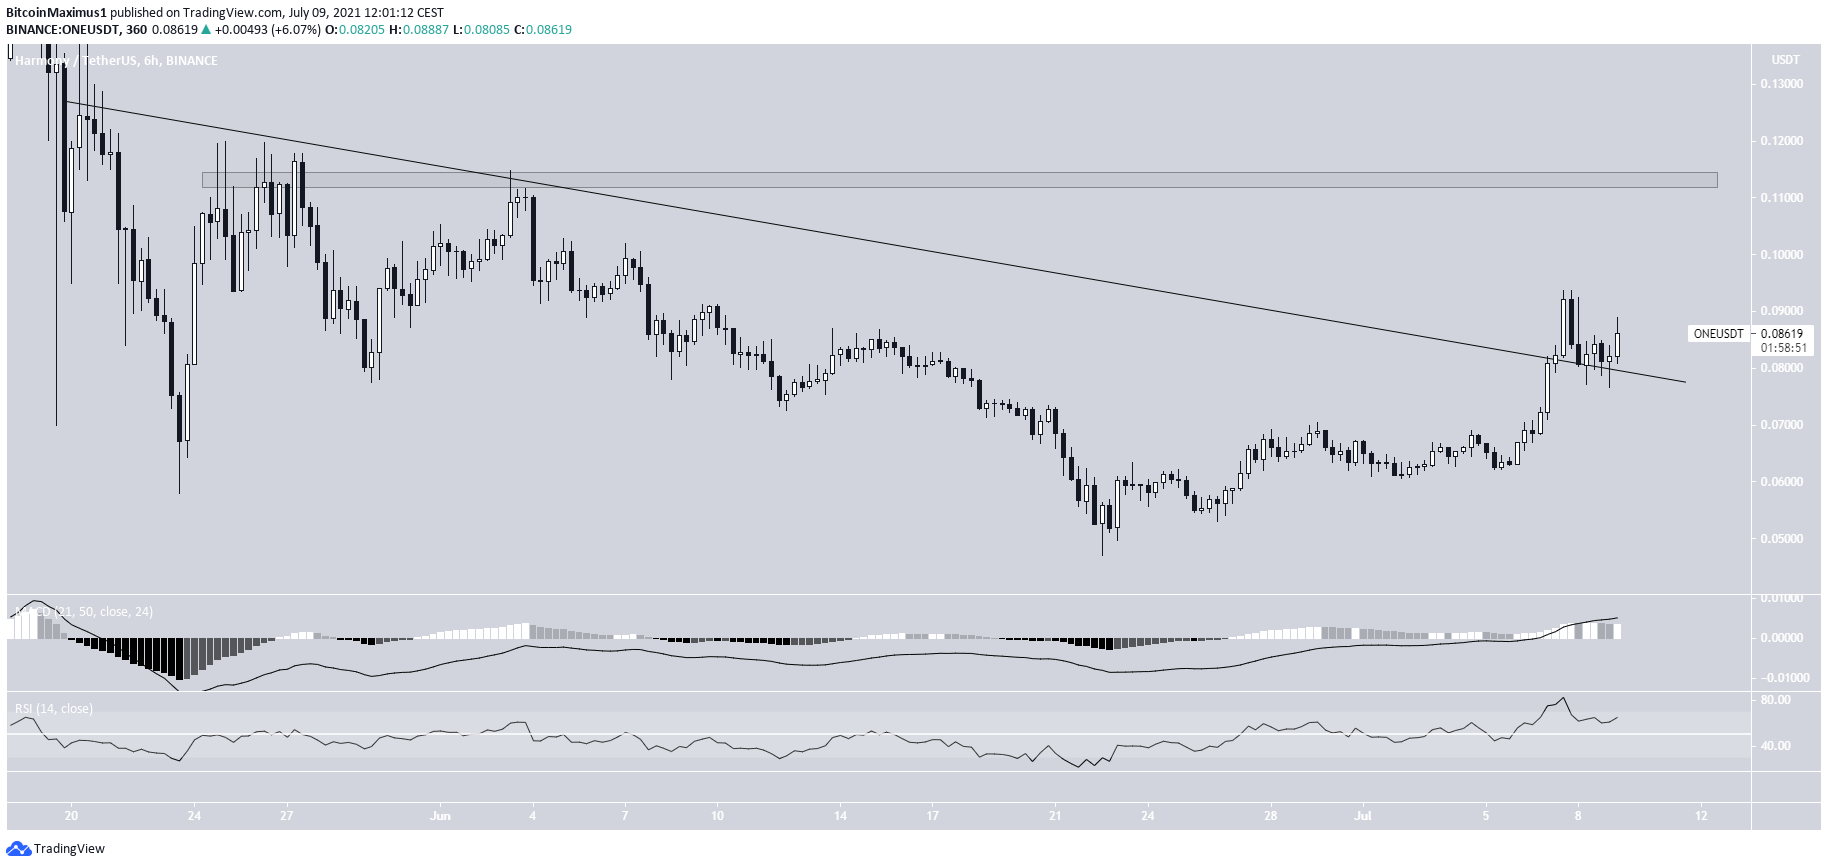
ONE
ONE began an upward movement on June 22, after reaching a low of $0.047. On July 7, it broke out from a descending resistance line and validated it as support the next day (green icon).
The RSI and MACD are both bullish, supporting the continuation of the upward movement. The next closest horizontal resistance level is found at $0.113.
AAVE
AAVE has been increasing since June 23. On July 2, it broke out from a descending resistance line and validated it as support the next day. So far, AAVE reached a high of $347.53 before falling back.
AAVE failed to break out above the $315 horizontal resistance area. Doing so would likely trigger a sharp upward movement towards the closest resistance at $476.
Technical indicators are bullish. This is especially evident by the RSI movement above 50 and the bullish cross in the Stochastic oscillator.
Therefore, an eventual breakout seems likely.
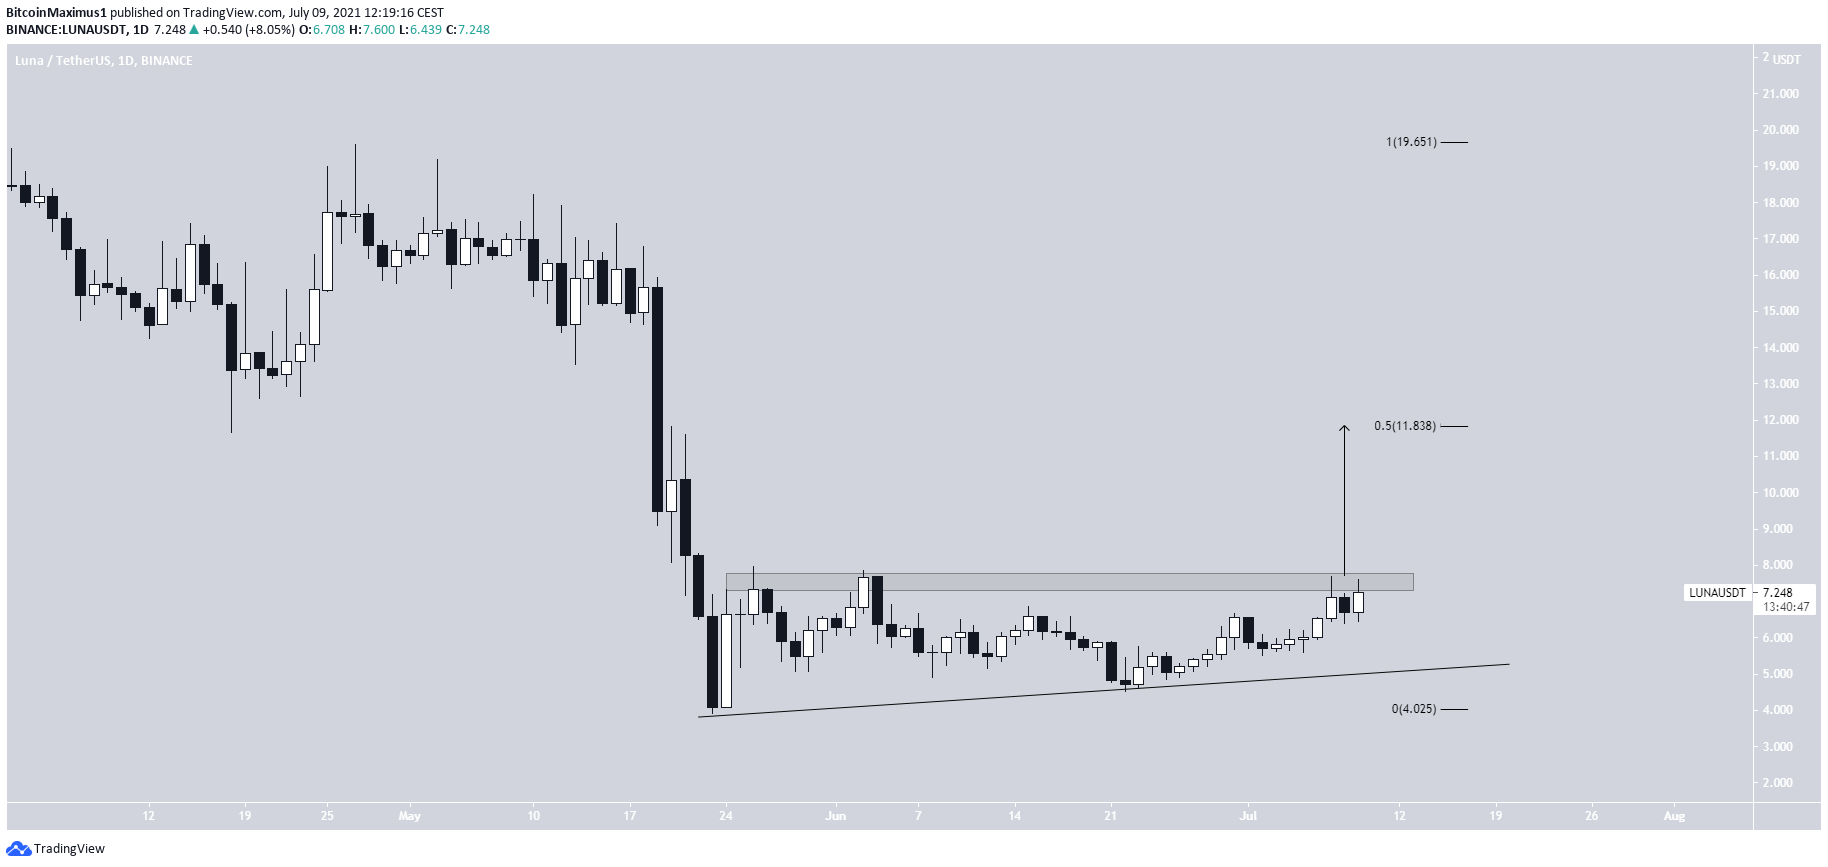
LUNA
LUNA has been increasing since May 23. It created a higher low on June 22 and resumed its upward movement. It’s potentially following an ascending support line.
Currently, LUNA is facing resistance from the $7.30 horizontal resistance area. This potentially creates an ascending triangle, which is normally considered a bullish pattern.
A breakout that travels the entire length of the triangle would take LUNA to $11.84 (the 0.5 Fib retracement resistance area).
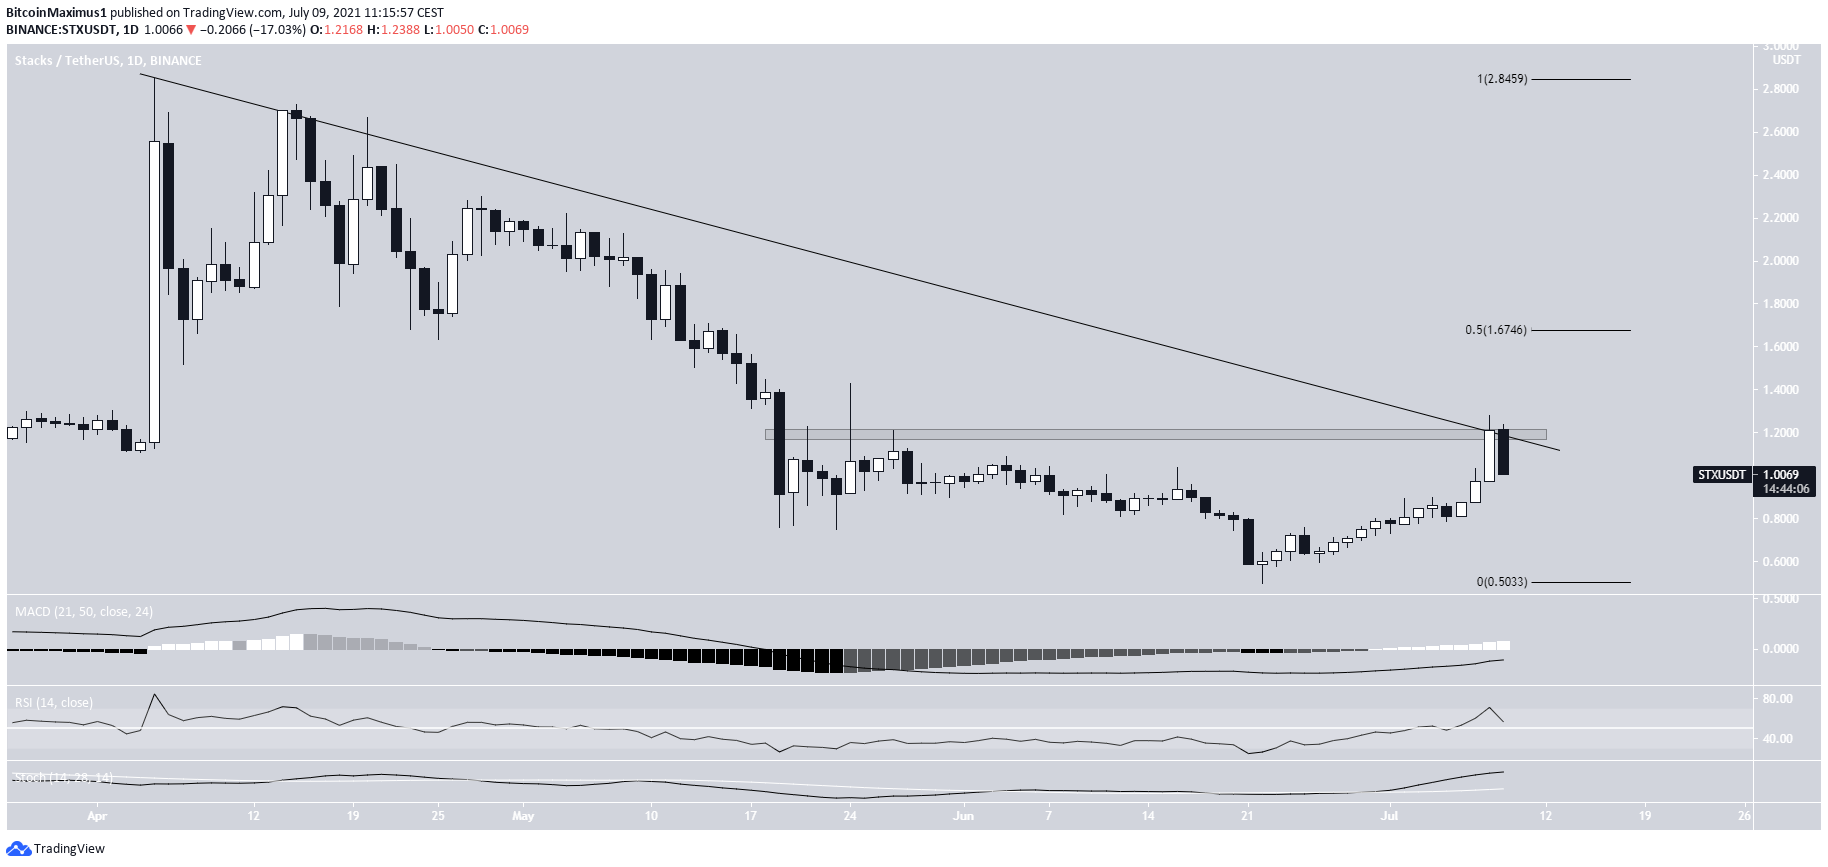
STX
STX has been moving upwards since reaching a low of $0.50 on June 22. On July 8, it reached a high of $1.28, reaching the descending resistance line for the third time. This is also a horizontal resistance area.
STX has been rejected since and is in the process of decreasing.
If a breakout were to occur, the next resistance would be found at $1.675 (the 0.5 Fib retracement resistance level).
Technical indicators are bullish. The RSI is above 50, the Stochastic oscillator has made a bullish cross, and the MACD is nearly positive.
For BeInCrypto’s latest bitcoin (BTC) analysis, click here.
