
The Litecoin (LTC) price broke down from a diagonal support level after a rejection from long-term horizontal resistance.
The decrease was swift, and the LTC price now struggles to find support. The downward movement continues, and the price could find support at the closest Fib level.
Litecoin Price Shows Bearish Signs at Range High
The LTC price has increased since June 2022. The upward movement led to a yearly high of $105.70 in Feb. However, the price failed to break out from the $100 horizontal resistance area. Rather, it was rejected by it twice (red icons). The move is considered a bearish sign for several reasons.
Firstly, the rejections created a double top. The double top is a bearish pattern in which the price gets rejected from the same area twice and then falls sharply.
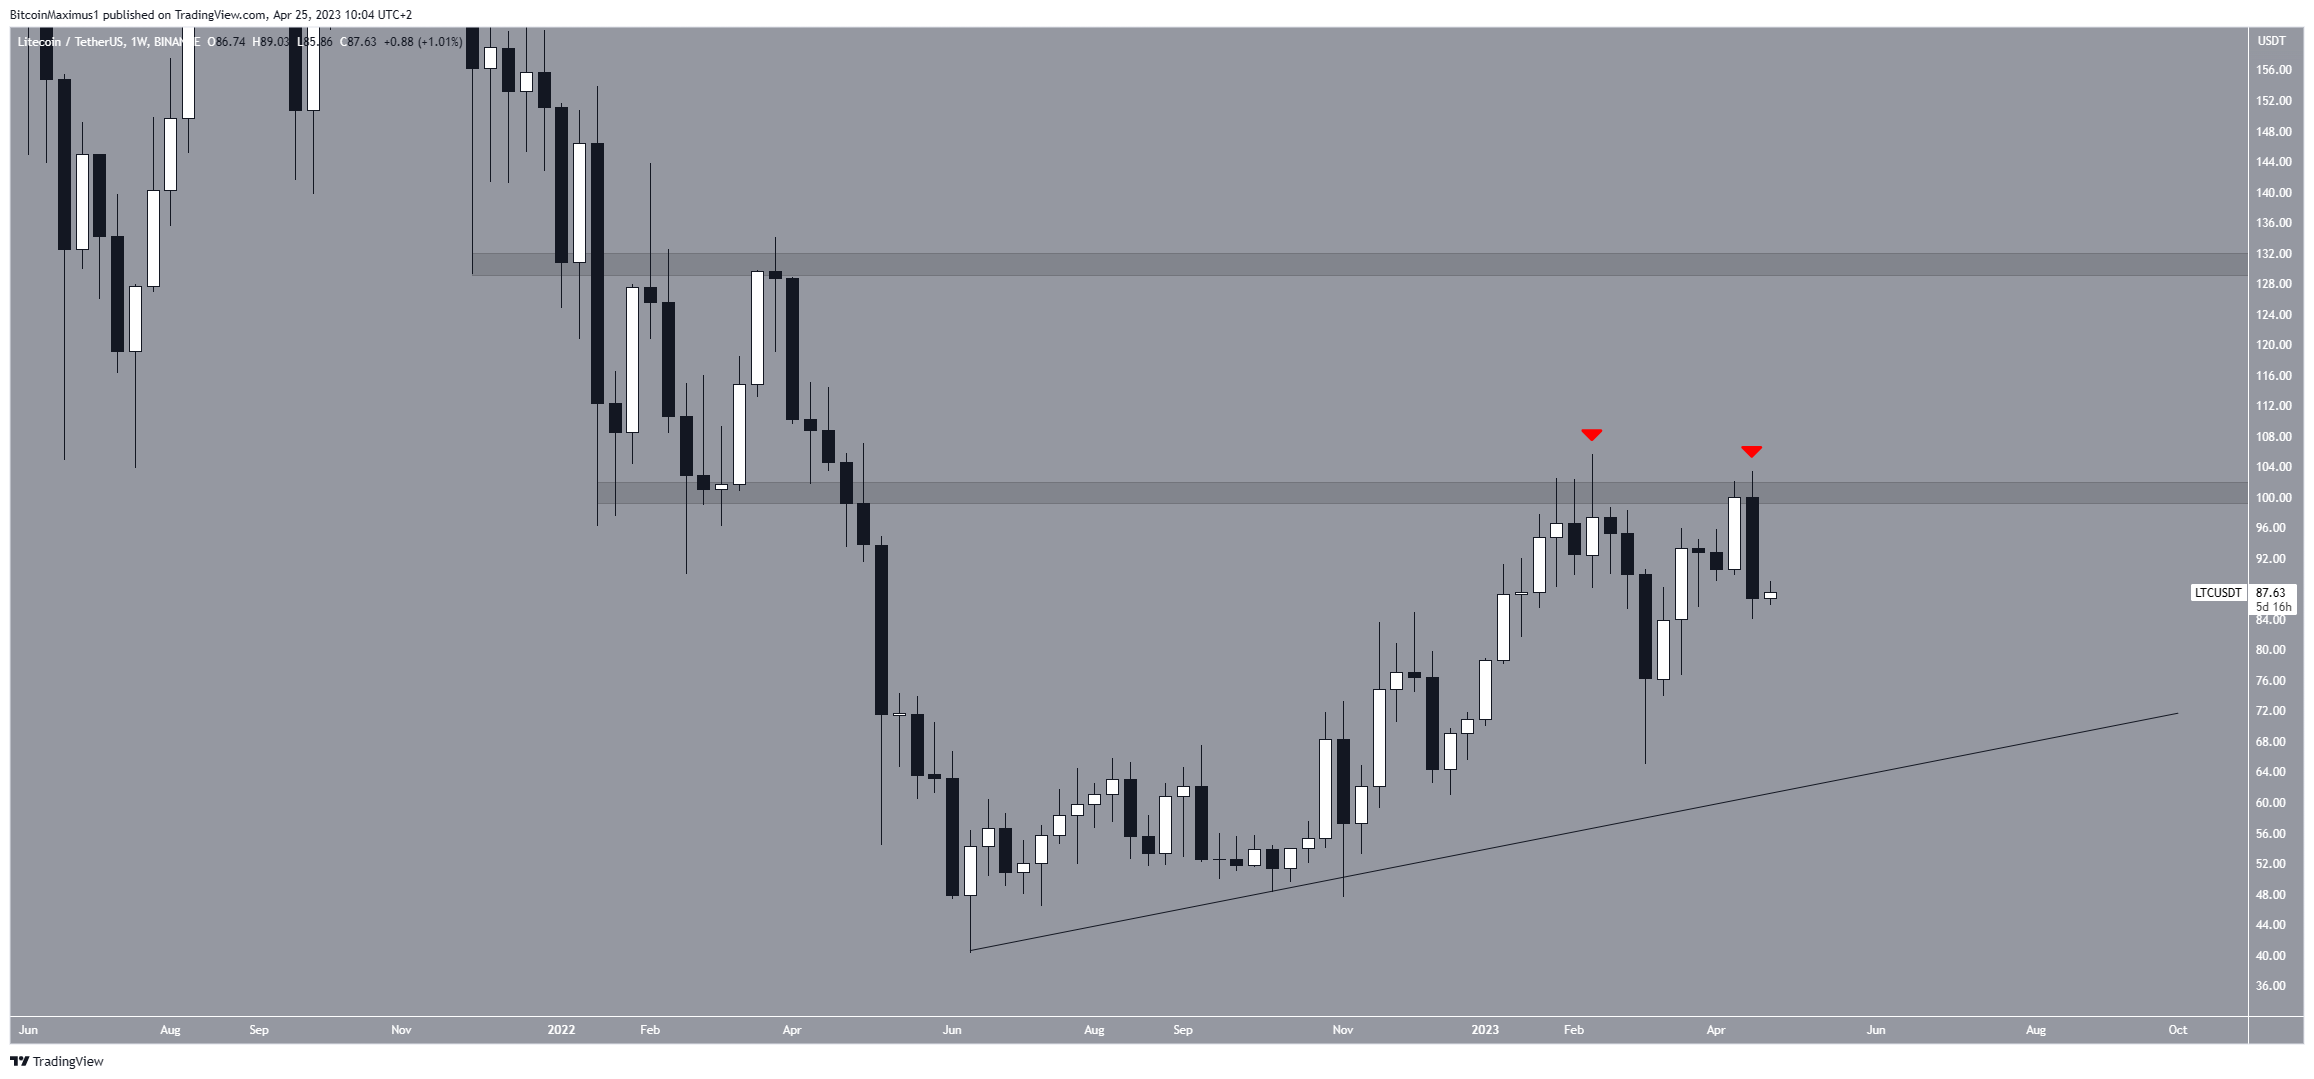
Secondly, the final rejection also created a bearish engulfing candlestick. This is a type of bearish candlestick in which the entire increase from the previous period is negated. It is confirmed with a close below the opening of the previous period, something that happened with LTC.
If the decrease continues, LTC could find support at a long-term ascending support line at $74. On the other hand, if the price regains momentum and breaks out, it could increase to the next resistance at an average price of $130.
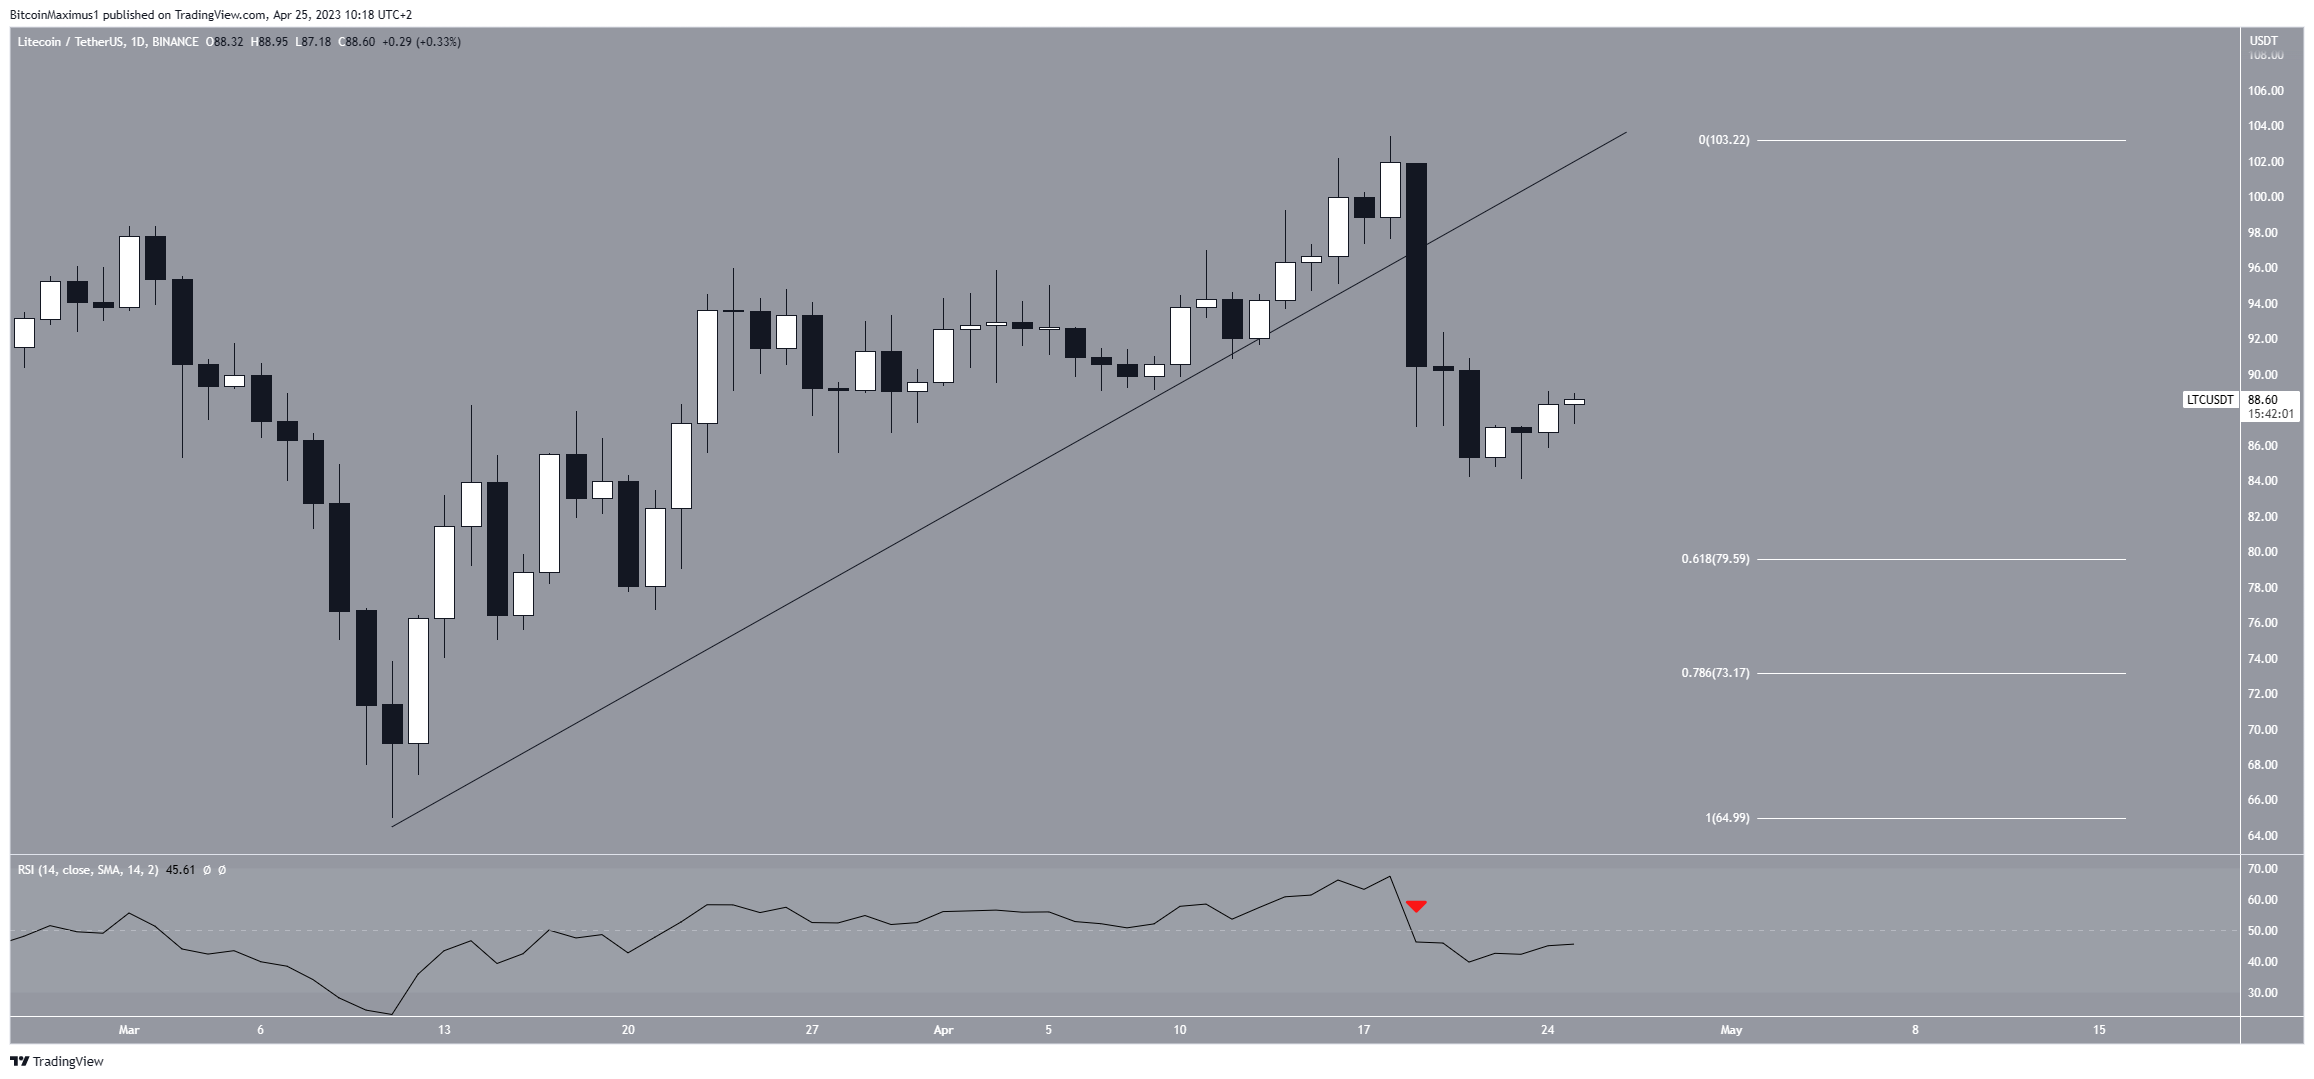
LTC Price Prediction: Where Will Price Find Support?
The technical analysis from the daily time frame gives a bearish LTC price prediction, supporting the continuation of the downward movement for the future price.
The first reason for this is the price breakdown from a short-term ascending support line. Since the line was in place since March, its breakdown suggests that a corrective movement has now begun.
Next, the daily Relative Strength Index (RSI) has moved below 50 (red icon) and is decreasing. When evaluating market conditions, traders use the RSI as a momentum indicator to determine if a market is overbought or oversold and to decide whether to accumulate or sell an asset.
If the RSI reading is above 50 and the trend is upward, bulls still have an advantage, but if the reading is below 50, the opposite is true. Therefore, the Litecoin RSI reading is bearish and supports the continuation of the downward movement.
If the decrease continues, the closest support will be between $73 and $80, created by the 0.618-0.786 Fib retracement support levels.
The theory of Fibonacci retracement levels suggests that after a substantial price move in one direction, the price will partially retrace or return to a prior price level before continuing in its original direction. This principle can be used to determine the peak of potential future upward movements.
Since the $73 Fib support coincides with the long-term ascending support line, it will be more likely to act as the bottom.
Despite the bearish Litecoin forecast, a weekly close above $100 will indicate that the trend is bullish instead. In that case, a movement to $130 will be the most likely scenario.
For BeInCrypto’s latest crypto market analysis, click here.
