
At BeInCrypto, we regular price analyses and predictions for Litecoin (LTC). In our Apr 5 Litecoin (LTC) analysis, we predicted that the price may break out of it then-current trading pattern Our prediction was validated on Apr 6. To learn more, read our latest analysis below:
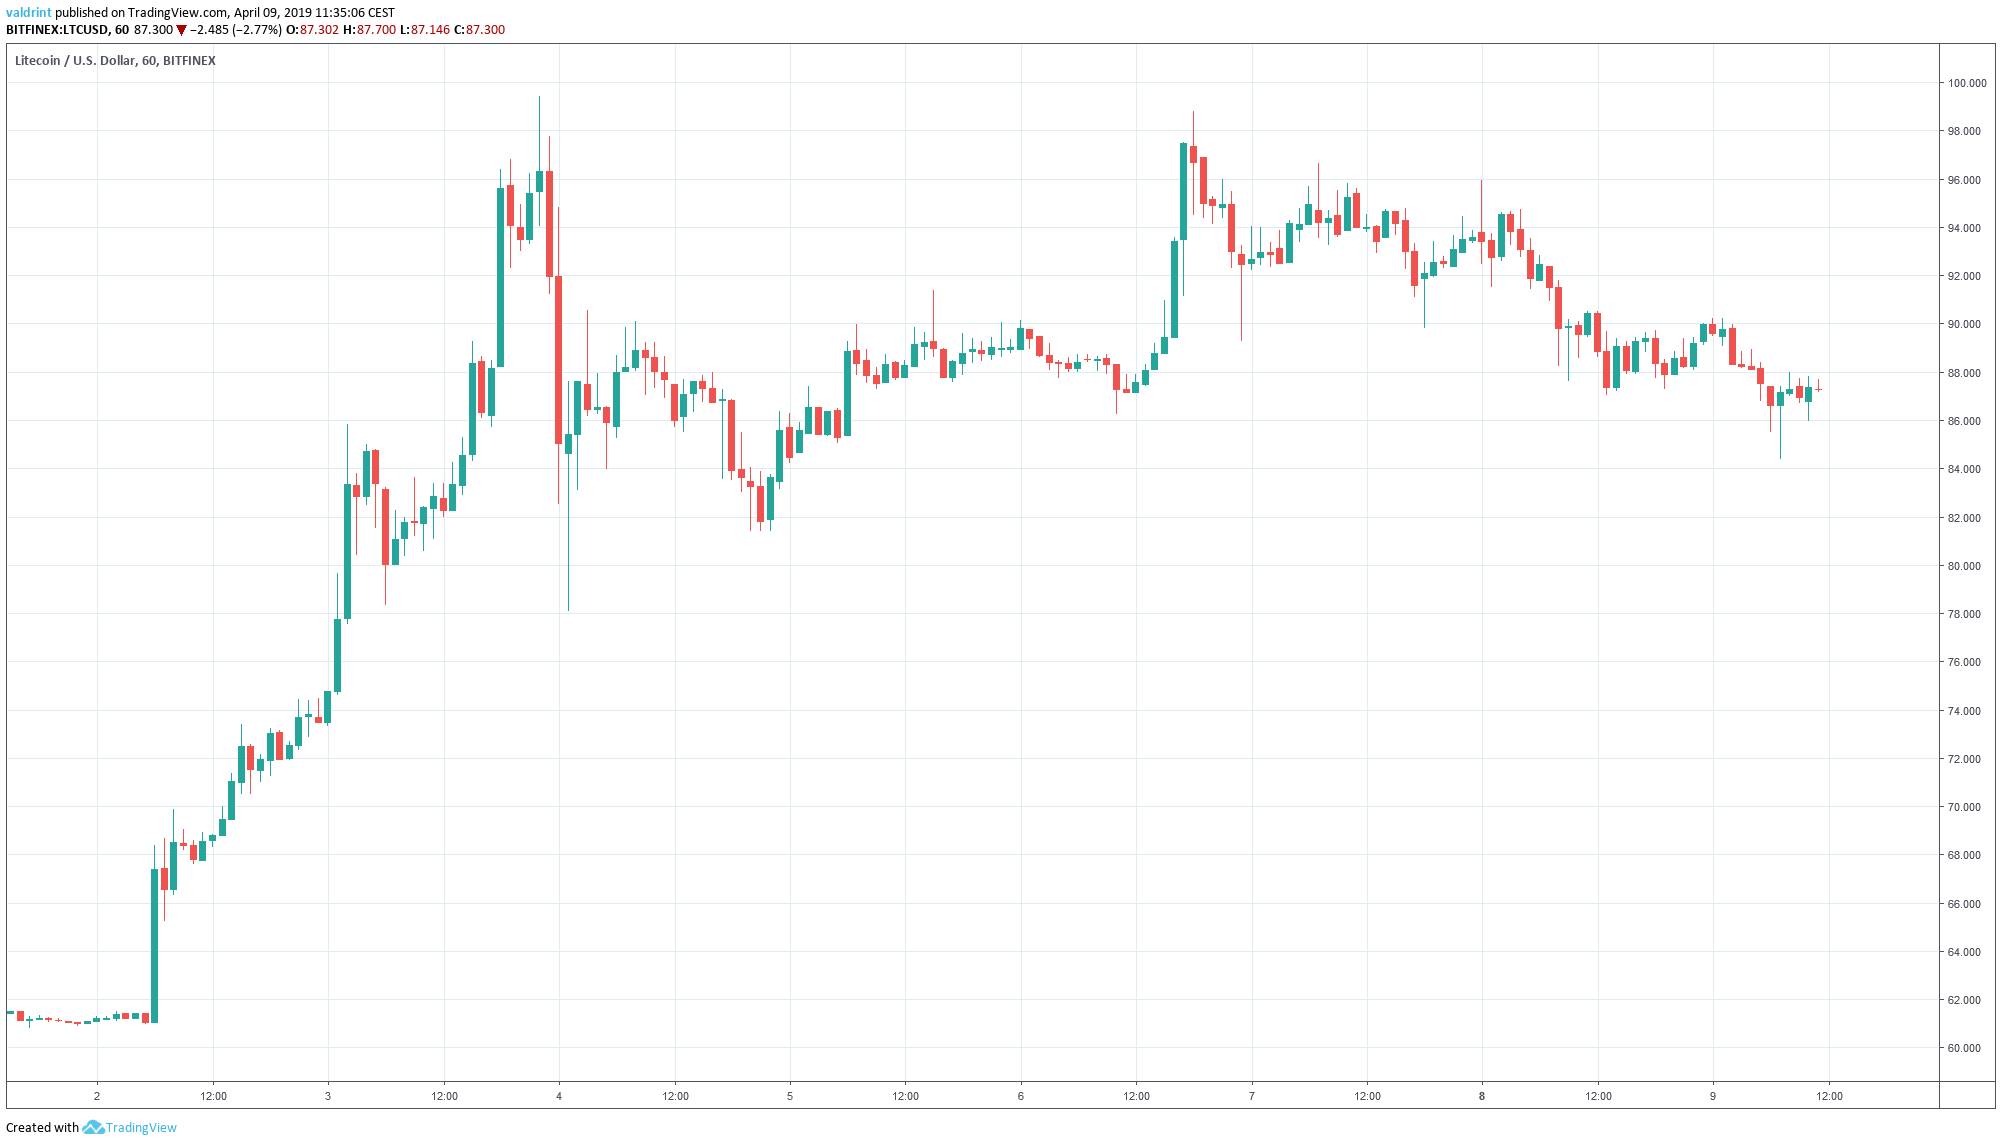
Litecoin has seen steady prices increases throughout 2019. On Apr 2, these accelerated as part of a market-wide spike. By Apr 3, Litecoin reached a high of $99.43.
A rapid decline was followed by a gradual increase. On Apr 6, another attempt at $100 was made when Litecoin reached a high of $98.80.
Prices have since dropped to under $90:
Litecoin (LTC): Trends And Highlights For April 9, 2019
- The price of LTC/USD has been on a downtrend since Apr 6.
- Litecoin is trading inside a symmetrical triangle.
- Bullish divergence is developing in the RSI.
- There is resistance near $98 and support near $78.
Tracing Support
The price of LTC/USD on Bitfinex was analyzed at one-hour intervals from Apr 2 to Apr 9. On Apr 3, the price reached an hourly low of $78.3. Several market cycles have been completed and the price has made a higher low each time. Tracing these lows gives us an ascending support line: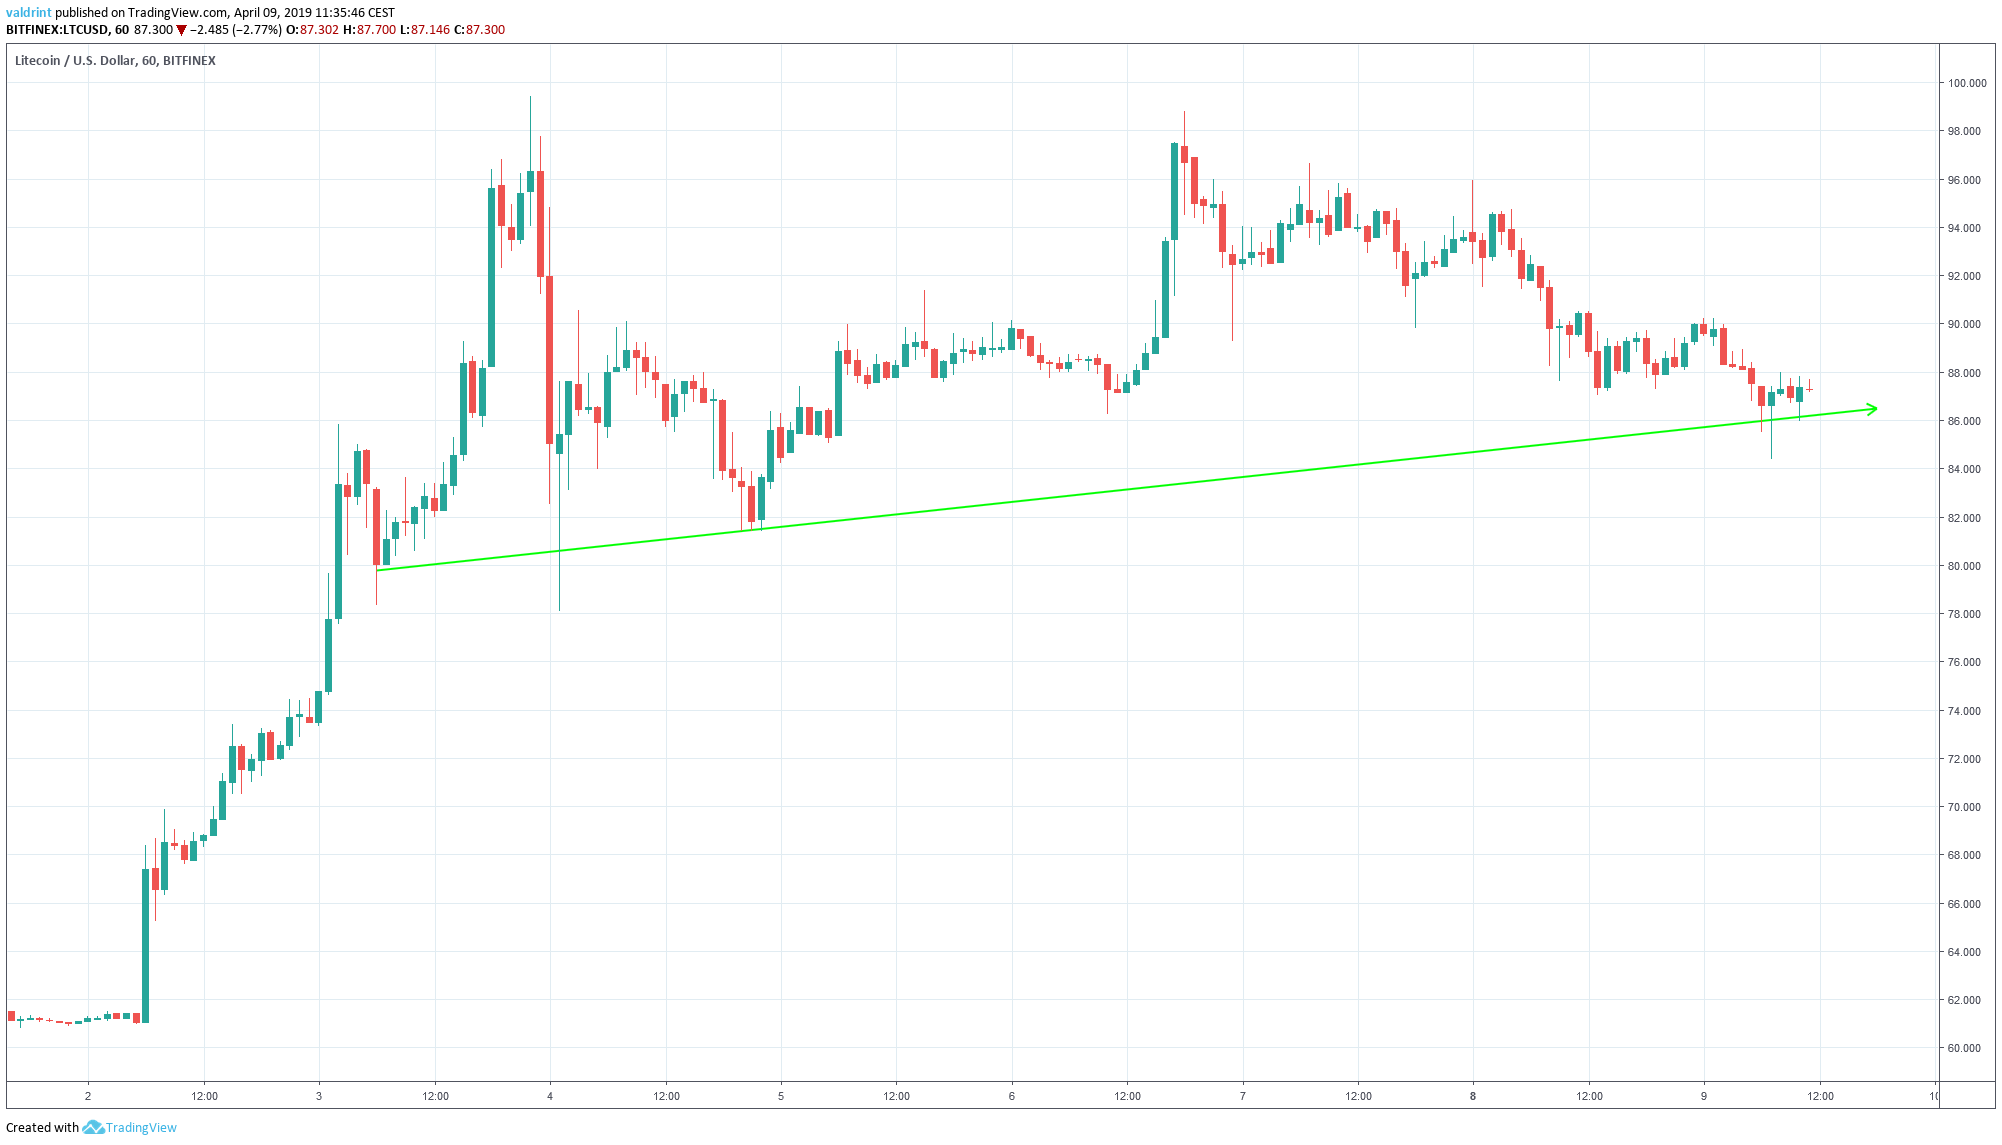 On Apr 6, the price reached a high of $98.8. Since, it has been on a gradual decrease, with each high being lower than the previous one.
Tracing these highs gives us a descending resistance line.
The support and resistance lines combine to create a symmetrical triangle:
On Apr 6, the price reached a high of $98.8. Since, it has been on a gradual decrease, with each high being lower than the previous one.
Tracing these highs gives us a descending resistance line.
The support and resistance lines combine to create a symmetrical triangle:
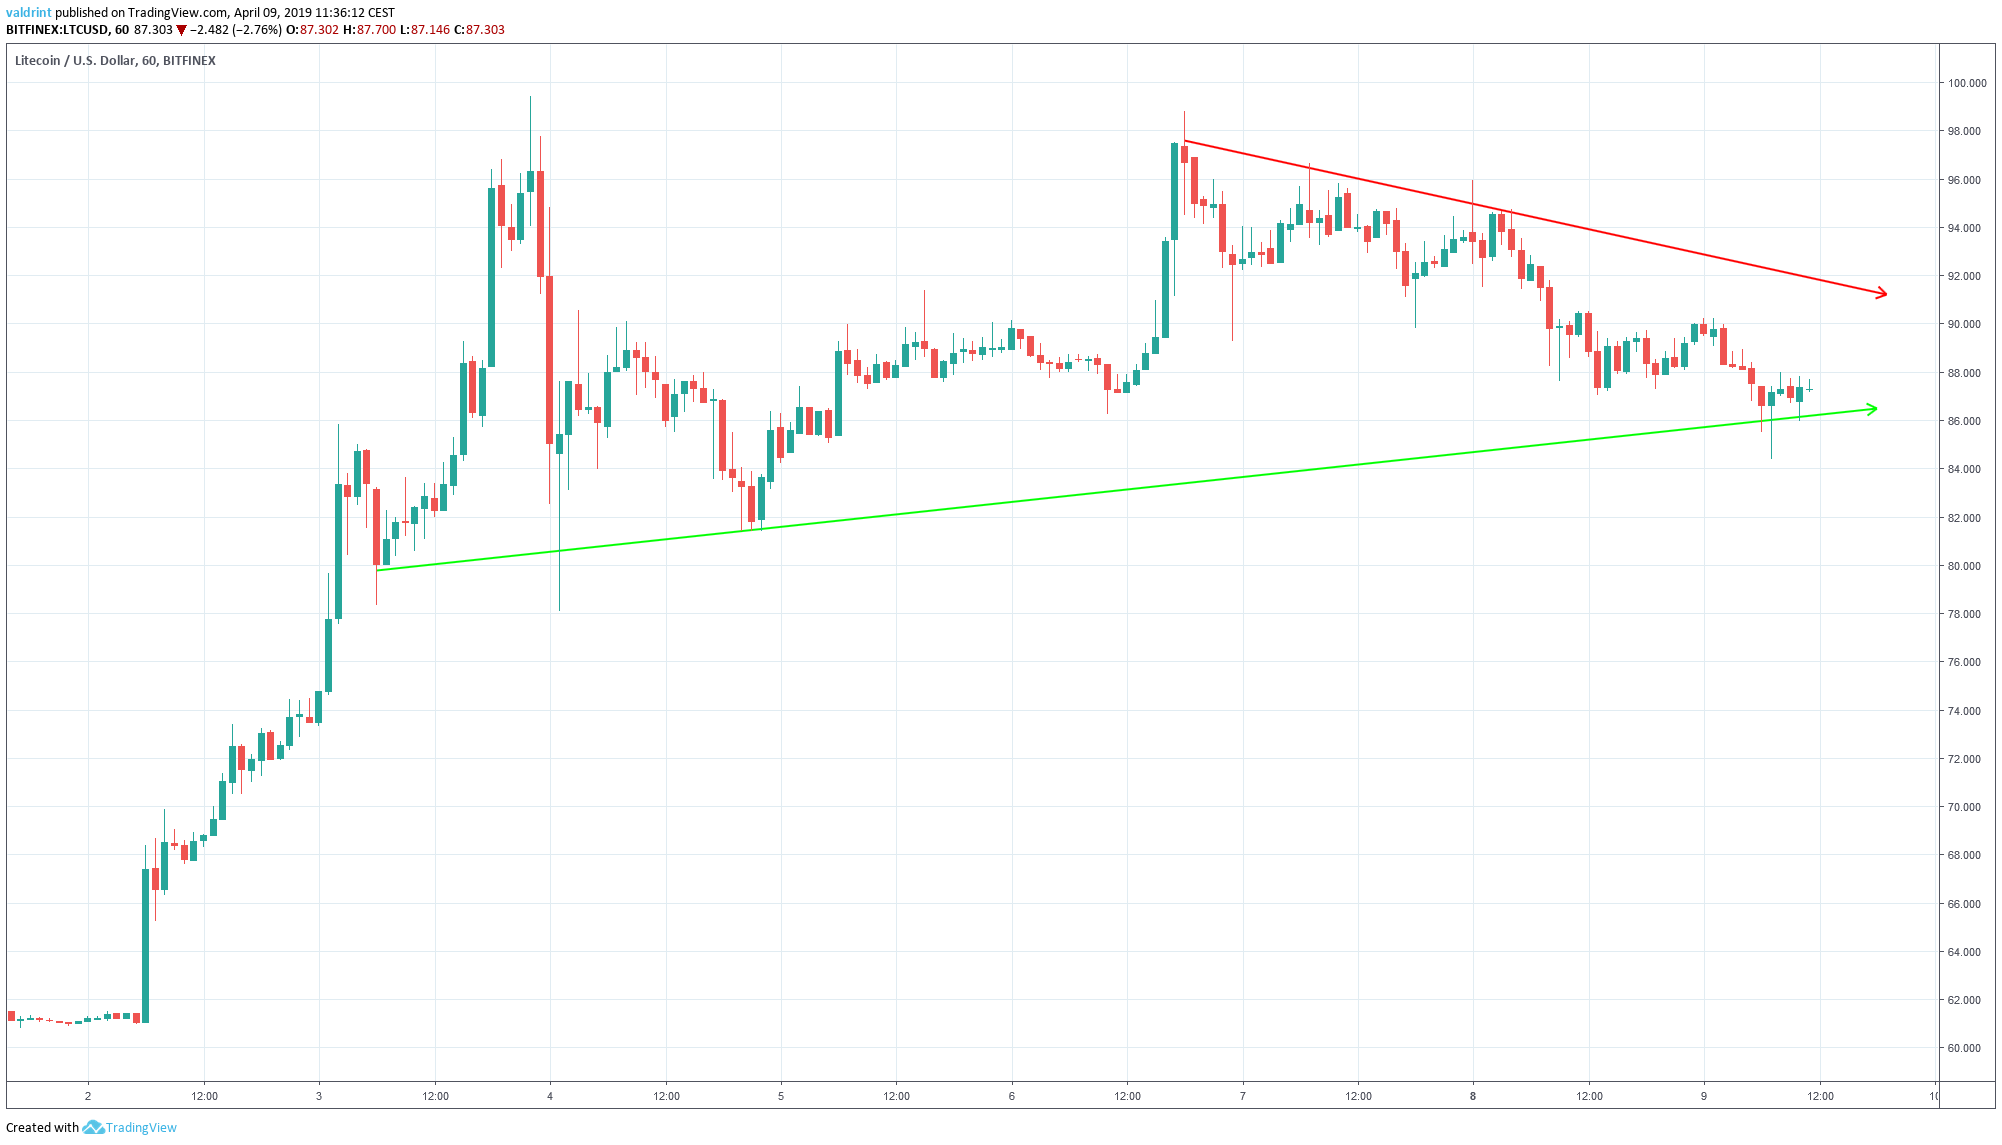 Litecoin has been trading within this pattern and is expected to continue doing so until a decisive upward or downward move occurs.
What will be the direction of this move?
In order to answer that question, we need to take a look at technical indicators.
Litecoin has been trading within this pattern and is expected to continue doing so until a decisive upward or downward move occurs.
What will be the direction of this move?
In order to answer that question, we need to take a look at technical indicators.
Bullish Divergence
To determine future price movements, we incorporate RSI and MACD into our analysis
The relative strength index (RSI) is an indicator which calculates the size of the changes in price in order to determine oversold or overbought conditions in the market.
The moving average convergence divergence (MACD) is a trend indicator that shows the relationship between two moving averages (long and short-term) and the price. It is used to measure the strength of a move.
Combining MACD and RSI bullish/bearish divergence with support/resistance essentially predicts price fluctuations. They are shown in the chart below:
 On Apr 8, the price made an hourly low of $87.0. It made a lower low of $84.2 on Apr 9.
Similarly, the RSI and the MACD made the first low on Apr 8. However, they have proceeded to generate higher values since.
This is known as bullish divergence and often precedes price increases.
Using these indicators, it is likely that the price heads towards the resistance line of the triangle.
On Apr 8, the price made an hourly low of $87.0. It made a lower low of $84.2 on Apr 9.
Similarly, the RSI and the MACD made the first low on Apr 8. However, they have proceeded to generate higher values since.
This is known as bullish divergence and often precedes price increases.
Using these indicators, it is likely that the price heads towards the resistance line of the triangle.
Future Movement
To determine possible future price levels, we incorporate resistance and support areas into this analysis.Resistance and support areas are formed when the price reaches a certain level several times. They can act as a ceiling/floor that prevents the price from moving further in that direction.
These are shown in the chart below:
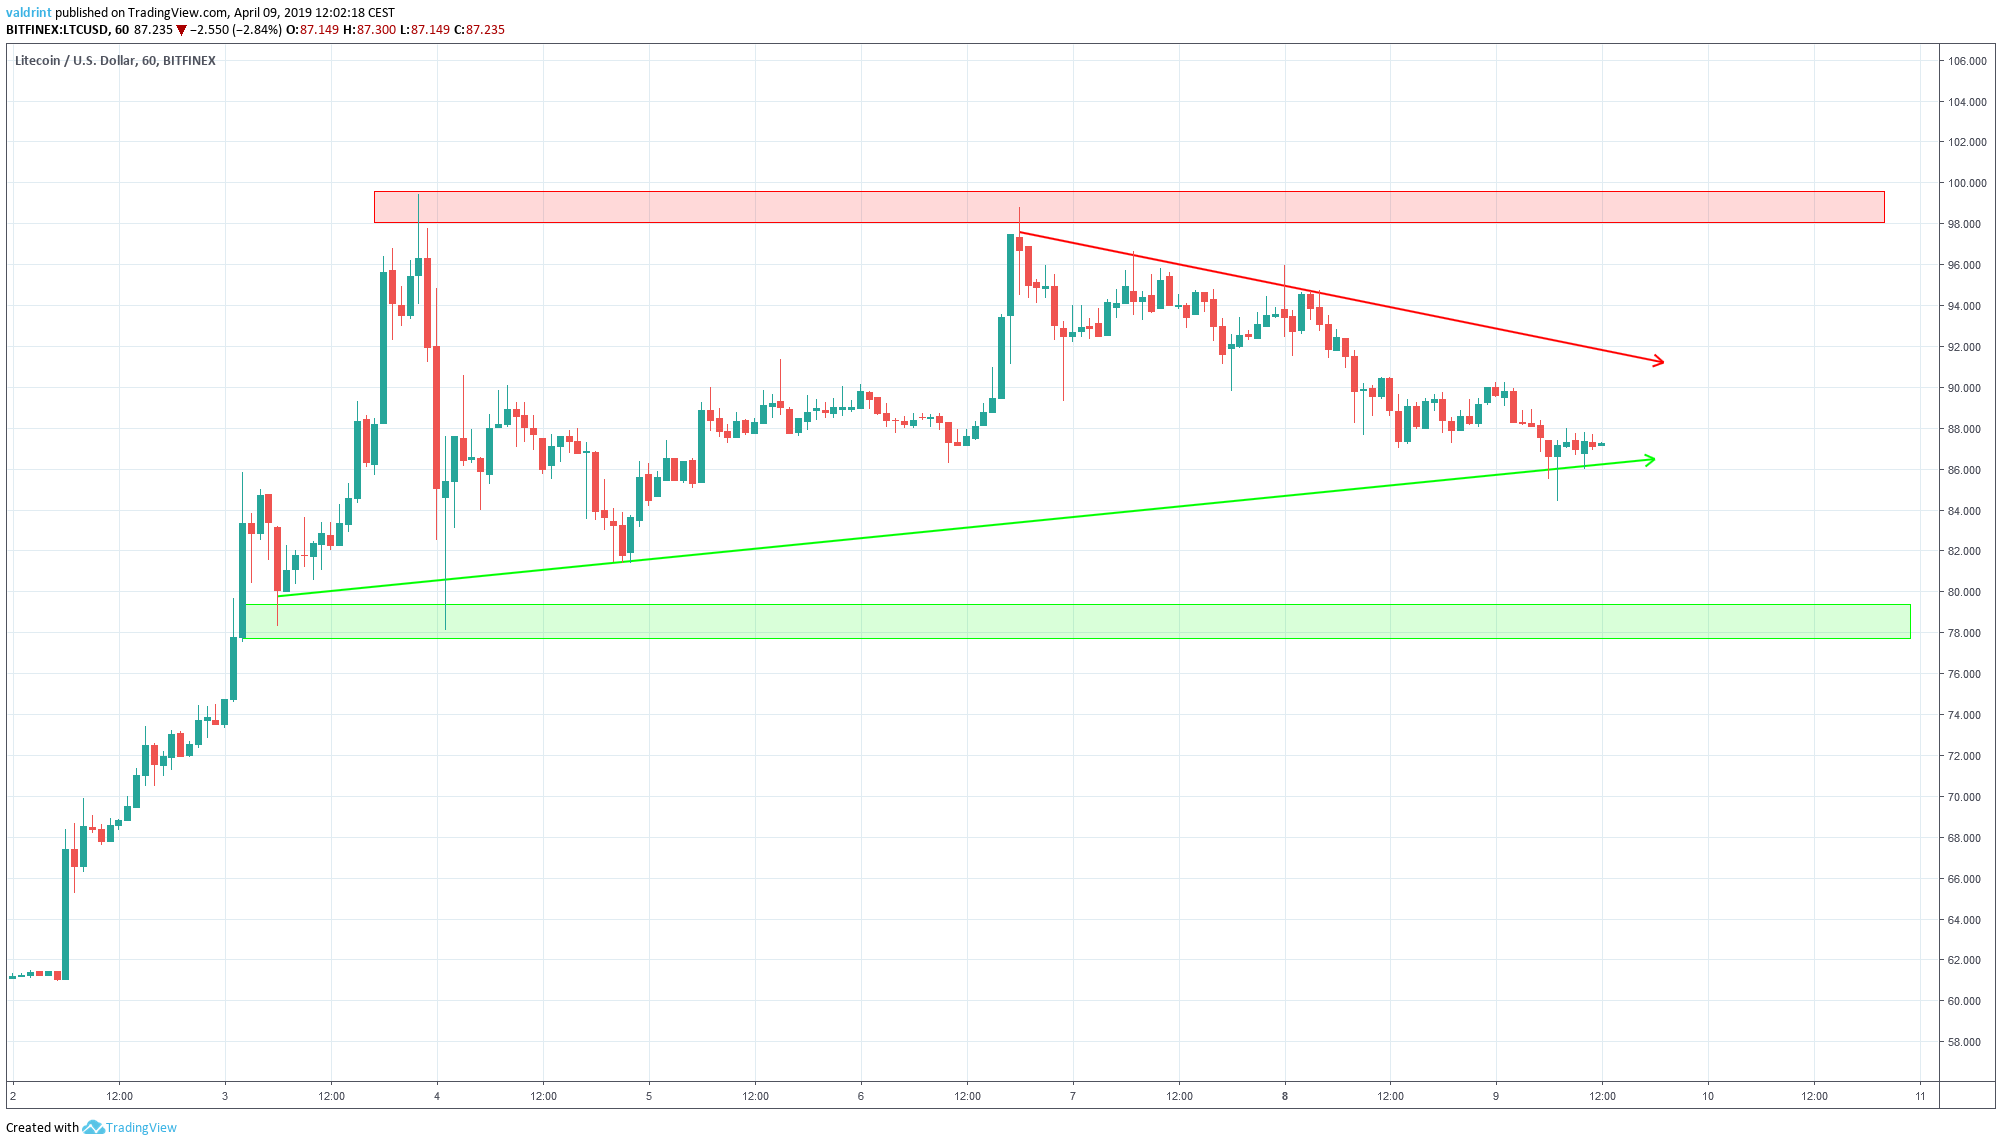 The closest resistance area is found near $98. If the price breaks out of the triangle, it is likely to provide a reversal area. Based on the analysis in our previous section, this scenario is possible.
The closest support area is found near $78. If the price were to break down from the triangle, it would provide a likely reversal area.
However, it is worth mentioning that there is a significant bearish divergence occurring in longer timeframes.
Therefore, we expect a price decrease during the upcoming weeks despite the fact that a breakout from the symmetrical triangle remains likely in the short-term.
The closest resistance area is found near $98. If the price breaks out of the triangle, it is likely to provide a reversal area. Based on the analysis in our previous section, this scenario is possible.
The closest support area is found near $78. If the price were to break down from the triangle, it would provide a likely reversal area.
However, it is worth mentioning that there is a significant bearish divergence occurring in longer timeframes.
Therefore, we expect a price decrease during the upcoming weeks despite the fact that a breakout from the symmetrical triangle remains likely in the short-term.
Summary Of Analysis
Based on this analysis, it is likely that the price keeps trading inside the symmetrical triangle. However, prices are expected to rise, and a breakout may be possible. This could lead to prices of $100; however, price may reach the $98 range a third time before. It is unclear if the next uptrend will bring Litecoin to $100 or not. Do you think the price of LTC will keep increasing? Let us know in the comments below. Disclaimer: This article is not trading advice and should not be construed as such. Always consult a trained financial professional before investing in cryptocurrencies, as the market is particularly volatile.
Top crypto projects in the US | April 2024
Trusted
Disclaimer
In line with the Trust Project guidelines, this price analysis article is for informational purposes only and should not be considered financial or investment advice. BeInCrypto is committed to accurate, unbiased reporting, but market conditions are subject to change without notice. Always conduct your own research and consult with a professional before making any financial decisions. Please note that our Terms and Conditions, Privacy Policy, and Disclaimers have been updated.

Valdrin Tahiri
Valdrin discovered cryptocurrencies while he was getting his MSc in Financial Markets from the Barcelona School of Economics. Shortly after graduating, he began writing for several different cryptocurrency related websites as a freelancer before eventually taking on the role of BeInCrypto's Senior Analyst.
(I do not have a discord and will not contact you first there. Beware of scammers)
READ FULL BIO
Sponsored
Sponsored