
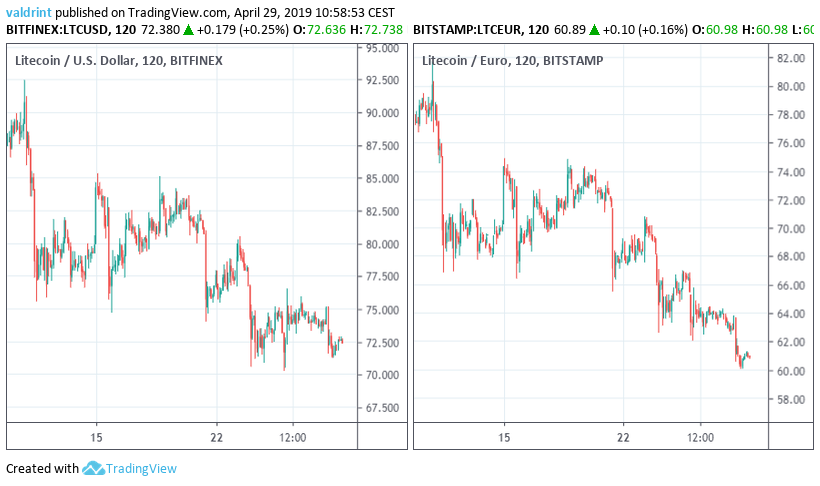
On Apr 11, 2019, the price of Litecoin reached an hourly high of $88.47 and €78.73.
Since then, Litecoin has experienced steady, gradual price losses throughout the month with lows near $70 and €60 reached on Apr 24 and 28 respectively.
Will Litecoin keep decreasing or will a reversal start an uptrend?
Let’s find out:
Litecoin (LTC): Trends And Highlights For April 29, 2019
- Both LTC/USD and LTC/EUR have been on a downtrend since Apr 11.
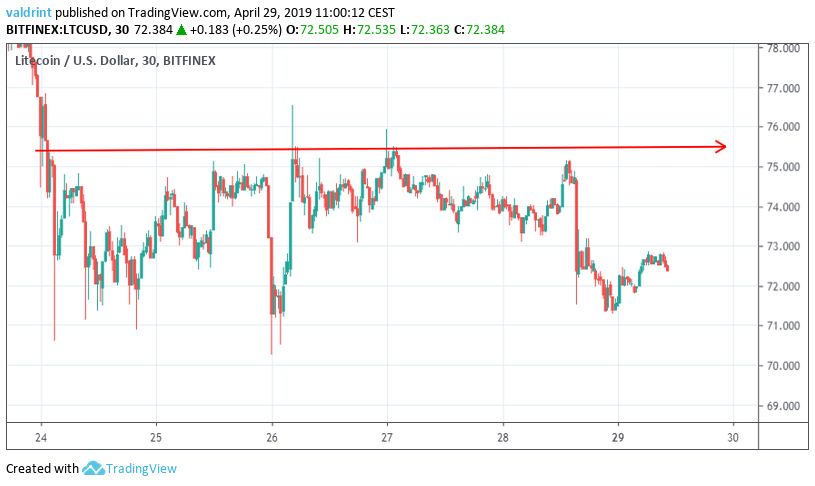
- LTC is trading inside a horizontal channel.
- It is trading inside a long-term descending wedge.
- Bullish divergence is developing in the RSI.
- There is resistance near $83/€74.
Horizontal Channel
On Apr 24, the price reached a high of $75.30. Several market cycles have been completed. The price has reached the same level three times.
Tracing these highs gives us a horizontal resistance line:
On Apr 24, the price reached a low of $70.6. A gradual increase was followed by a gradual decrease. The price has reached the same level several times. Tracing these lows gives us a horizontal support line.
The support and resistance lines combine to create a horizontal channel:
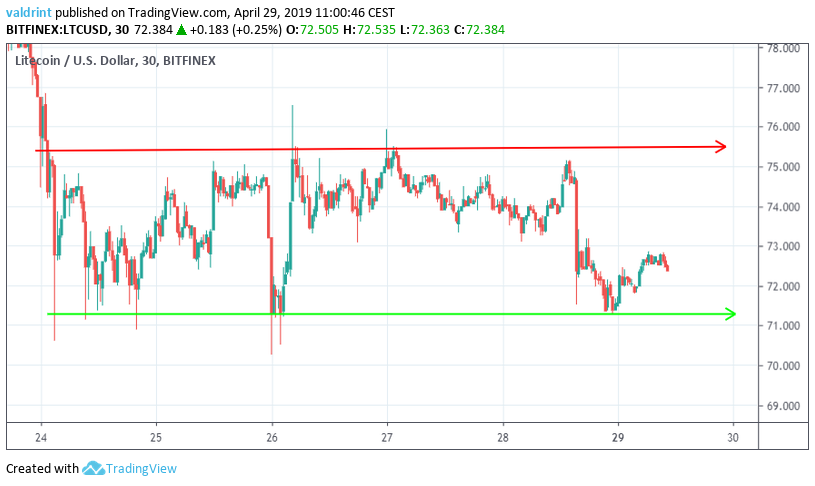
Litecoin is likely to trade inside the confines of the channel until a decisive move occurs. In order to predict the direction of the move, we need to take a look at technical indicators.
Technical Indicators
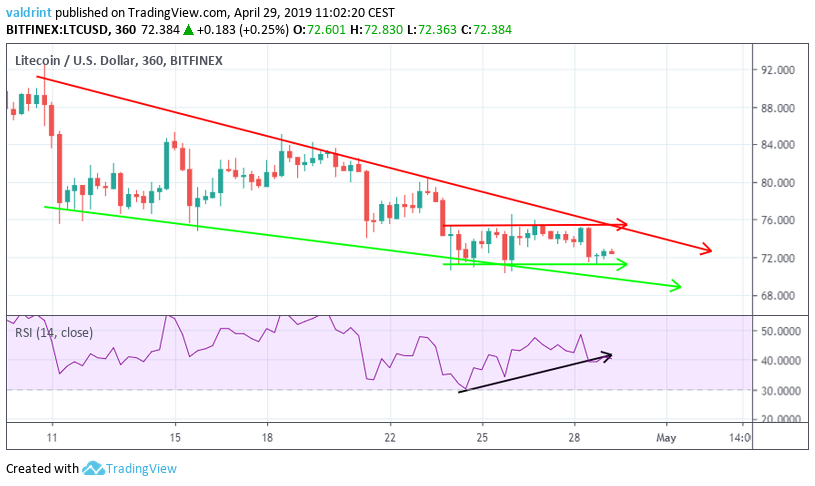
On Apr 24, the price reached a low of $70.60. It reached the same level on Apr 26 and 29.
Similarly, the RSI made the first low on Apr 24. However, it has continued to generate higher values since.
This is known as bullish divergence and often precedes price increases.
The use of this indicator makes it likely that the price will increase towards the resistance line of the wedge. A breakout is possible.
Future Movement
To better determine actual future price levels, we examine resistance areas.
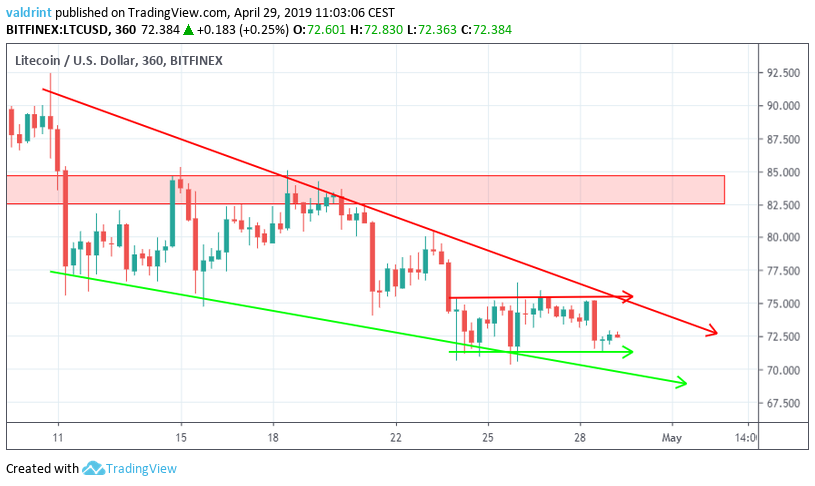
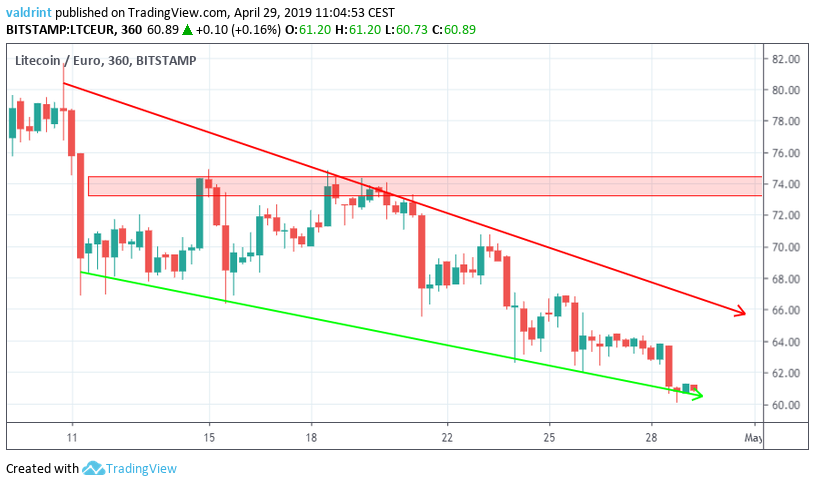
The closest resistance area is found near $83 and €74. If the price of Litecoin were to break out from the current trading pattern, it might reach these levels.
However, price increases in the short-term may not lead to a breakout. Price may move toward the resistance line before falling back toward support.
Summary Of Analysis
Based on this analysis, it is likely that the price will move towards the resistance line of the wedge. An eventual breakout remains possible. If a breakout does occur, the $80 and €70 thresholds.
Do you think the price of LTC will break out from the wedge? Let us know in the comments below.
If you’re interested in 2019 and 2020 price predictions for Litecoin in dollars, click on the green button below
Disclaimer: This article is not trading advice and should not be construed as such. Always consult a trained financial professional before investing in cryptocurrencies, as the market is particularly volatile.
