
Litecoin (LTC) is approaching a crucial resistance at $63. A breakout above this level would signal that the trend is bullish.
There are no signs of weakness yet, and the price is expected to eventually break out.
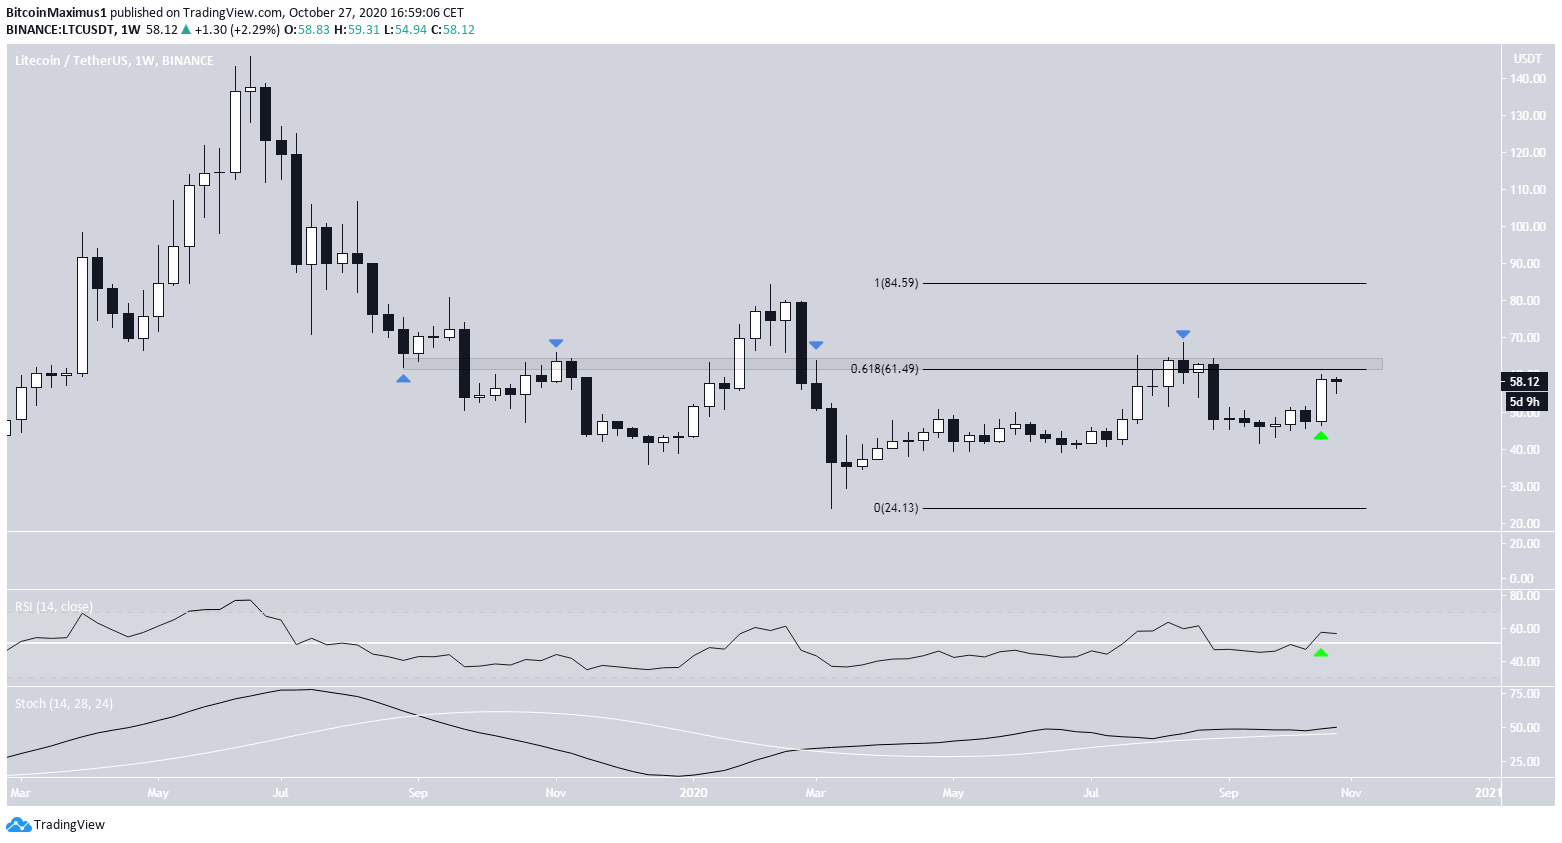
Long-Term Litecoin Resistance Levels
The LTC price is trading very close to a crucial resistance level found at $63. The level has intermittently acted as both support and resistance since September 2019 and is also the 0.618 Fib level of the most recent decrease that began in February 2020.
Despite this, LTC created a bullish engulfing candlestick last week, increasing considerably and almost reached the $63 area. The movement also caused the weekly RSI to cross above 50 and accelerated the slope of the Stochastic Oscillator.
These are bullish signs that indicate that the price is likely to continue heading upwards. If successful in breaking through $63, the next resistance area would be found at $84.50.
Cryptocurrency trader @TheTradingHubb outlined an LTC chart and stated that the price had just reached a crucial resistance level, a breakout above which would be extremely bullish.
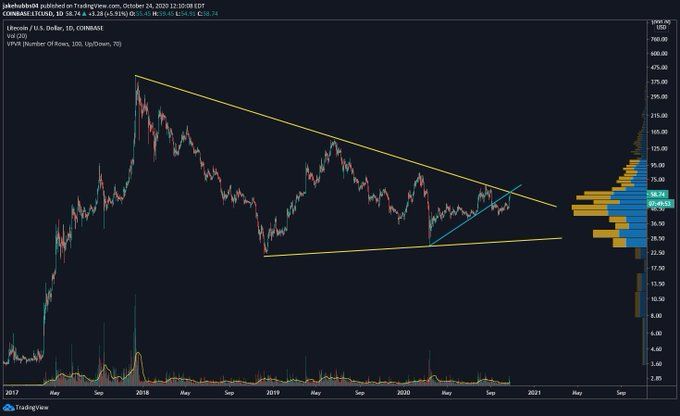
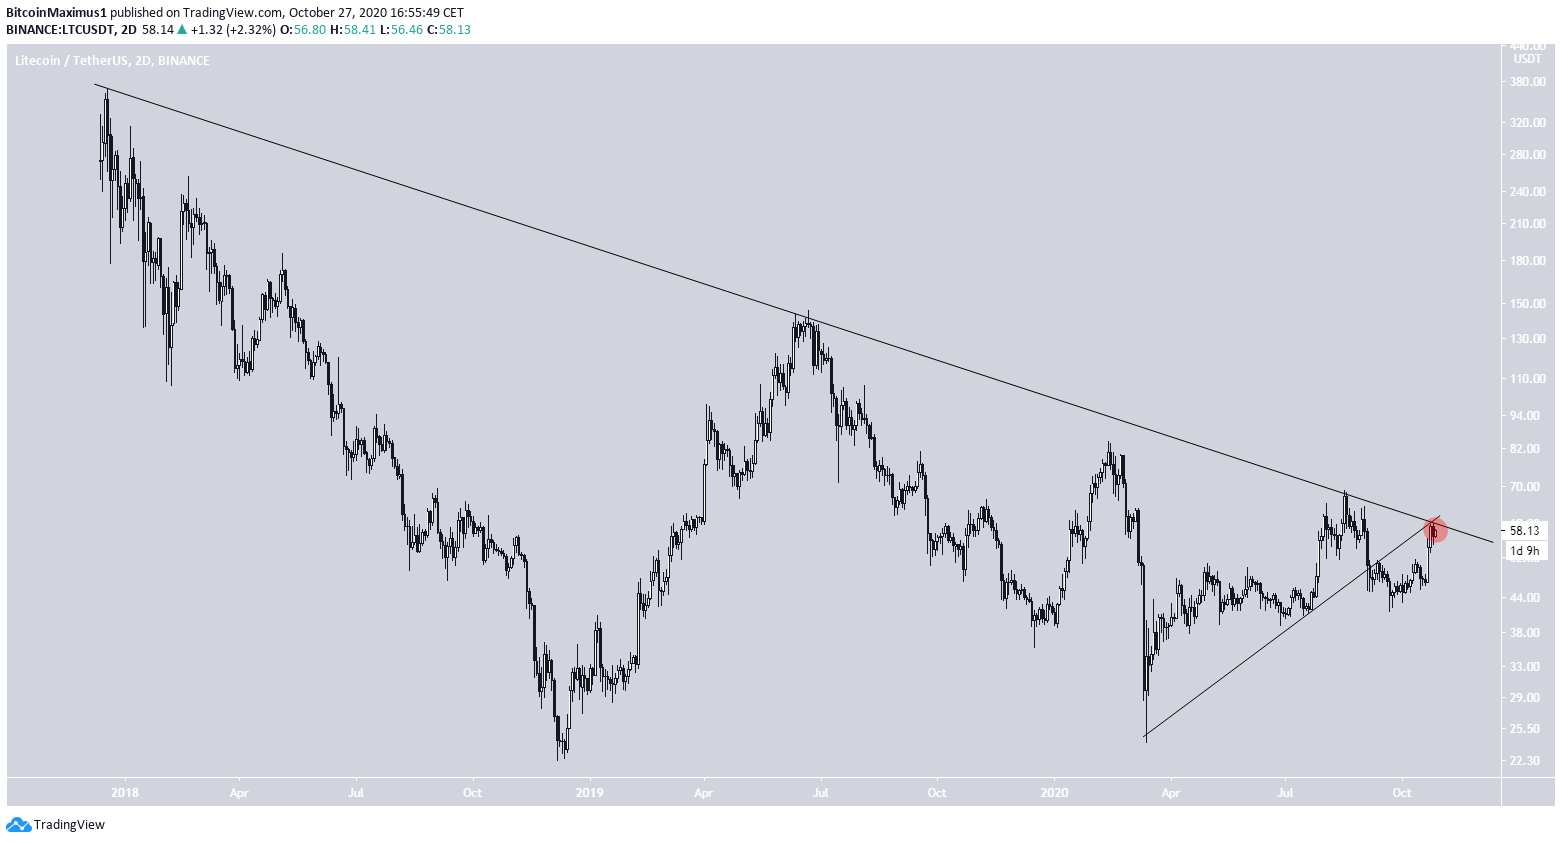
At the time of press, LTC was trading directly under a descending resistance line drawn from the all-time high of $360.
A breakout above this resistance would be a major bullish development, especially since LTC would reclaim previously outlined horizontal levels as well.
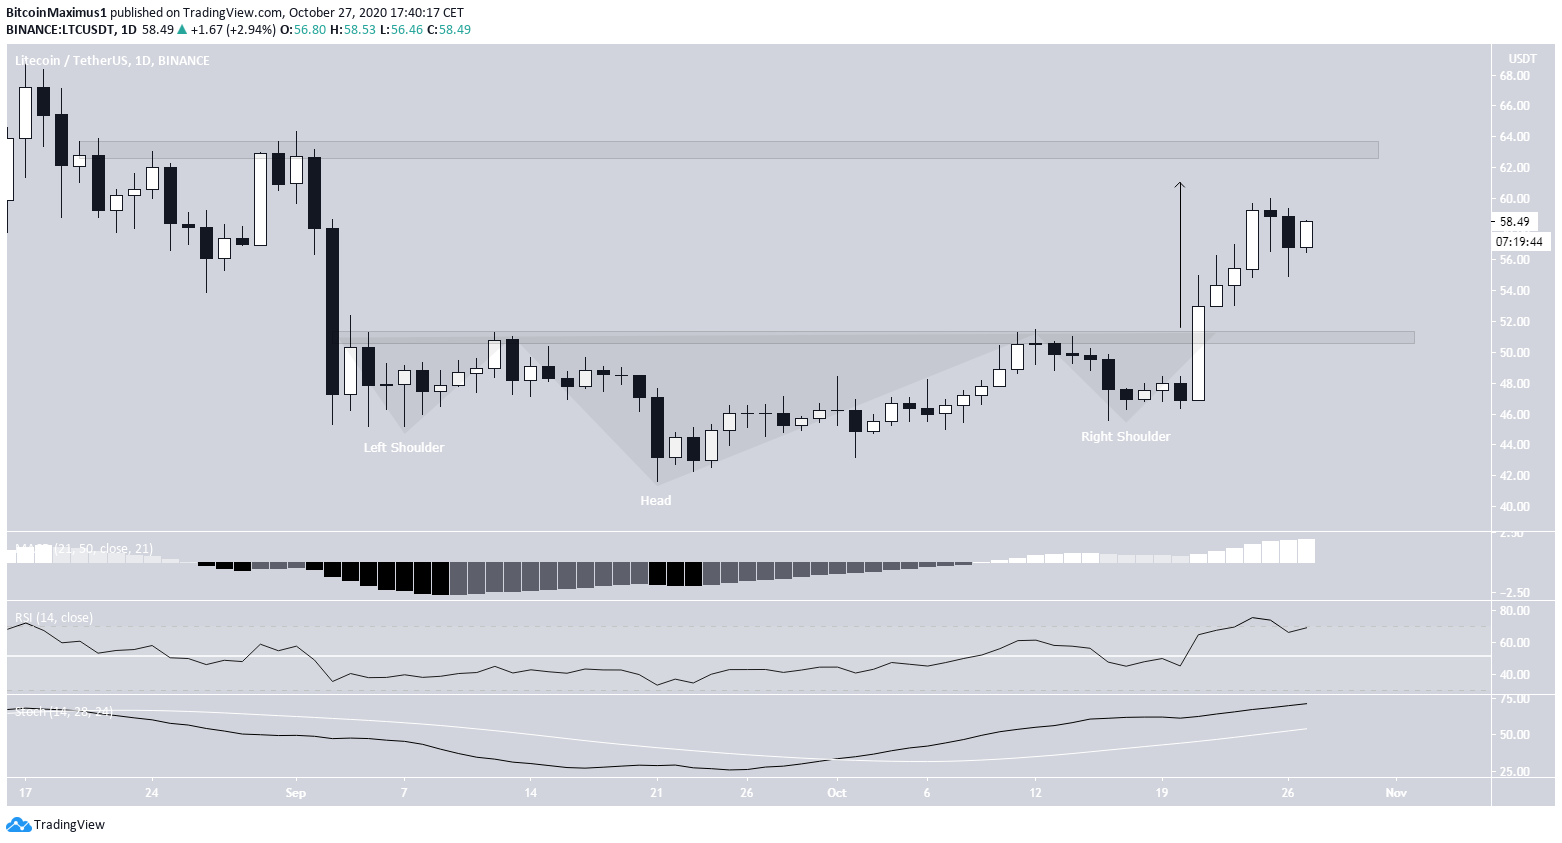
Pattern Breakout
The daily chart provides a bullish outlook. We can see that the price has broken out from an inverse head-and-shoulders (H&S) pattern with a neckline at $51.
LTC has traveled the entire height of the pattern, reaching a local high of $60 on Oct 25. Despite the considerable increase, technical indicators do not yet show any weakness, since the MACD, RSI, and Stochastic Oscillator are all still increasing without generating any bearish divergence.
The $63 area is also shown as a horizontal resistance level, strengthening its significance. The breakout level at $51 is now expected to act as support.
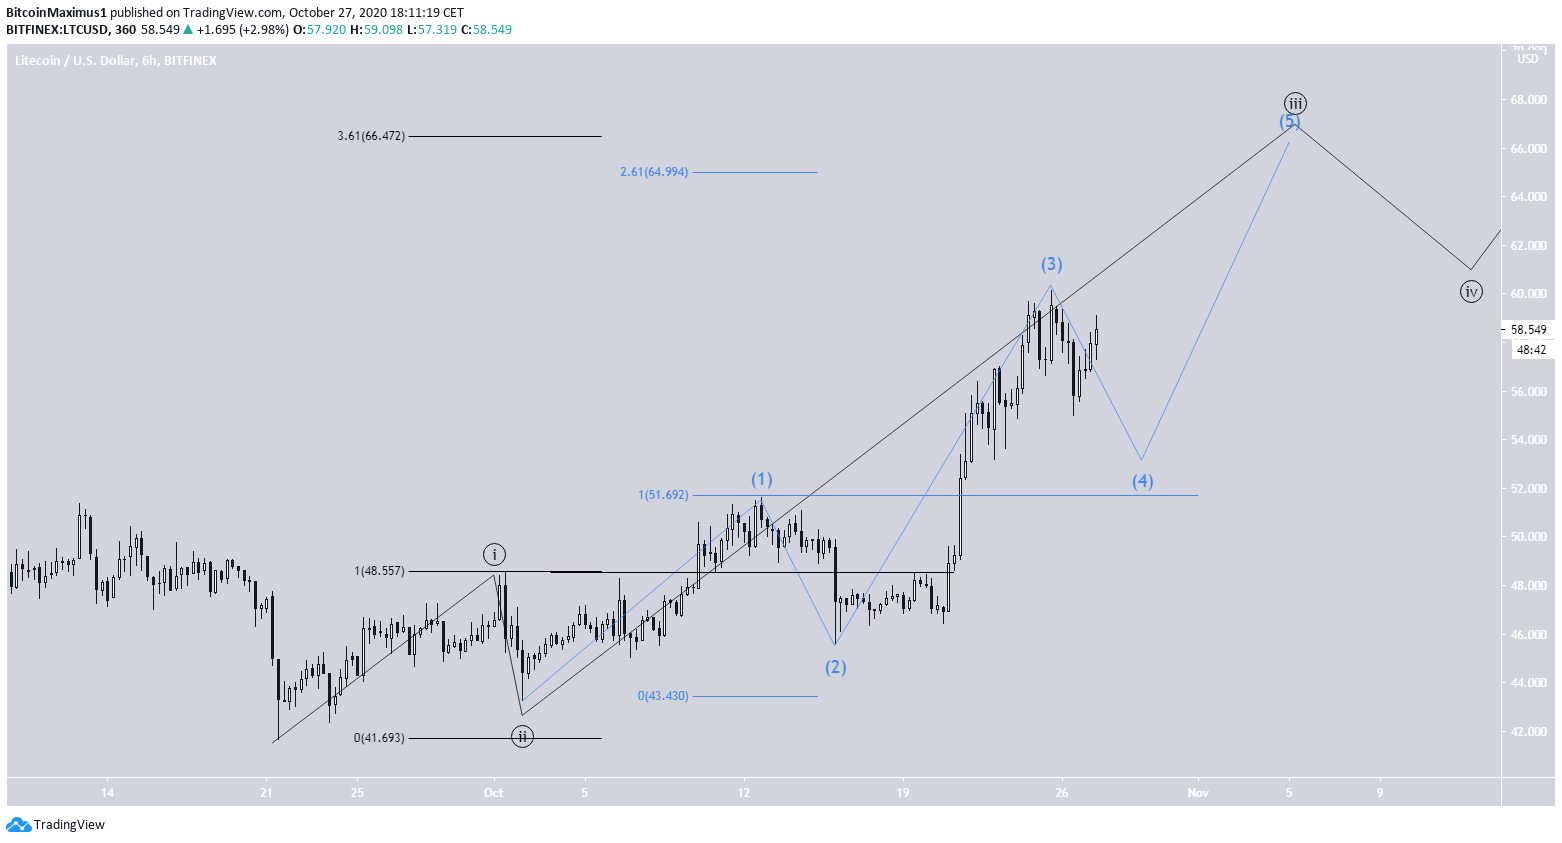
Wave Count
While the long-term count is not entirely clear, it seems that LTC has begun a bullish impulse (shown in black below) after reaching a low on Sept 23. If this is true, LTC is currently in the third wave, which has become extended and has a target of $66.472 (3.61 Fib extensions of wave 1).
A decrease below the wave 1 high (black line) at $48.57 would invalidate this particular count.
The sub-wave count for the extended third wave is shown in blue. LTC looks to either be in or has just completed sub-wave 4. The target for the top of sub-wave 3 ($64.90) coincides with the longer-term wave count, increasing the possibility that it will be reached.
A decrease below the sub-wave 1 high at $51.69 (blue line) would invalidate the sub-wave count, but the longer-term (black) count would still be intact.
To conclude, it is likely that LTC has begun a bullish impulse and will increase towards the resistance levels outlined above.
For BeInCrypto’s latest Bitcoin analysis, click here!
Disclaimer: Cryptocurrency trading carries a high level of risk and may not be suitable for all investors. The views expressed in this article do not reflect those of BeInCrypto.
