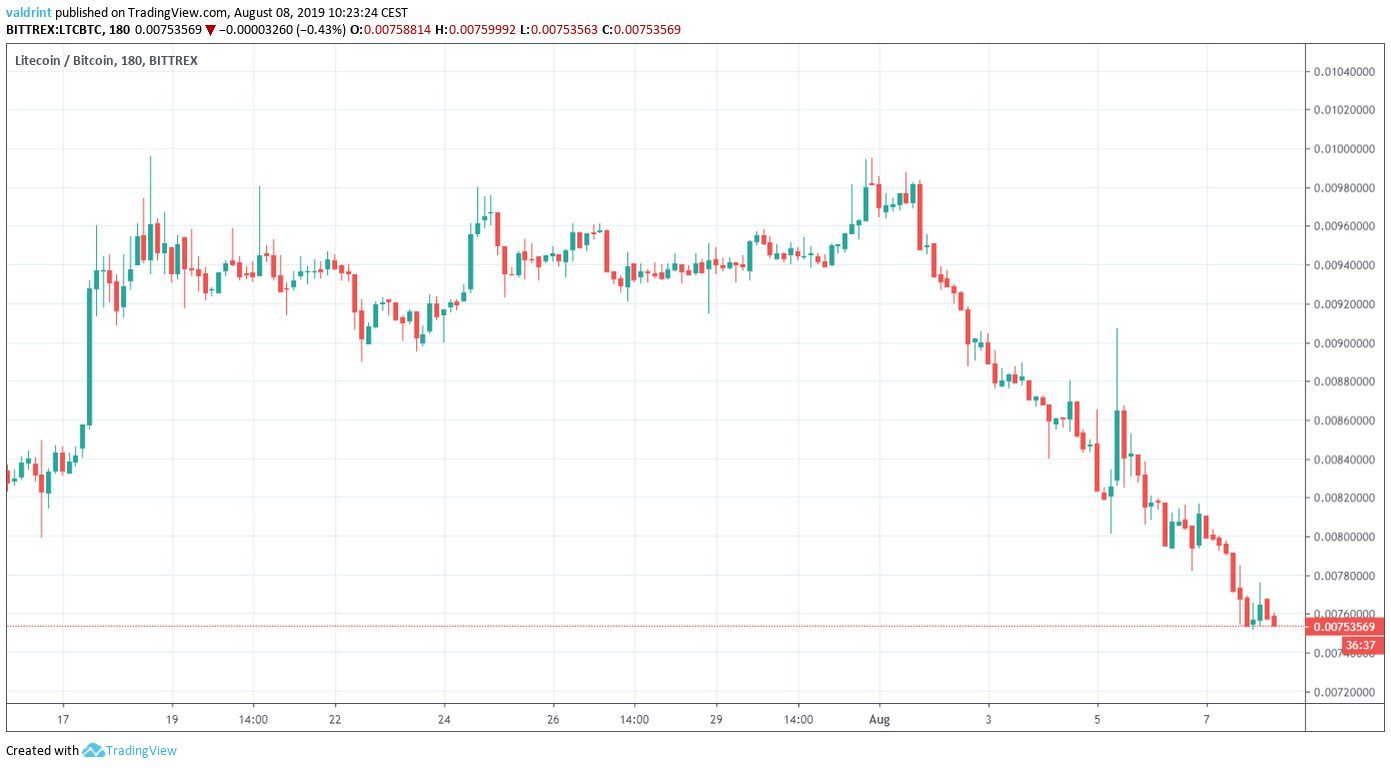
On July 16, 2019, the Litecoin price reached a low of ₿0.0079. It began an upward move and traded close to ₿0.01 until the beginning of August. Since then, it has been decreasing, reaching lows close to ₿0.007.
How long will this decrease continue? In order to answer this question, we are going to analyze the Litecoin price in different time-frames alongside technical indicators.
For our previous analysis, click here.
Want to trade cryptocurrencies like Litecoin quickly and securely? Sign up for a free account with our partner exchange, KuCoin to do so!
Litecoin Price: Trends and Highlights for August 8
- LTC/BTC broke down from an ascending triangle.
- It is following a descending support line.
- There is support at ₿0.007.
- Moving averages and the RSI provide a bearish sentiment.
Previous Movement
A look at the three-hour time-frame shows that the price has been trading inside an ascending triangle.
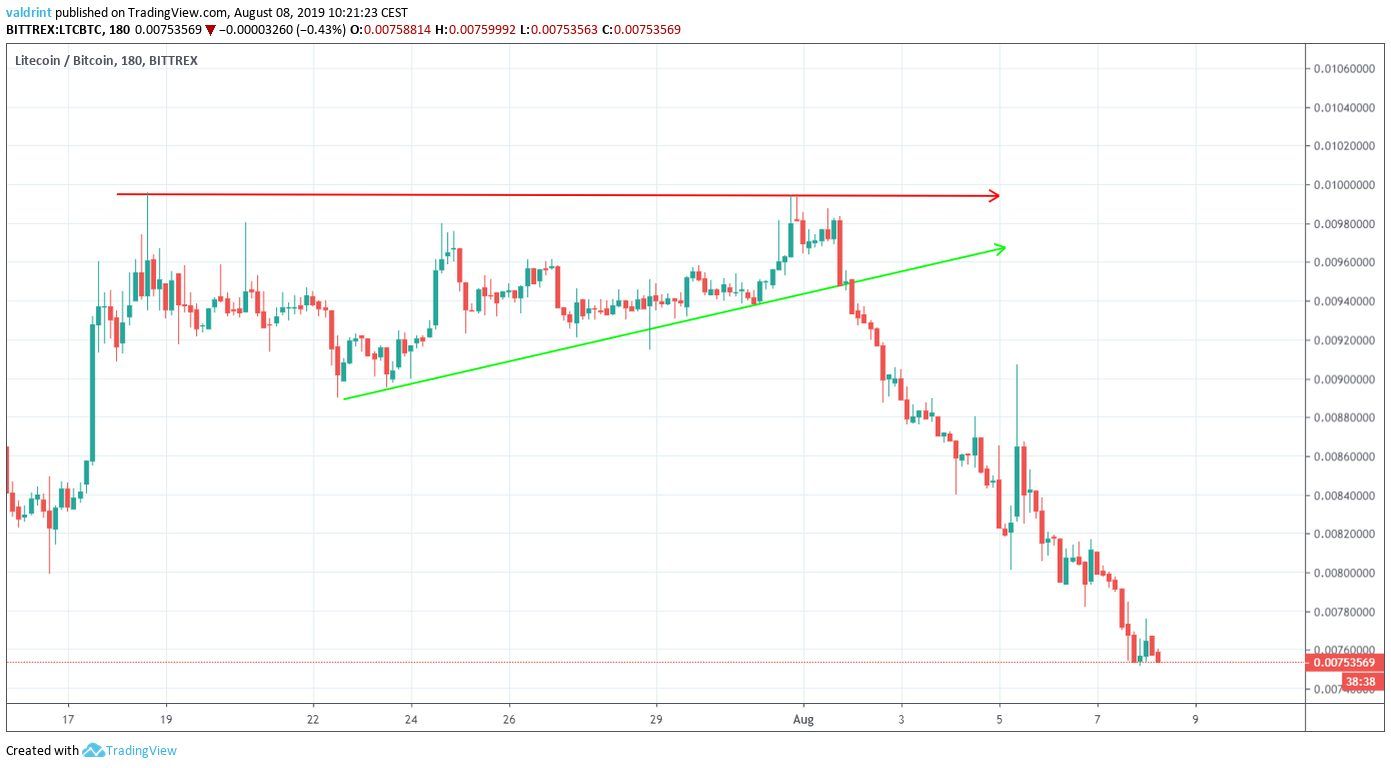
On August 1, the Litecoin price broke down from this channel.
It has been decreasing since.
Let’s take a look at a longer-term time-frame to try and predict where it is going to go next.
Descending Support Line
A look at the daily time-frame shows us that:
- LTC has been following a descending support line since May 13.
- There is a support area at ₿0.007.
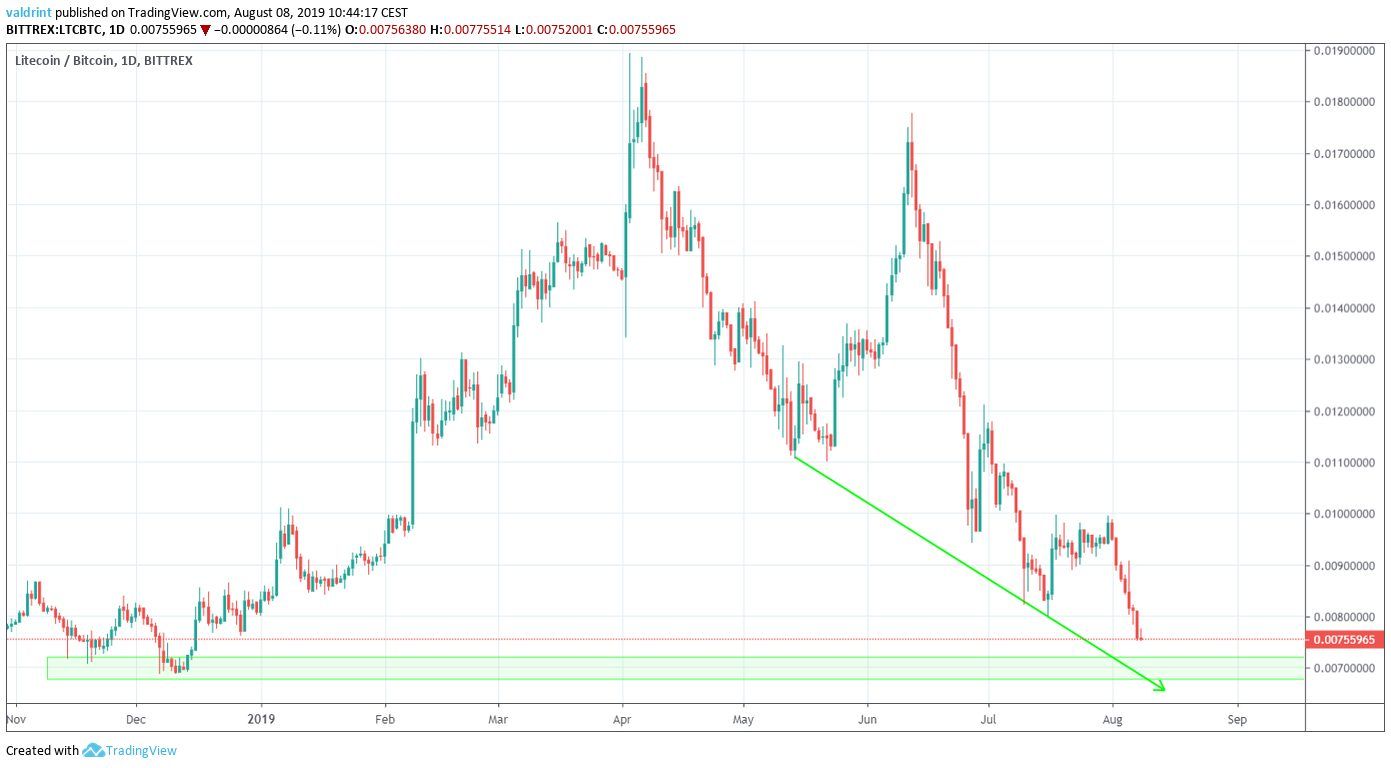
Due to the fact that the support line coincides with the support area and the price is trading above both, the first impression is that the Litecoin price will decrease until it reaches it.
A similar sentiment is given by an analysis of moving averages (MA):
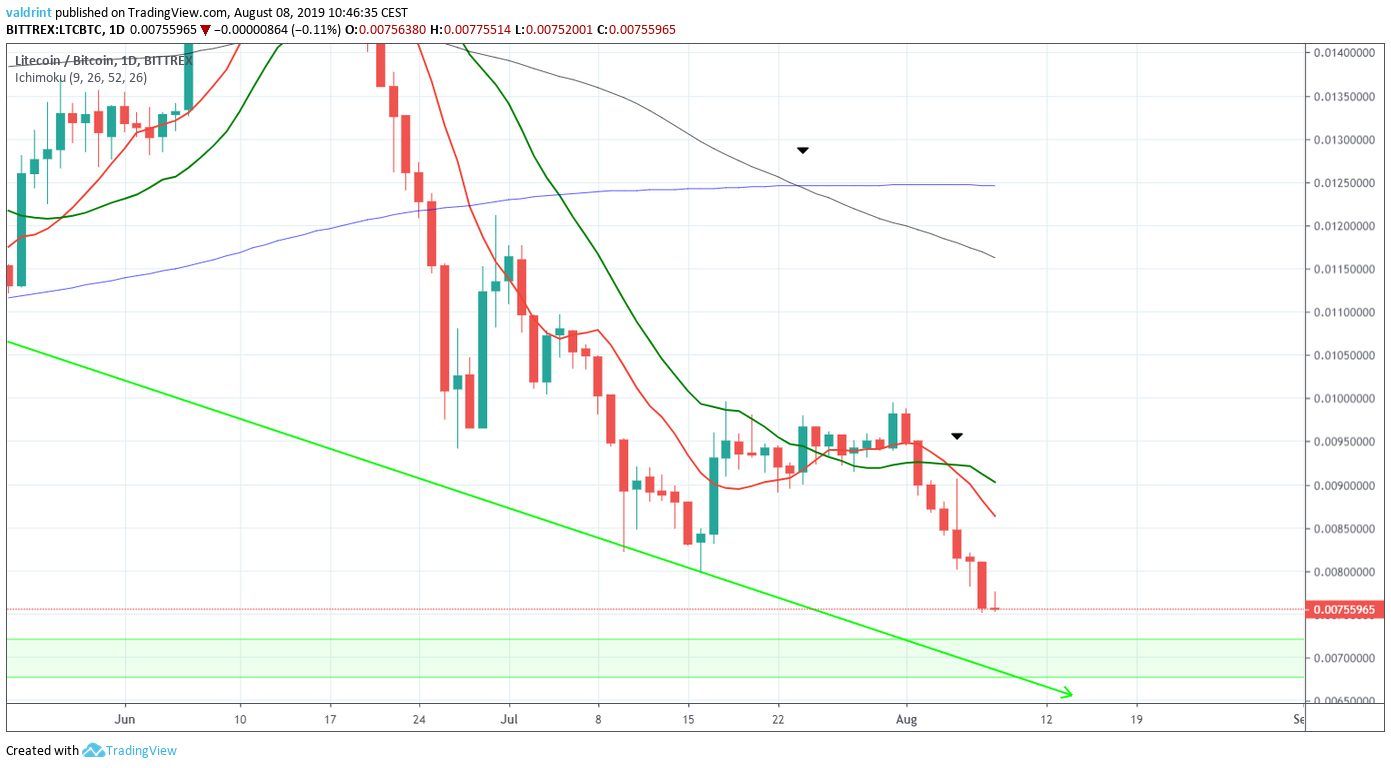
Both a long- (100- and 200-period MAs) and a short-term (10- and 20-period MAs) bearish cross has occurred.
This is often an indication that the price is in a downtrend.
The RSI does nothing to refute this scenario:
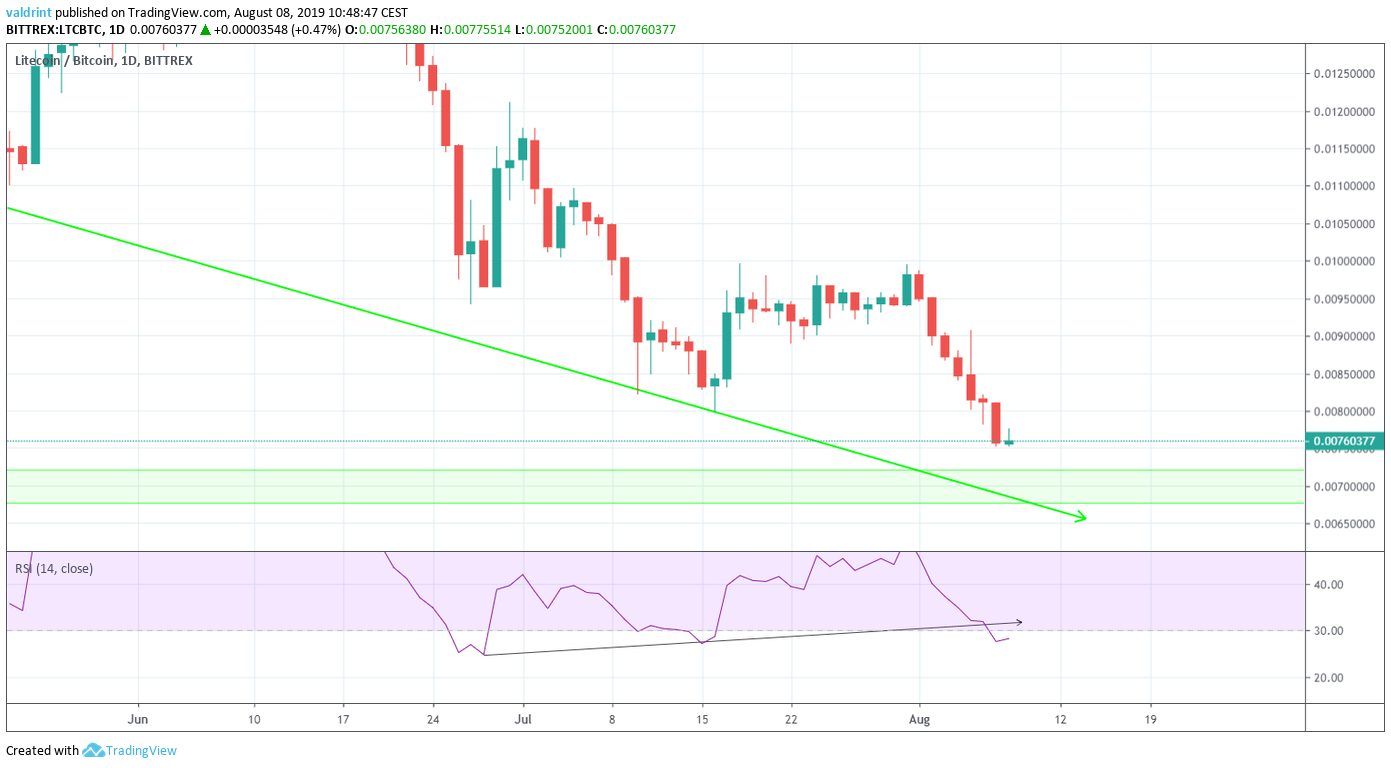
While it has been generating bullish divergence during the successive lower lows in price, the recent decrease broke the upward sloping trend line.
The combination of these indicators suggests that the Litecoin price will continue to increase until it reaches the support area.
Target
Using the Fibonacci retracement tool can give us a more accurate target.
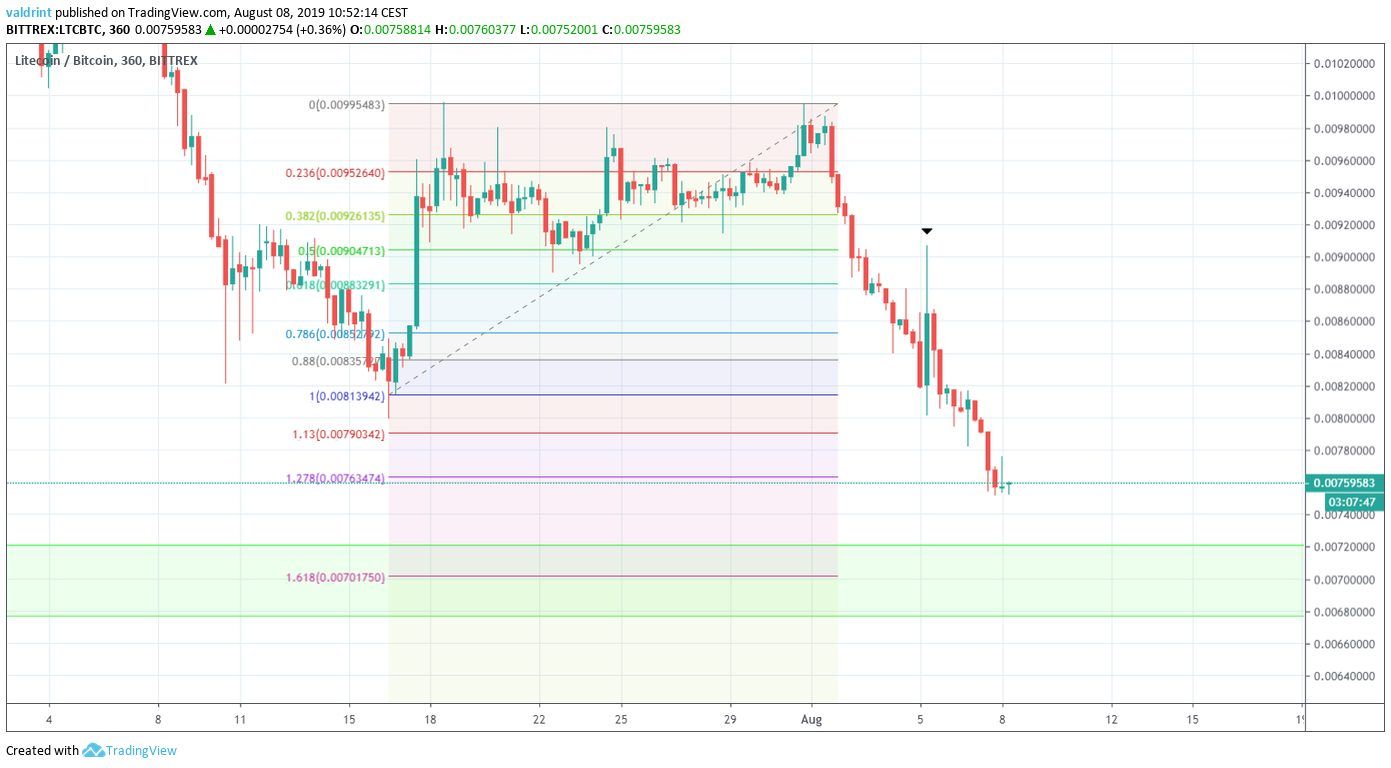
The 1.618 fib level is right in the middle of our support area at ₿0.007.
Additionally, we can see the Litecoin price made an unsuccessful attempt at initiating a reversal on August 5.
The rapid decrease succeeding it indicates that there is selling pressure.
Litecoin Price Summary
The Litecoin price is following a descending support line.
According to our analysis, it is likely to continue decreasing at the rate predicted by the line until it reaches the support area outlined below.
Do you think Litecoin will reach the support area? Let us know your thoughts in the comments below.
Disclaimer: This article is not trading advice and should not be construed as such. Always consult a trained financial professional before investing in cryptocurrencies, as the market is particularly volatile.
Images are courtesy of TradingView, Shutterstock.
Looking to trade cryptocurrencies like Litecoin with up to a 100x multiplier? Sign up for our partner exchange, StormGain, to do so.