

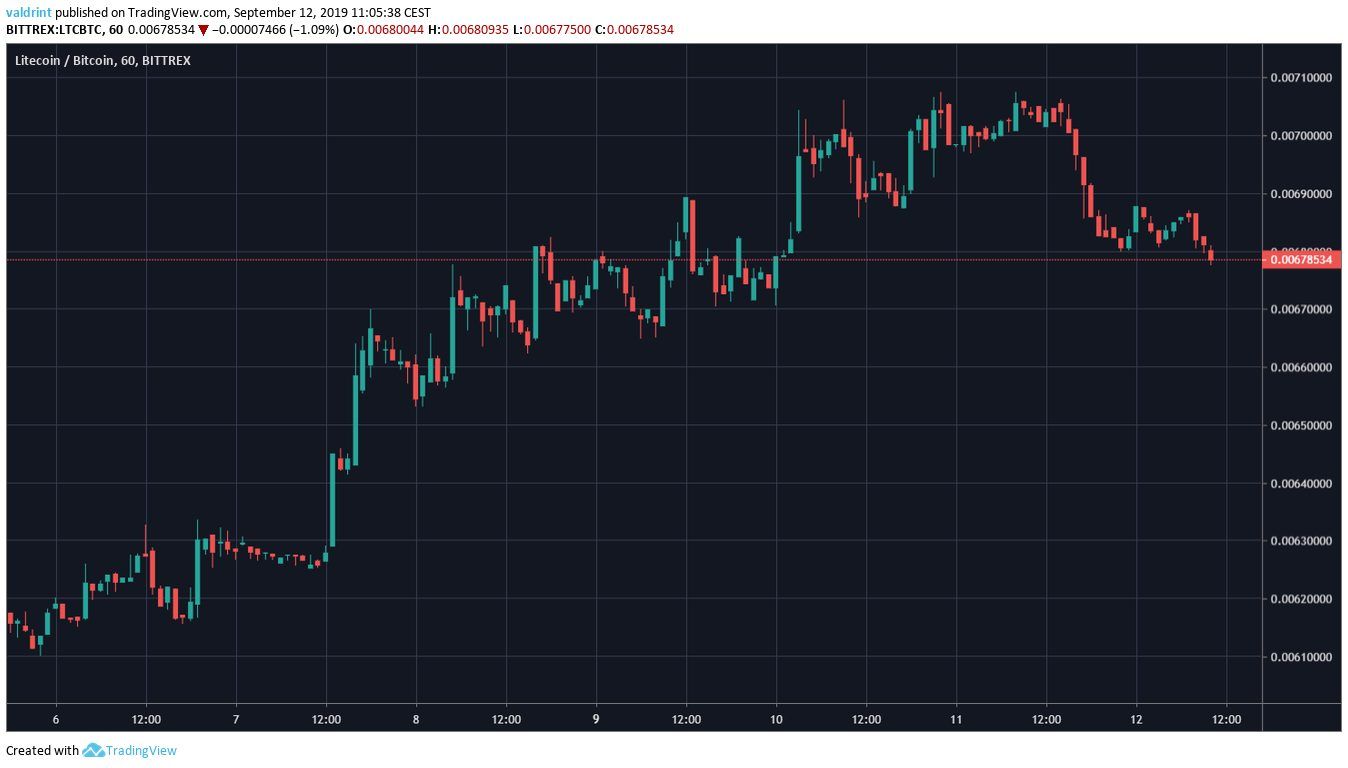
On September 5, 2019, the Litecoin price reached a low of ₿0.0061. A gradual upward move followed, which culminated with a high of ₿0.0070 on September 11. Since then, LTC has been decreasing.

How long will the Litecoin price continue to decrease? Keep reading below if you are interested in finding out.
For our previous analysis, click here.
Litecoin Price: Trends and Highlights for September 12
- LTC/BTC is following a descending support line.
- There is long-term support at ₿0.0070, ₿0.0054 and ₿0.0030.
- LTC is possibly following a bearish fractal.
- It previously broke down from a descending triangle.
- There is short-term support at ₿0.0066 and ₿0.0064.
Long-Term Litecoin Price Support
A look at the weekly chart gives us three major support areas. They are found at:- ₿0.0070
- ₿0.0054
- ₿0.0030
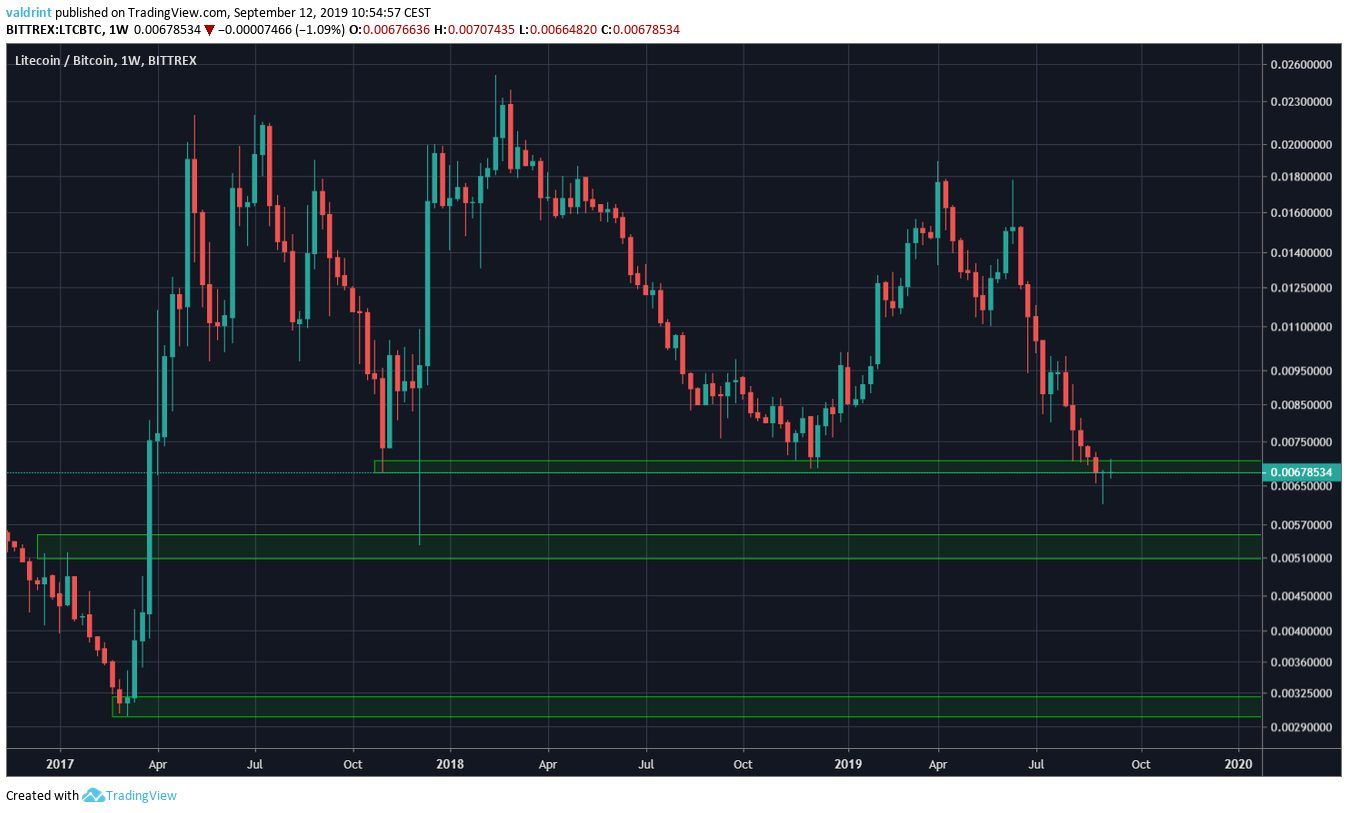 The LTC price briefly decreased below the first one, before again moving inside it.
It is not yet clear if this area will act as resistance.
The price is currently at its lowest levels since December 2017.
The LTC price briefly decreased below the first one, before again moving inside it.
It is not yet clear if this area will act as resistance.
The price is currently at its lowest levels since December 2017.
Descending Support
A look at the daily chart shows that the Litecoin price has been following a descending support line since July 8.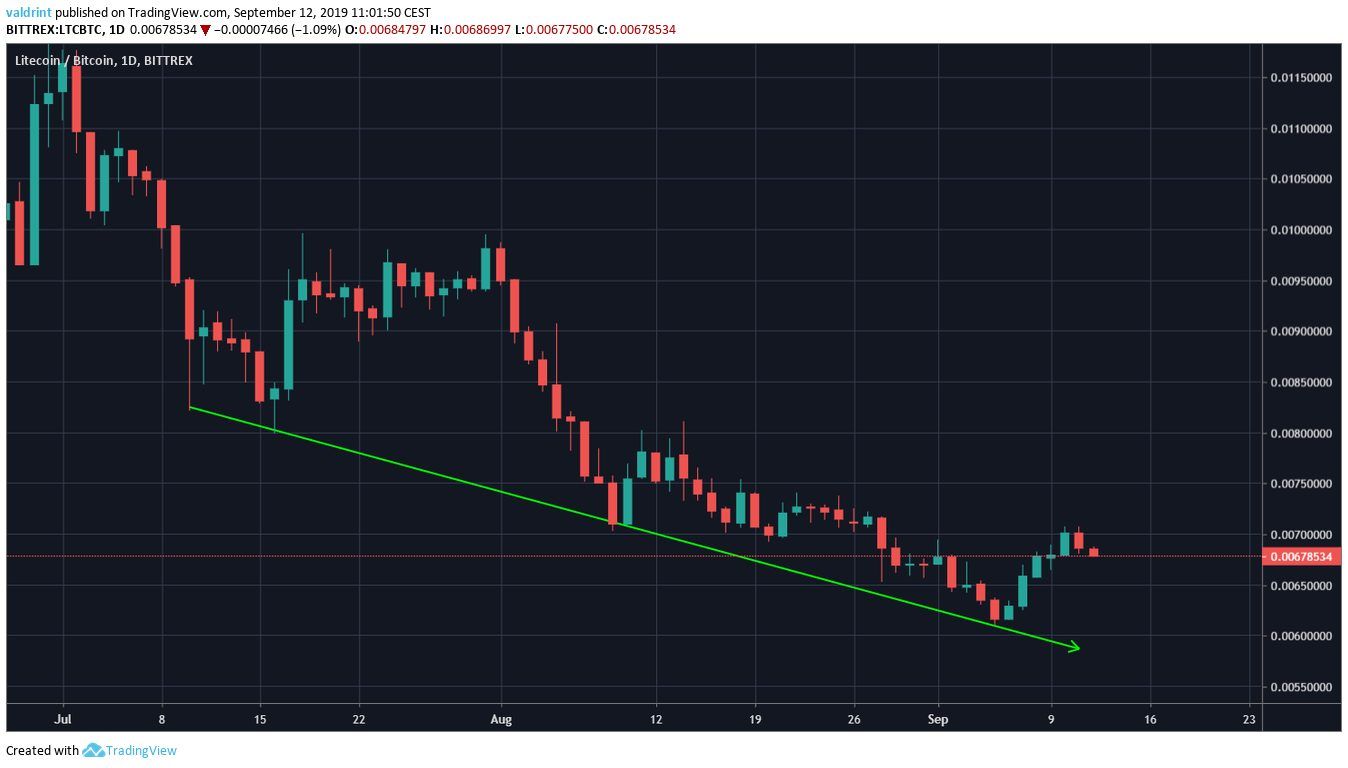 The line has been validated four times — most recently on September 6, when the current upward move discussed in the introduction was initiated.
Will Price History Repeat Itself?
In order to determine where the price might go next, we will incorporate daily moving averages (MA) and the MACD into the analysis.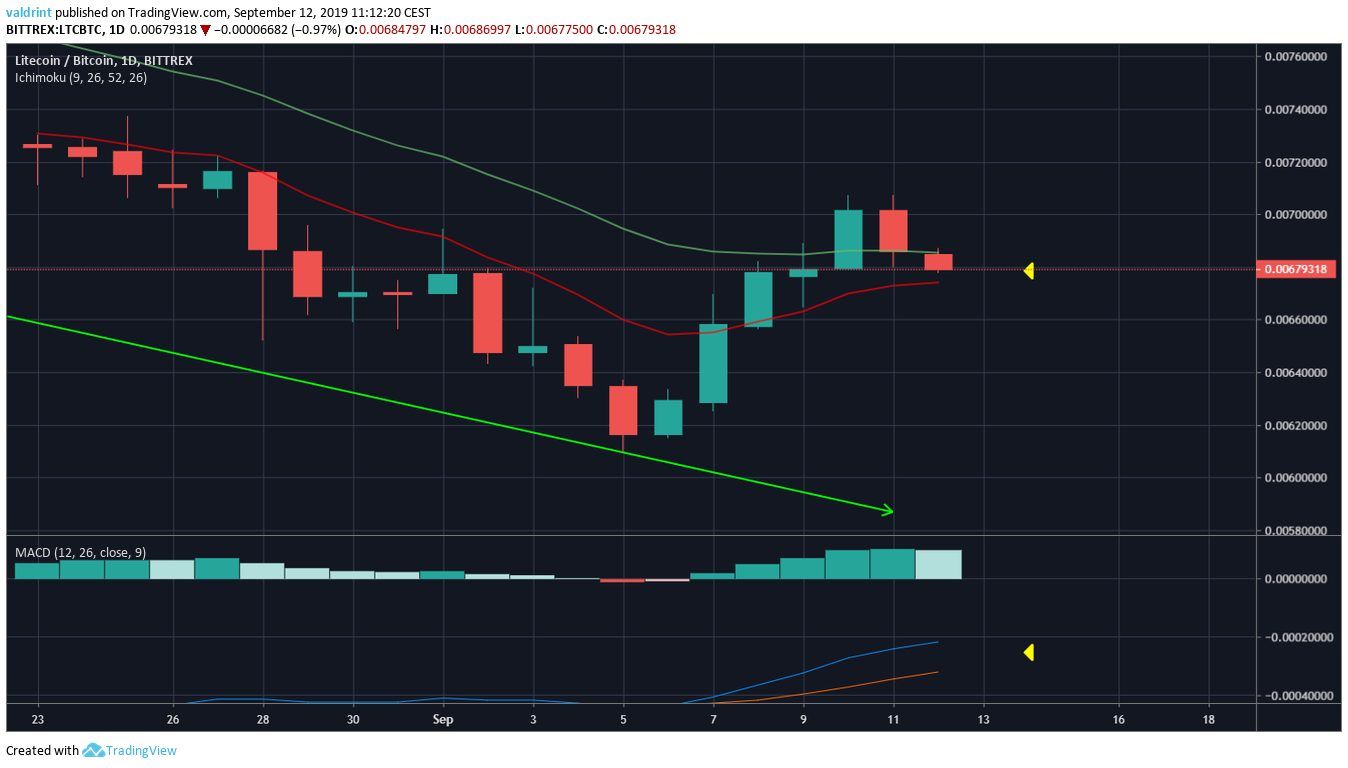 The Litecoin price is trading between the 10- and 20-day MAs, which are very close to making a bullish cross.
Additionally, the MACD has almost crossed into positive territory.
Both of these are bullish signs and, if they were to occur, would likely confirm the uptrend.
However, the price acted in a very similar manner, previously, before a significant decrease ensued.
The Litecoin price is trading between the 10- and 20-day MAs, which are very close to making a bullish cross.
Additionally, the MACD has almost crossed into positive territory.
Both of these are bullish signs and, if they were to occur, would likely confirm the uptrend.
However, the price acted in a very similar manner, previously, before a significant decrease ensued.
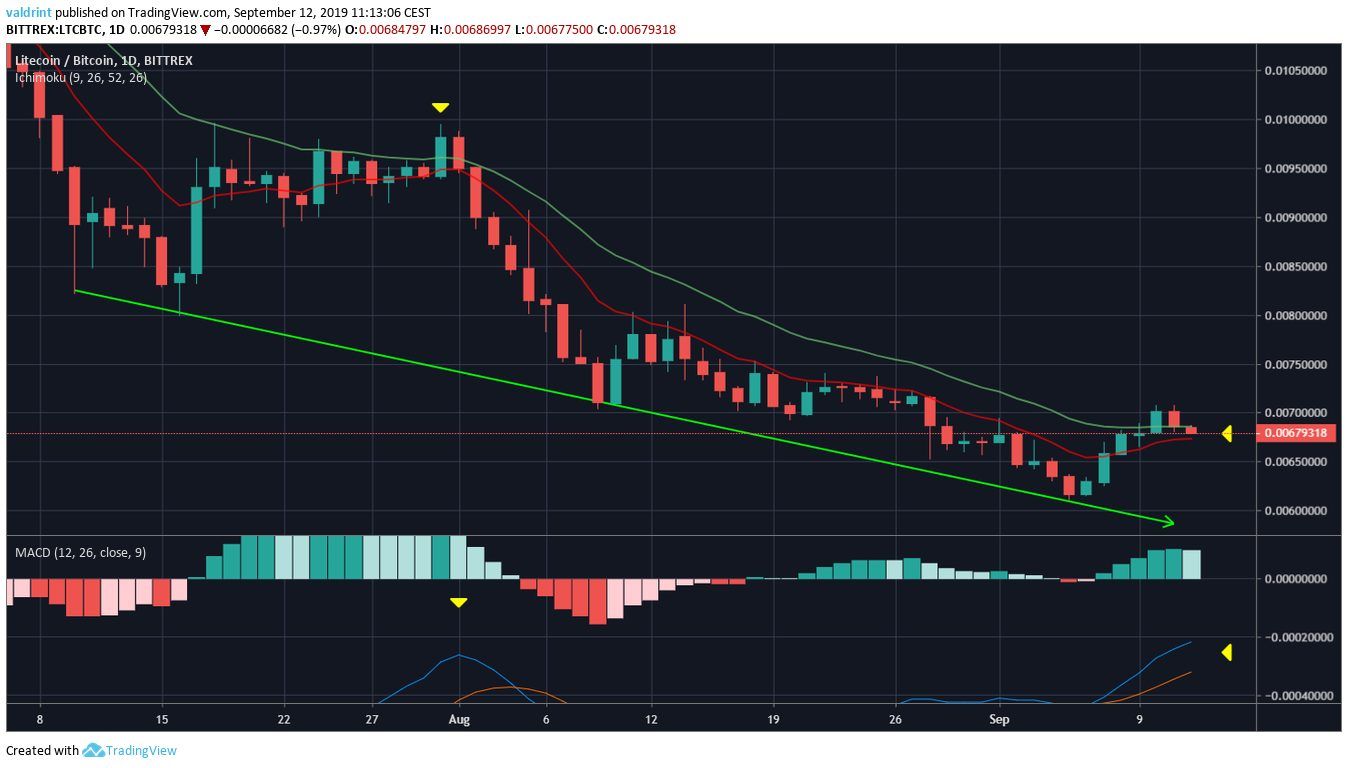 On August 1, the LTC price moved above its 10- and 20-day MAs — which were very close to making a bullish cross.
Additionally, the MACD was at the same level it currently is.
What followed was a bearish cross rejection and significant price decrease.
If the Litecoin price acts in a similar manner, a downtrend awaits.
On August 1, the LTC price moved above its 10- and 20-day MAs — which were very close to making a bullish cross.
Additionally, the MACD was at the same level it currently is.
What followed was a bearish cross rejection and significant price decrease.
If the Litecoin price acts in a similar manner, a downtrend awaits.
Descending Triangle Breakdown
Looking at the six-hour chart, we can see that LTC previously broke down from a descending triangle.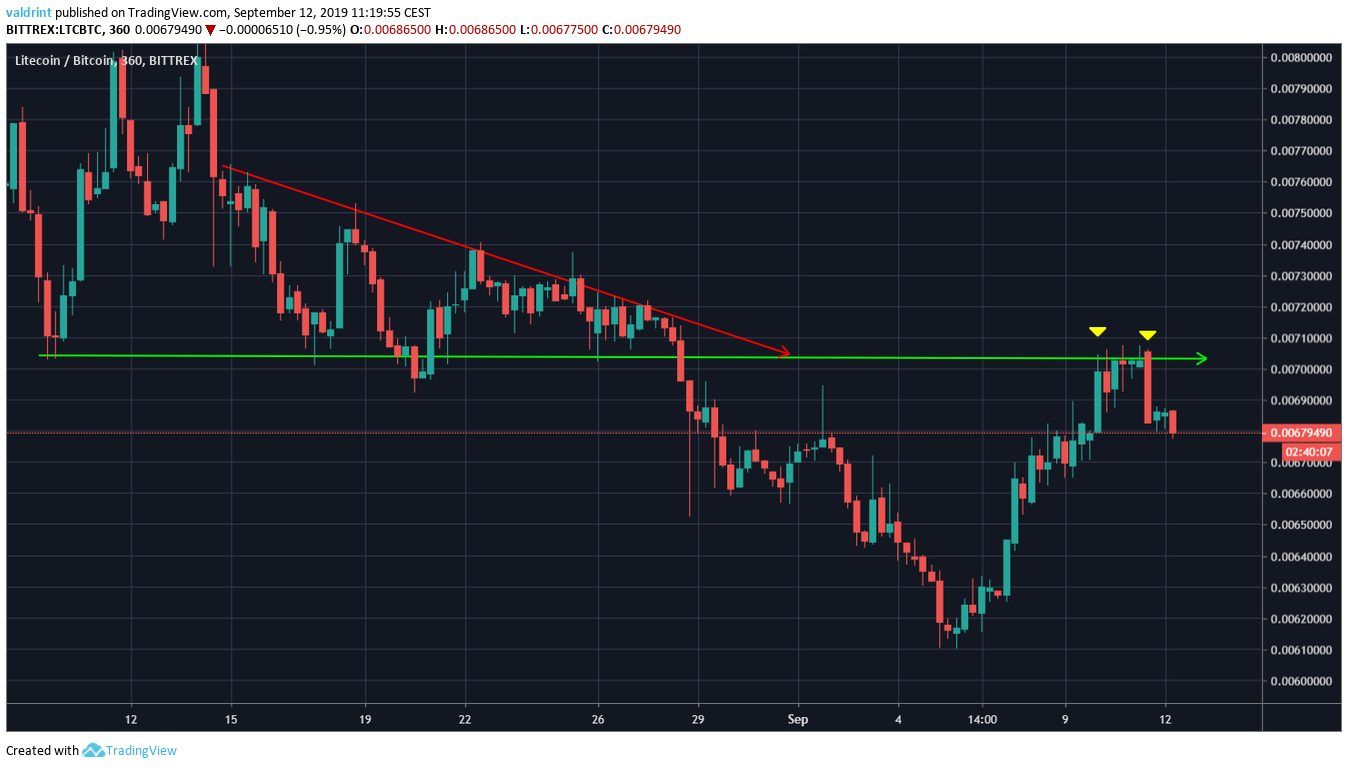 Afterward, it came back and validated the previous support line as resistance.
This is a customary movement, after which a decrease often follows.
This solidifies our previous bearish sentiment and makes us believe that a downtrend is in store.
Afterward, it came back and validated the previous support line as resistance.
This is a customary movement, after which a decrease often follows.
This solidifies our previous bearish sentiment and makes us believe that a downtrend is in store.
Future Movement
Two short-term support areas are outlined below.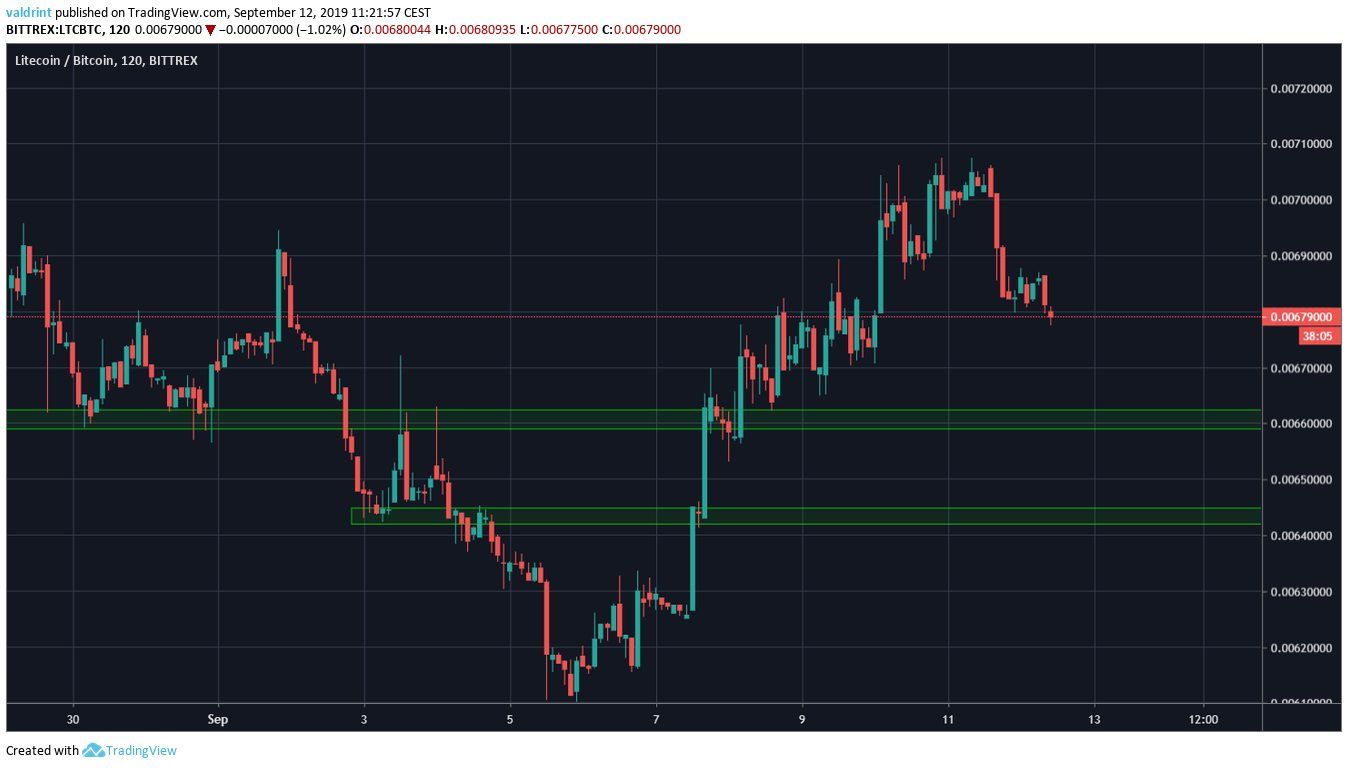 They are found at ₿0.0066 and ₿0.0064.
We believe that the Litecoin price may reach one (or both) of these areas.
They are found at ₿0.0066 and ₿0.0064.
We believe that the Litecoin price may reach one (or both) of these areas.

Litecoin Price Summary
The LTC price is following a descending support line. According to our analysis, it is likely to begin a downtrend. For hypothetical trading purposes, we consider LTC a sell close to ₿0.007 Do you think the LTC price will soon initiate a downtrend? Let us know in the comments below.Disclaimer: This article is not trading advice and should not be construed as such. Always consult a trained financial professional before investing in cryptocurrencies, as the market is particularly volatile. Images are courtesy of TradingView, Shutterstock.
Top crypto platforms in the US
Disclaimer
In line with the Trust Project guidelines, this price analysis article is for informational purposes only and should not be considered financial or investment advice. BeInCrypto is committed to accurate, unbiased reporting, but market conditions are subject to change without notice. Always conduct your own research and consult with a professional before making any financial decisions. Please note that our Terms and Conditions, Privacy Policy, and Disclaimers have been updated.

Valdrin Tahiri
Valdrin discovered cryptocurrencies while he was getting his MSc in Financial Markets from the Barcelona School of Economics. Shortly after graduating, he began writing for several different cryptocurrency related websites as a freelancer before eventually taking on the role of BeInCrypto's Senior Analyst.
(I do not have a discord and will not contact you first there. Beware of scammers)
READ FULL BIO
Sponsored
Sponsored