


Litecoin (LTC) price is close to a confluence of resistance levels at $108. A massive increase could follow if the price clears the area.
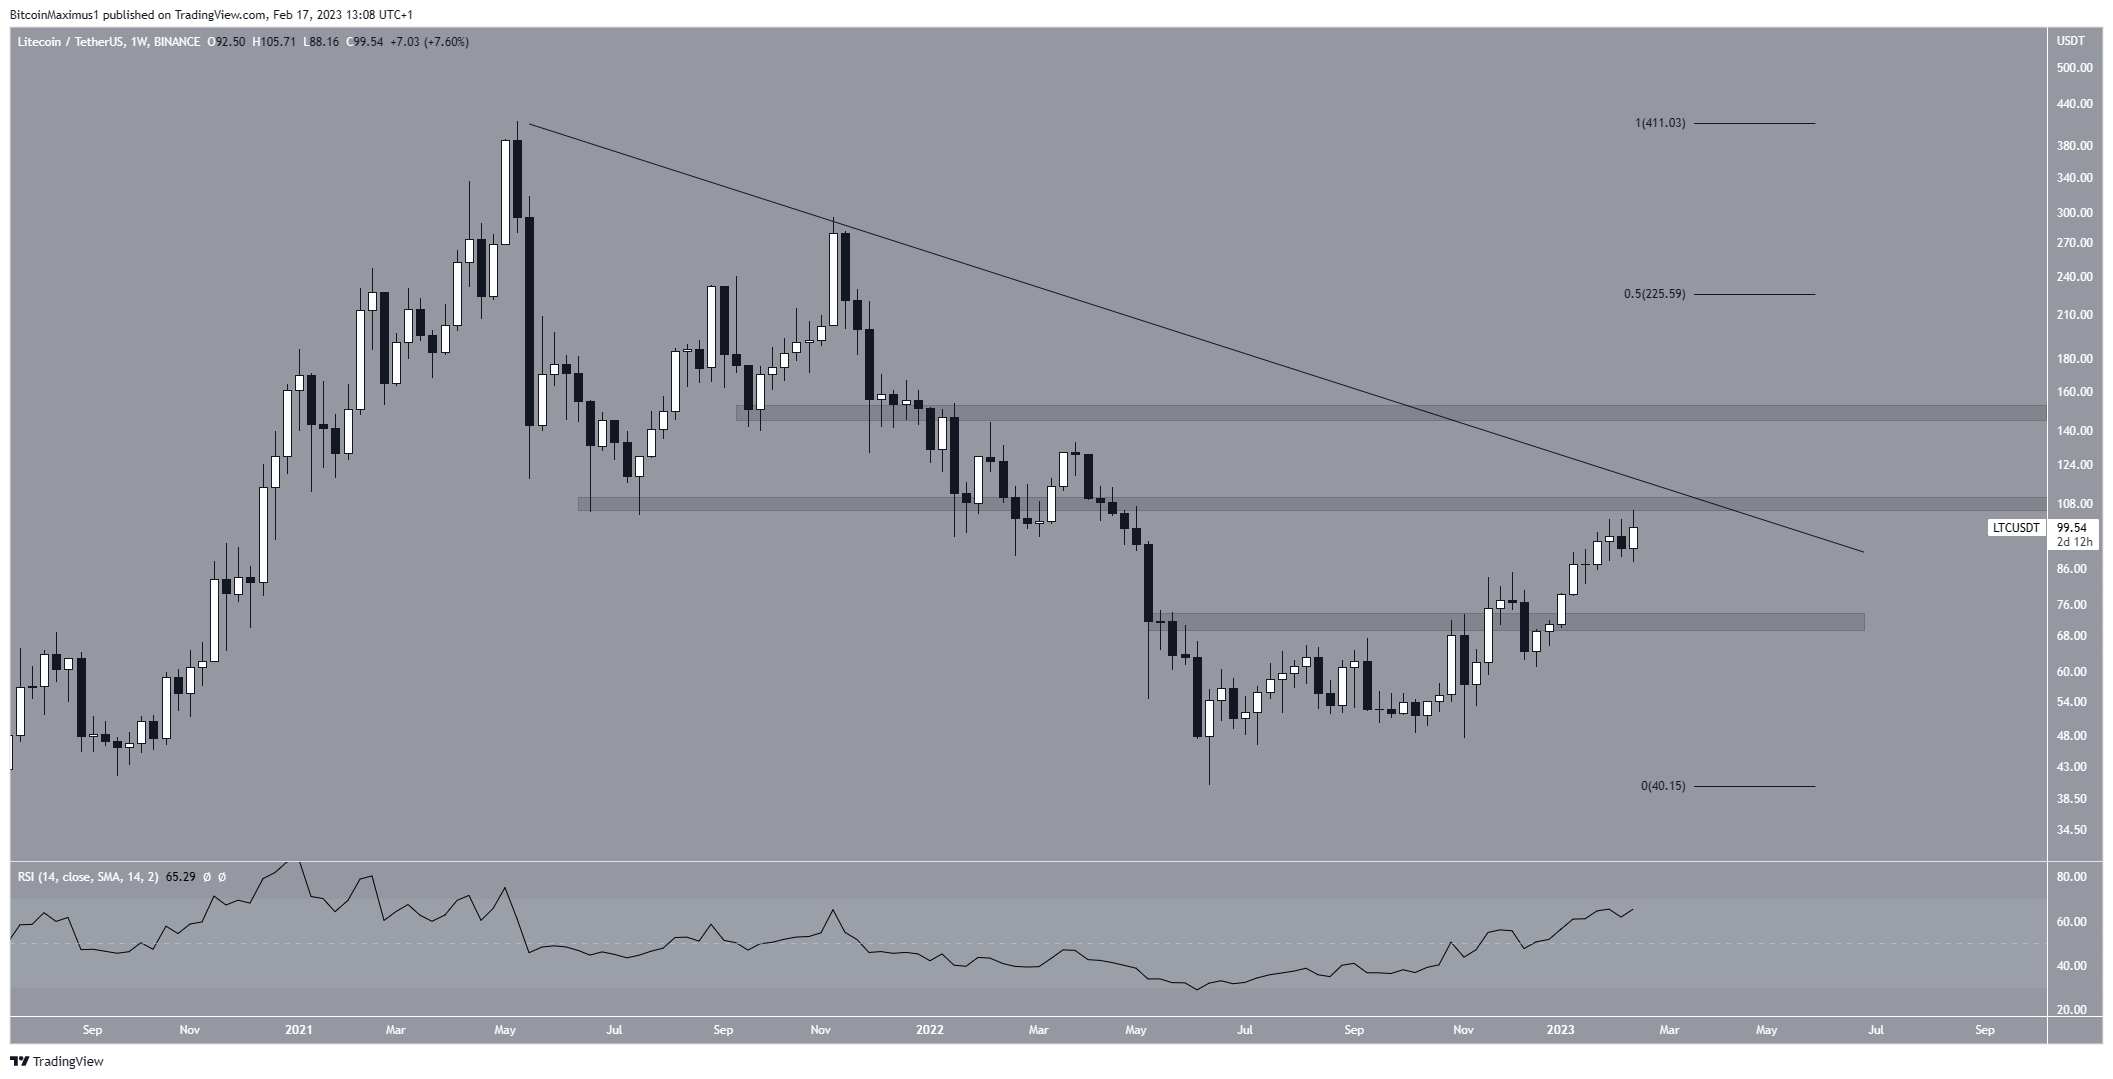
The weekly price history shows that the Litecoin price has fallen below a long-term descending resistance line since May 2021. The downward trend resulted in a low of $40.30 in June 2022. Then, the price began a rapid upward trend that is still ongoing. So far this year, the highest price has been $105.71.
The Litecoin price is very close to a confluence of resistance levels at $108. A horizontal resistance level and a descending resistance line create this resistance. If the LTC price breaks out above it, it will confirm that a bullish reversal has begun. This could push the price of LTC up to $150 or even $226, the 0.5 Fib retracement resistance level.
The weekly RSI supports this possibility because it is above 50, increasing, and there is no bearish divergence.
If the price of Litecoin is rejected, it may fall back to the $72 horizontal support area.
Litecoin (LTC) Price Count Supports 100% Increase
The Litecoin price wave count is extremely bullish. The price of Litecoin appears to be in a 1-2/1-2 wave formation (black and red) and is currently in wave three. Because wave three is typically the longest and sharpest, the rate of increase is expected to pick up significantly very soon. If the count is correct, LTC will break out of the $108 range, move toward $150, and eventually even higher. The sub-wave count is given in red.
The feature that supports the count is the breakout from the ascending parallel channel and its validation as support (green icon).
However, if the LTC price falls below the sub-wave one high (red line) at $85, it would invalidate this bullish forecast. In that case, the LTC price could fall down to the channel’s support line at $60.
The count will be confirmed if the Litecoin price breaks out of the $108 range.
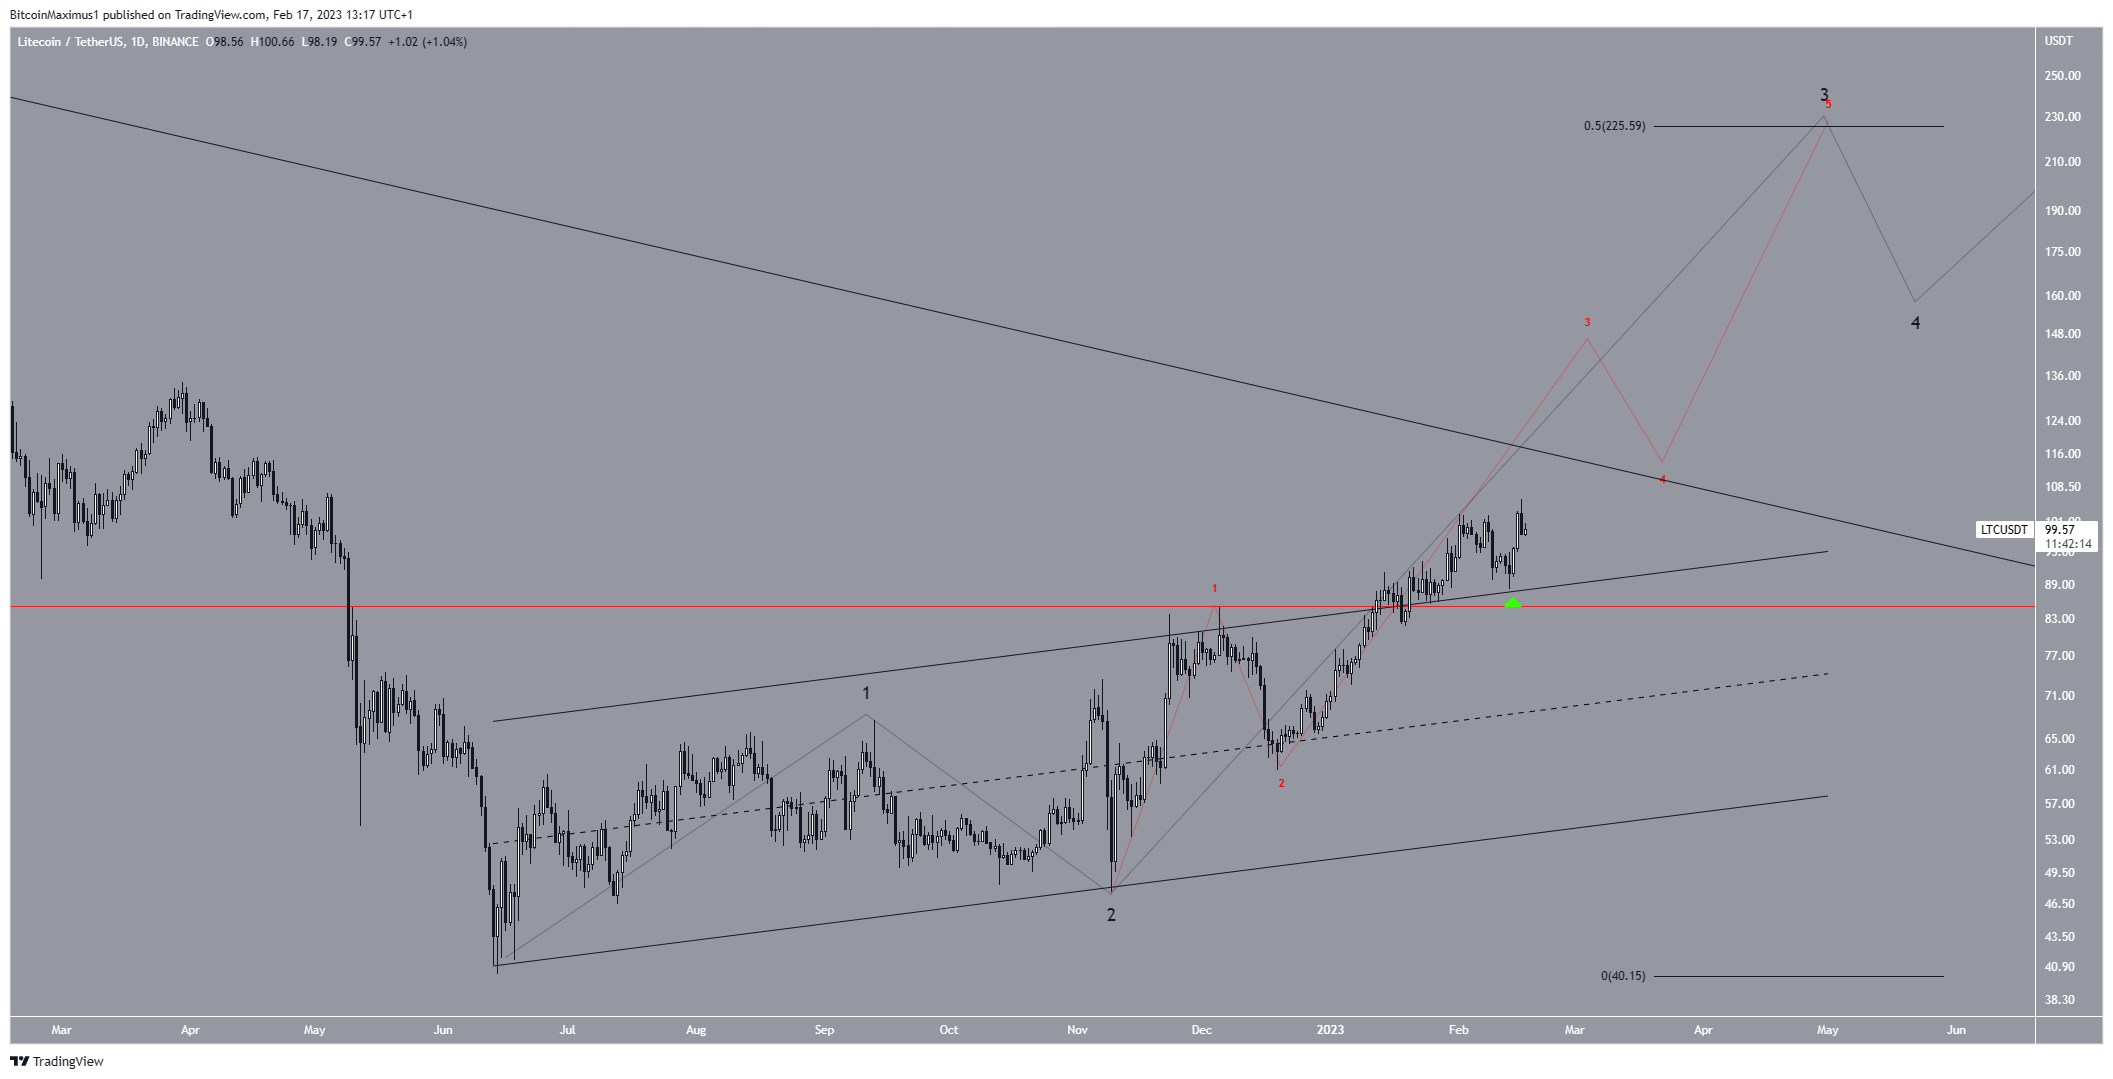
To conclude, the most likely Litecoin price analysis suggests that a breakout toward $150 and then $225 will follow. However, a decrease below $85 would invalidate this forecast. In that case, the LTC price would be expected to fall toward $60.
For BeInCrypto’s latest crypto market analysis, click here


