

Litecoin (LTC) broke down from an ascending wedge on Aug 19, effectively confirming that the upward movement was corrective and that new lows will follow.
There have been various new developments in regard to the MimbleWimble Extensions Blocks (MWEB) since the launch earlier this year.
This month, the first draft of LIP-0006, which details the changes and additions to the p2p protocols, became ready for review. What is now missing is allowing clients to sync MWEB data by downloading the compact UTXOs and their merkle proofs. This final update is expected to occur sometime in Sept.
LTC breaks down
Despite these seemingly positive developments, the price action and technical indicator readings are both bearish.
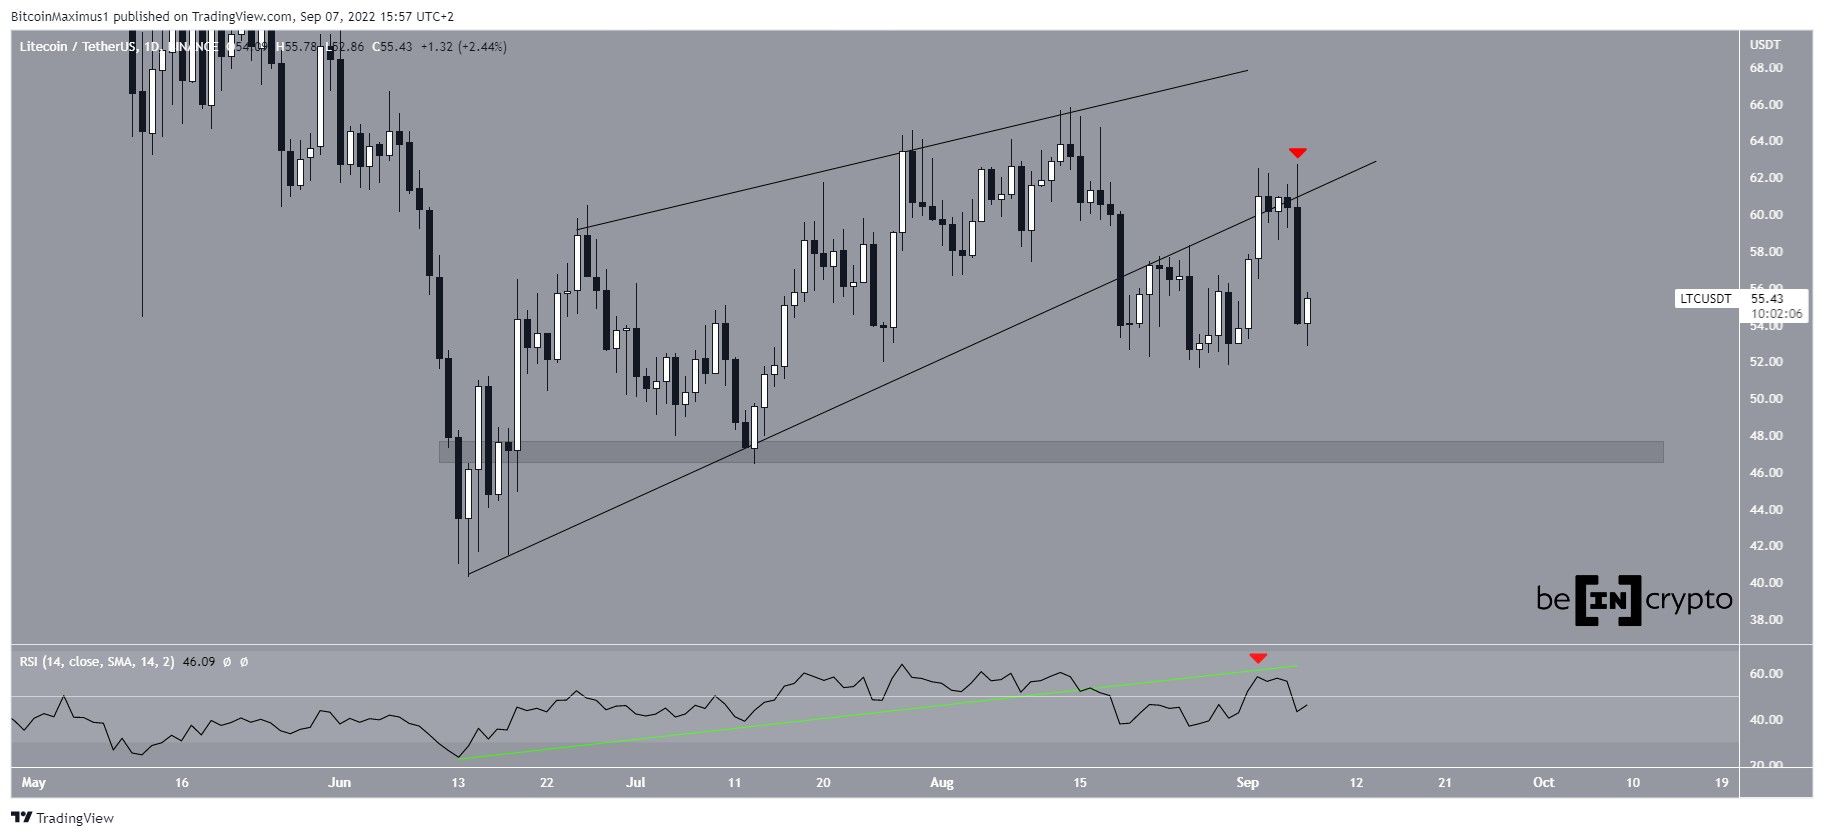
On Aug 19, LTC broke down from an ascending wedge that had previously been in place since the June 14 lows. Since the wedge is considered a bearish pattern, the breakdown was expected.
Moreover, the daily RSI broke down from its ascending support line close to the same time when LTC broke down from its wedge. Afterward, both the RSI and the price validated their previous support lines as resistance (red icons).
The closest support area is at $47.50. A potential breakdown below it would take Litecoin towards new lows.
Wave count analysis
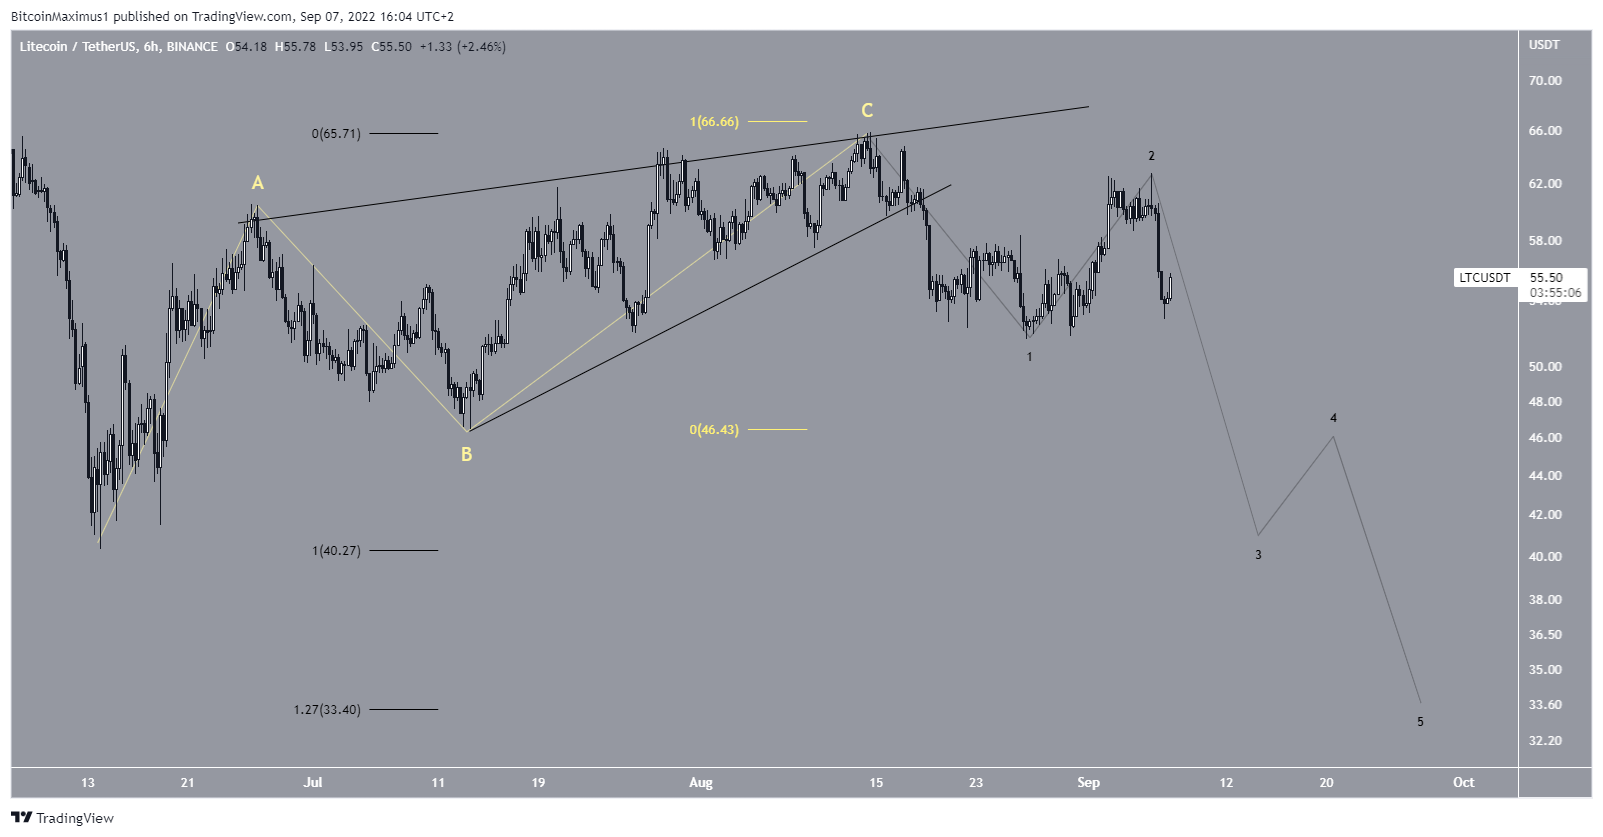
The most likely wave count suggests that LTC has completed an A-B-C corrective structure (yellow), in which waves A:C had an exactly 1:1 ratio.
Afterward, it began a bearish five-wave movement (black) and is currently in the third wave.
If the count is correct, Litecoin would fall to at least $33.40, reaching the 1.27 external Fib retracement of the previous increase.
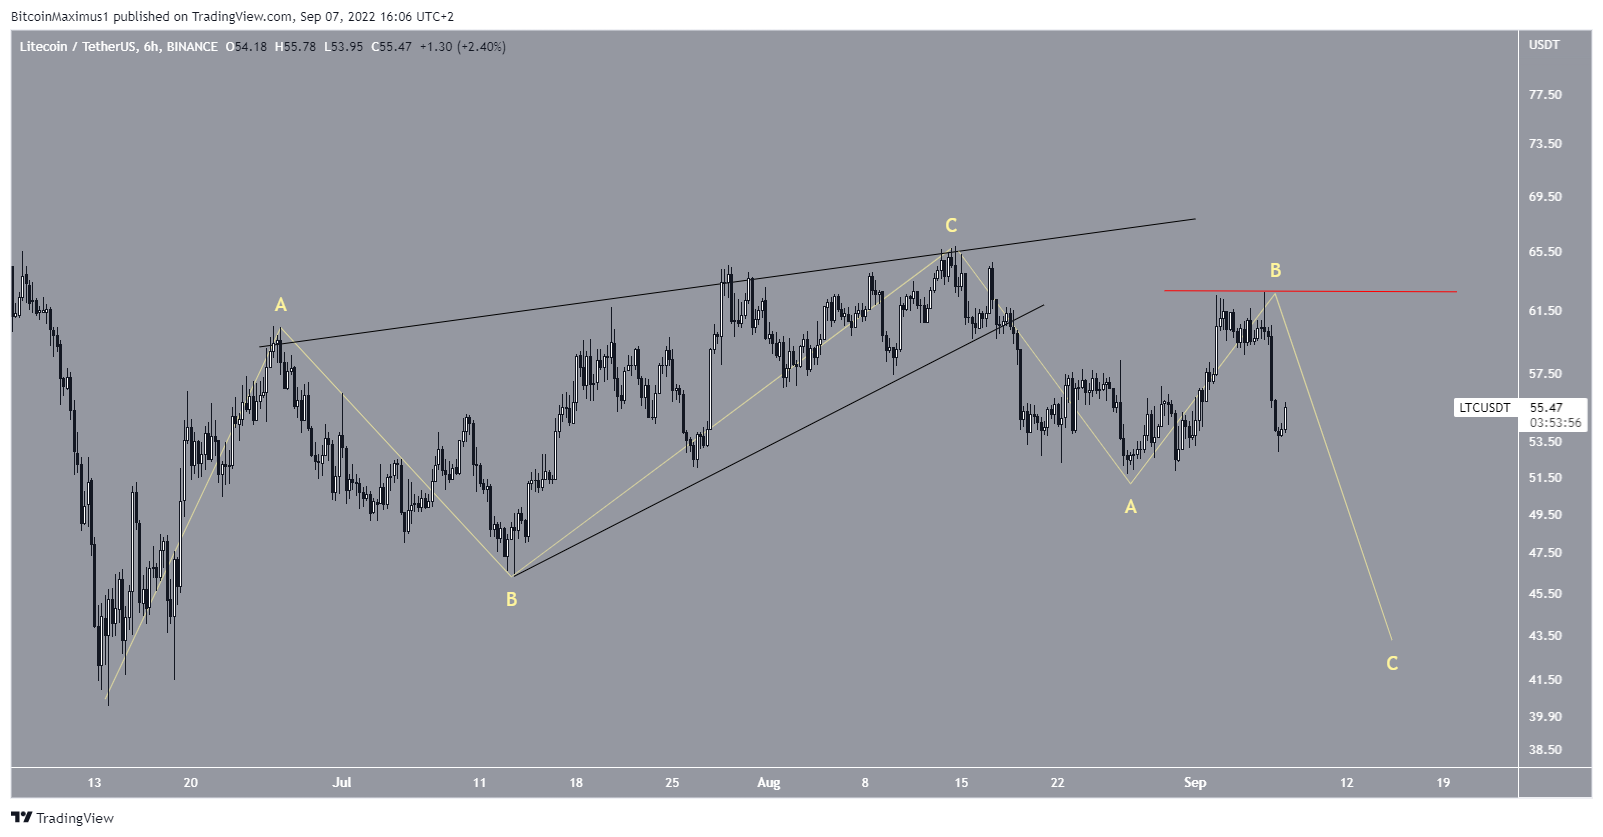
The second potential count would indicate that LTC is now in a downward A-B-C correction. In this case, the structure would be similar to the upwards one, with the price currently being in wave C.
If this is the correct count, LTC would still fall towards $44, but would bounce afterward instead of crashing below its June lows. An increase above the Sept 7 high of $62.74 would invalidate both these counts.
For Be[in]Crypto’s previous Bitcoin (BTC) analysis, click here
Disclaimer
In line with the Trust Project guidelines, this price analysis article is for informational purposes only and should not be considered financial or investment advice. BeInCrypto is committed to accurate, unbiased reporting, but market conditions are subject to change without notice. Always conduct your own research and consult with a professional before making any financial decisions. Please note that our Terms and Conditions, Privacy Policy, and Disclaimers have been updated.
