


Litecoin (LTC) has been trading in the absence of considerable volatility over the past six months. A sharp movement could occur soon, causing a breakout from this range.
John Bollinger, a veteran trader and the creator of the Bollinger bands indicator, noted that the price has been trading in a tight range for the past five months and is approaching a squeeze in the weekly chart.
He plans to discuss this event at the Litecoin summit, which will be held on Oct. 21 and 22.
Since the price is trading in a close-knit range, a squeeze would mean that a decisive movement in one or the other direction will occur, breaking out/down from the range in the process.
Trading range tightest since July 2020
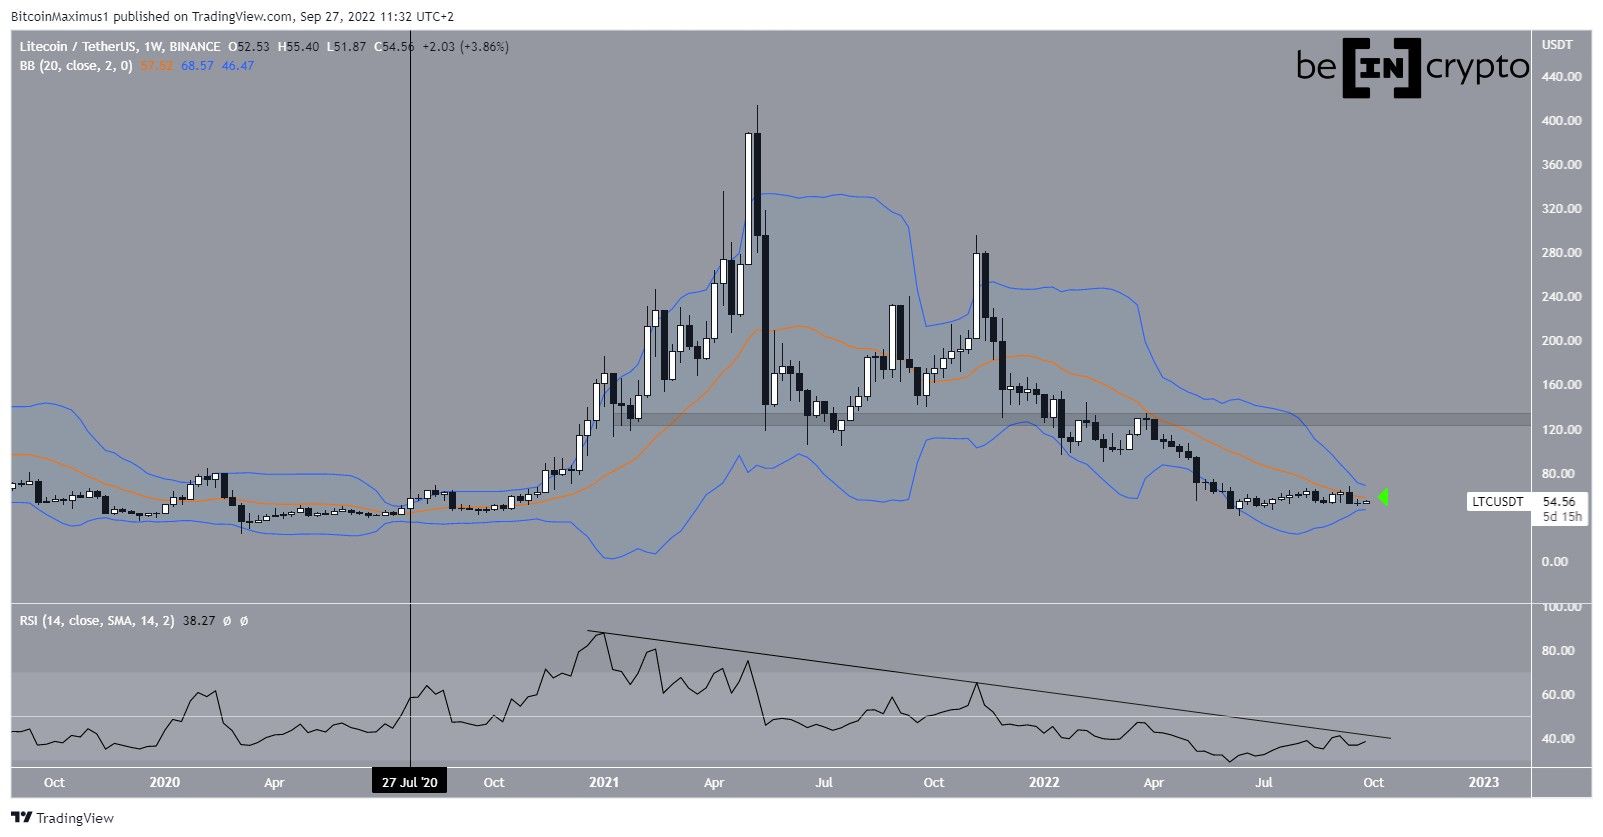
LTC has been falling since reaching an all-time high price of $413.50 in May 2021 and then creating a lower high in Nov. So far, it has reached a low of $40.30.
Currently, LTC is trading just below the midline (green icon) of the Bollinger bands indicator. It is interesting to note that the range has not been this tight since July 20 (black line). At the time, the price broke out above the upper limit of the range before beginning a massive bull run.
However, there are no signs of a bullish reversal yet, since the RSI is decreasing and is still below 50. Additionally, it is still following its bearish divergence trend line.
A reclaim of the middle of the Bollinger bands (orange) would be a sign that a bullish reversal has begun, since LTC has been trading below it since Nov.
Is an LTC rally incoming?
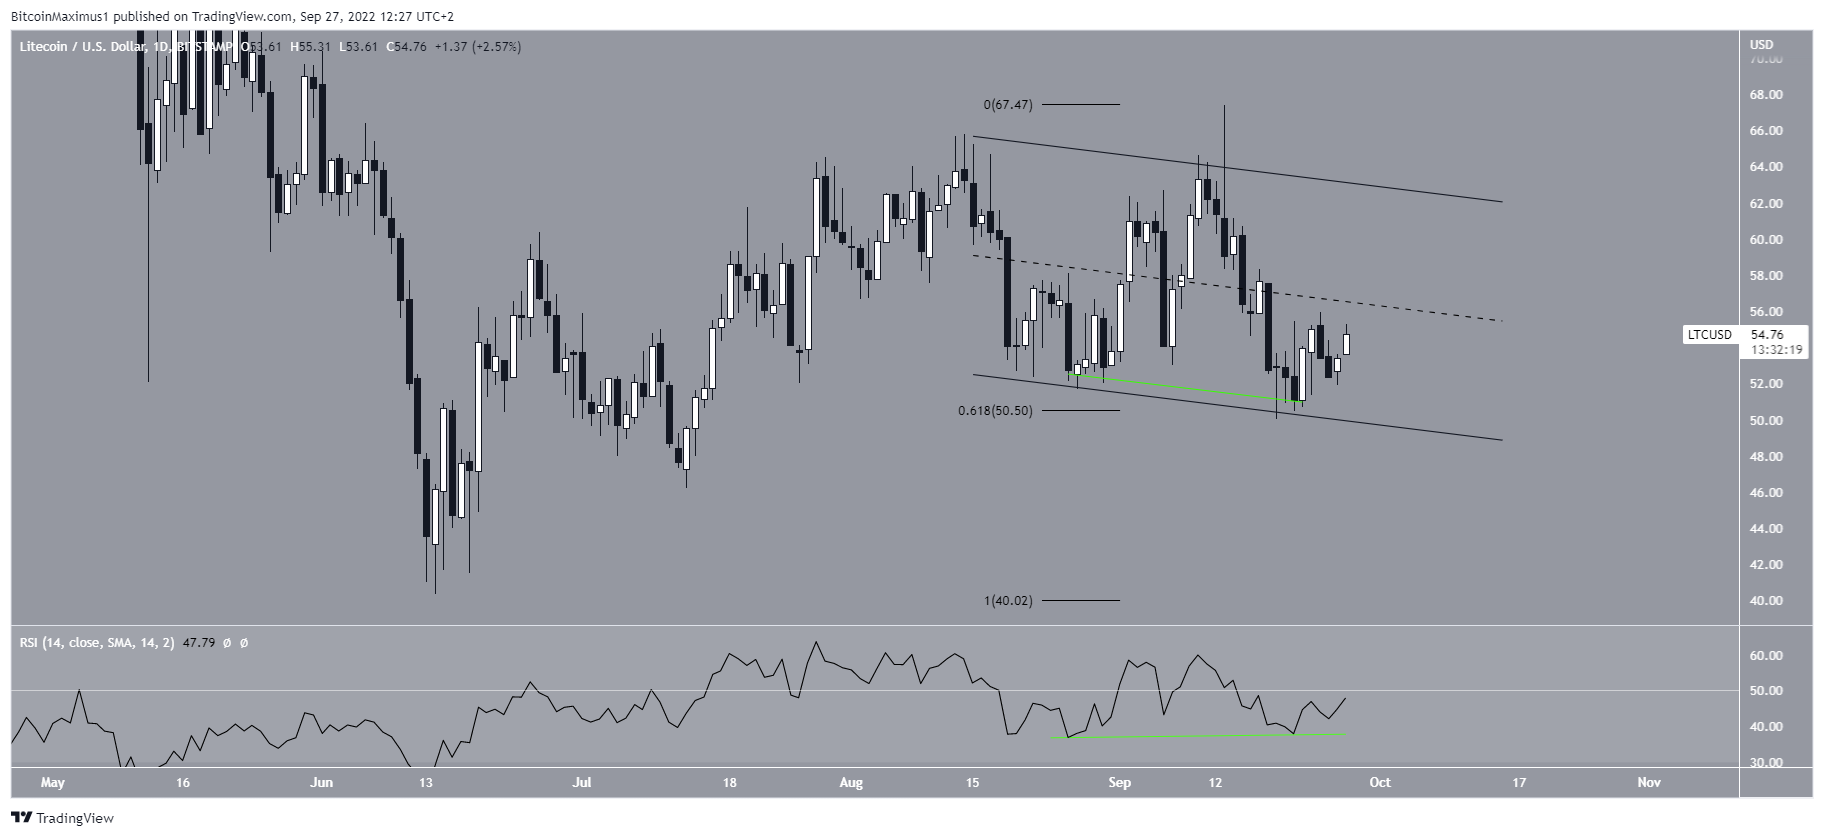
The daily chart supports the possibility of the price initiating an upward movement. There are three main reasons for this.
- Firstly, the daily RSI has generated bullish divergence.
- Secondly, the price is trading inside a descending parallel channel, which usually contains corrective movements.
- Thirdly, the bounce occurred at the confluence between the 0.618 Fib retracement support level and the support line of the channel.
So, an increase above middle of the channel, which is currently at $56, would go a long way in confirming that the proposed upward movement in the weekly time frame is about to transpire.
For Be[in]Crypto’s latest Bitcoin (BTC) analysis, click here
