
Litecoin (LTC) has been decreasing since May and has fallen below a long-term horizontal support level.
There are no clear bullish signs present. However, LTC is potentially trading inside a descending wedge and could create a double bottom formation.
Litecoin breaks down below long-term support
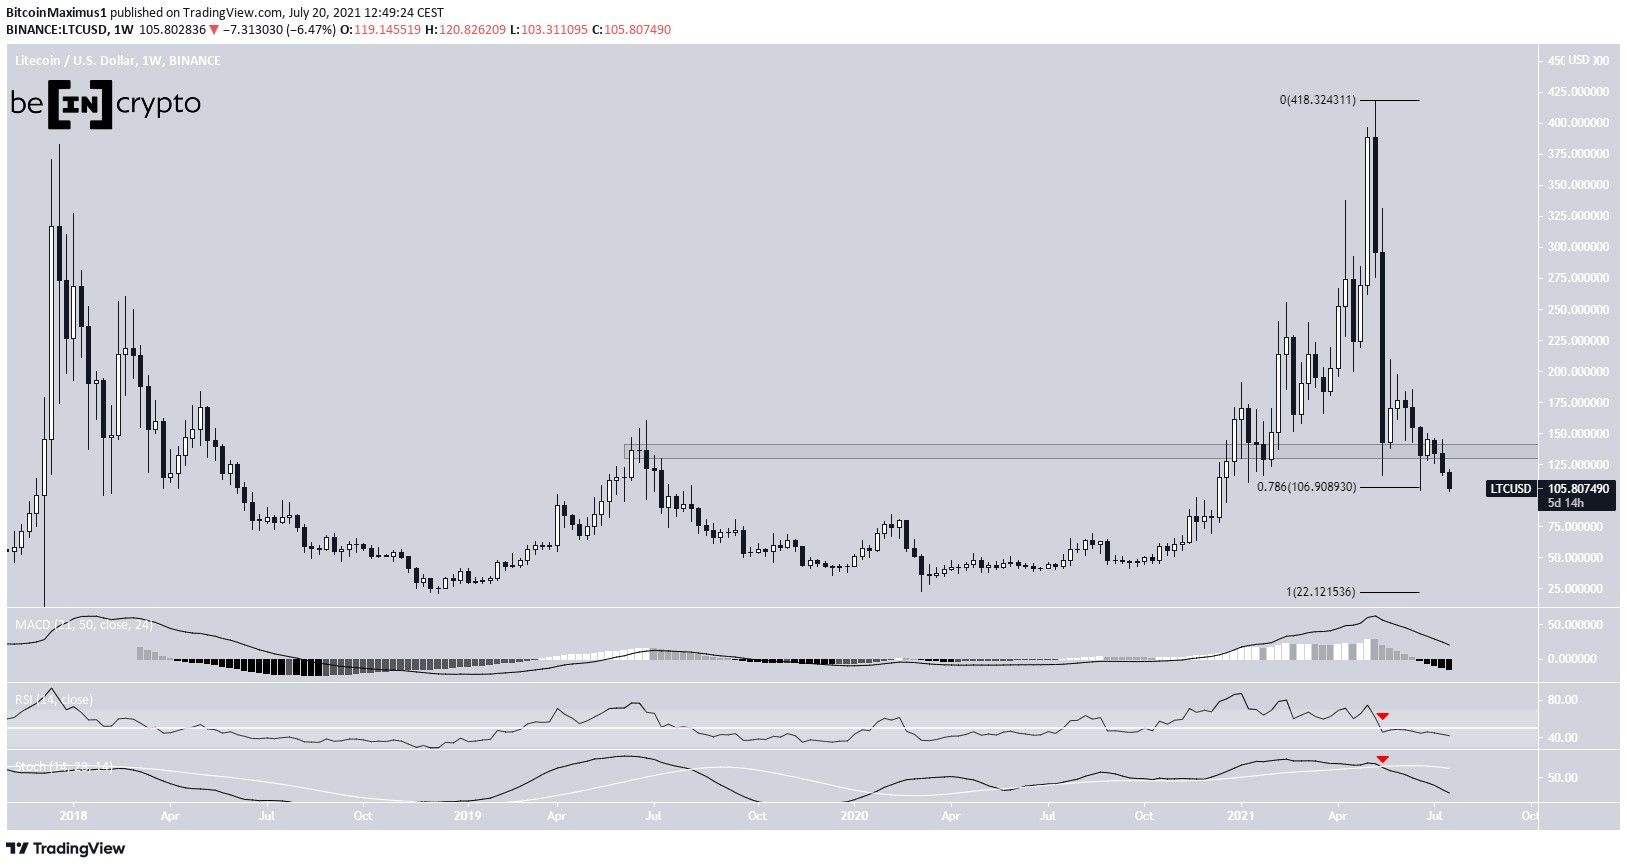
Litecoin has been moving downwards since May 10, after it reached an all-time high price of $417. The downward movement continued until a low of $116 was reached on May 23.
While the price of LTC initially bounced, it has since resumed its downward movement. On July 18, it broke down below the $135 horizontal support area and is now at the 0.786 Fib retracement support level at $107. If it does not bounce at this level, the next support would be found around $60.
Technical indicators are bearish. The MACD is moving downwards, the RSI is below 50, and the Stochastic oscillator has made a bearish cross (red icons).
Descending resistance line
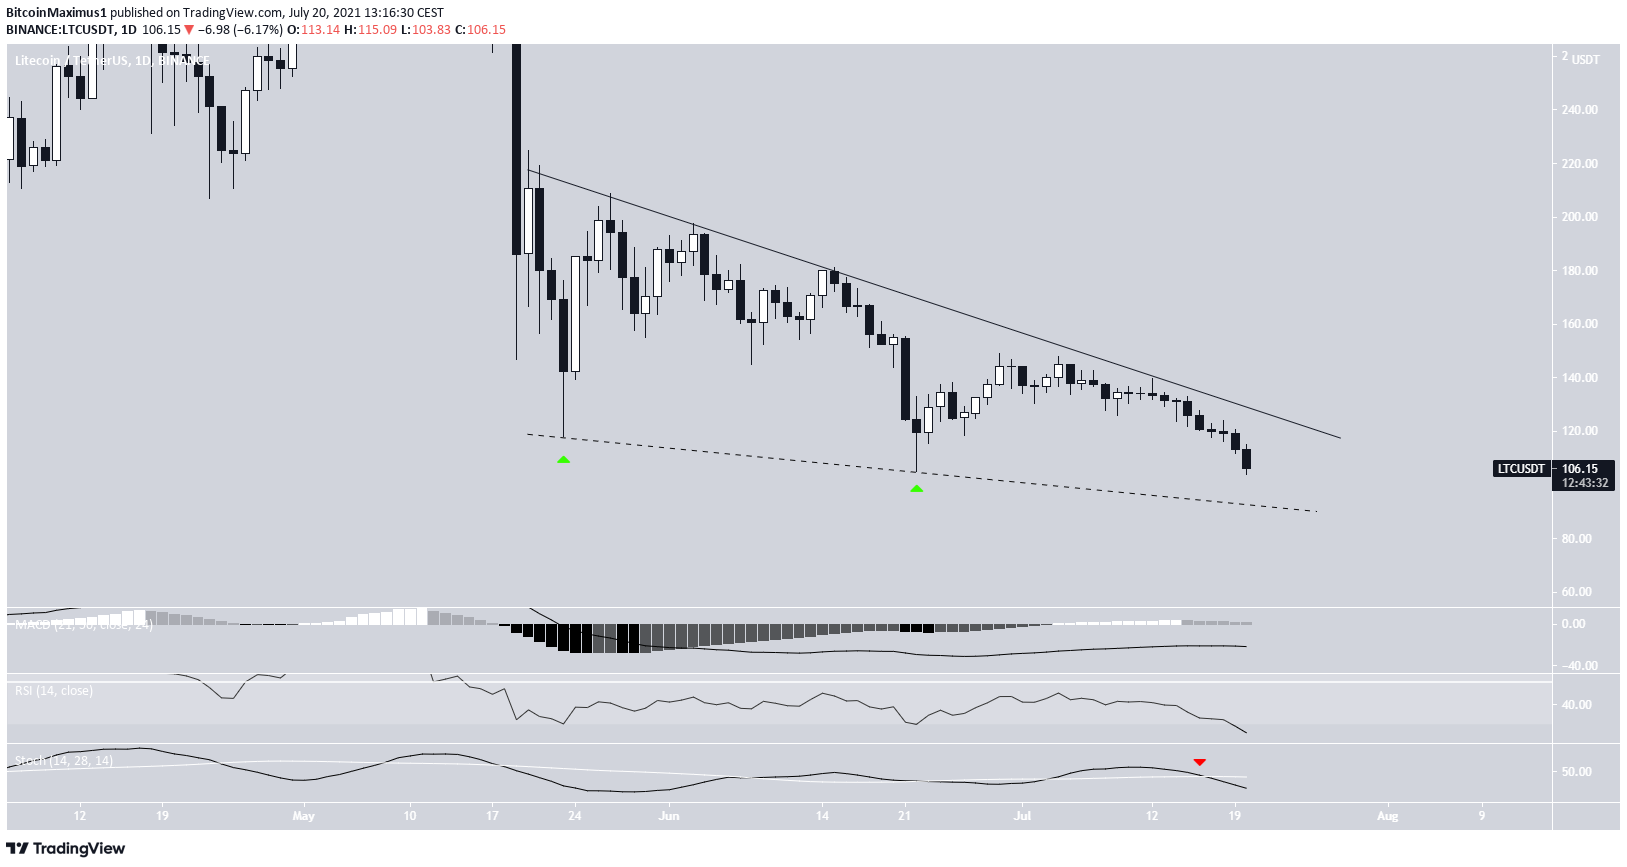
The daily chart shows that LTC has been following a descending resistance line since May 19. Most recently, it was rejected by the line on July 12.
While it’s possible that LTC is also following a descending support line (dashed), the line has only been validated twice so far, thus it’s not yet confirmed.
Both lines could combine to create a descending wedge, which is often considered a bullish pattern.
Similar to the weekly time-frame, technical indicators in the daily time-frame are bearish.
Wave count
Cryptocurrency trader @CryptoTony_ outlined an LTC chart, stating that the current wedge could lead to a breakout and a bounce.
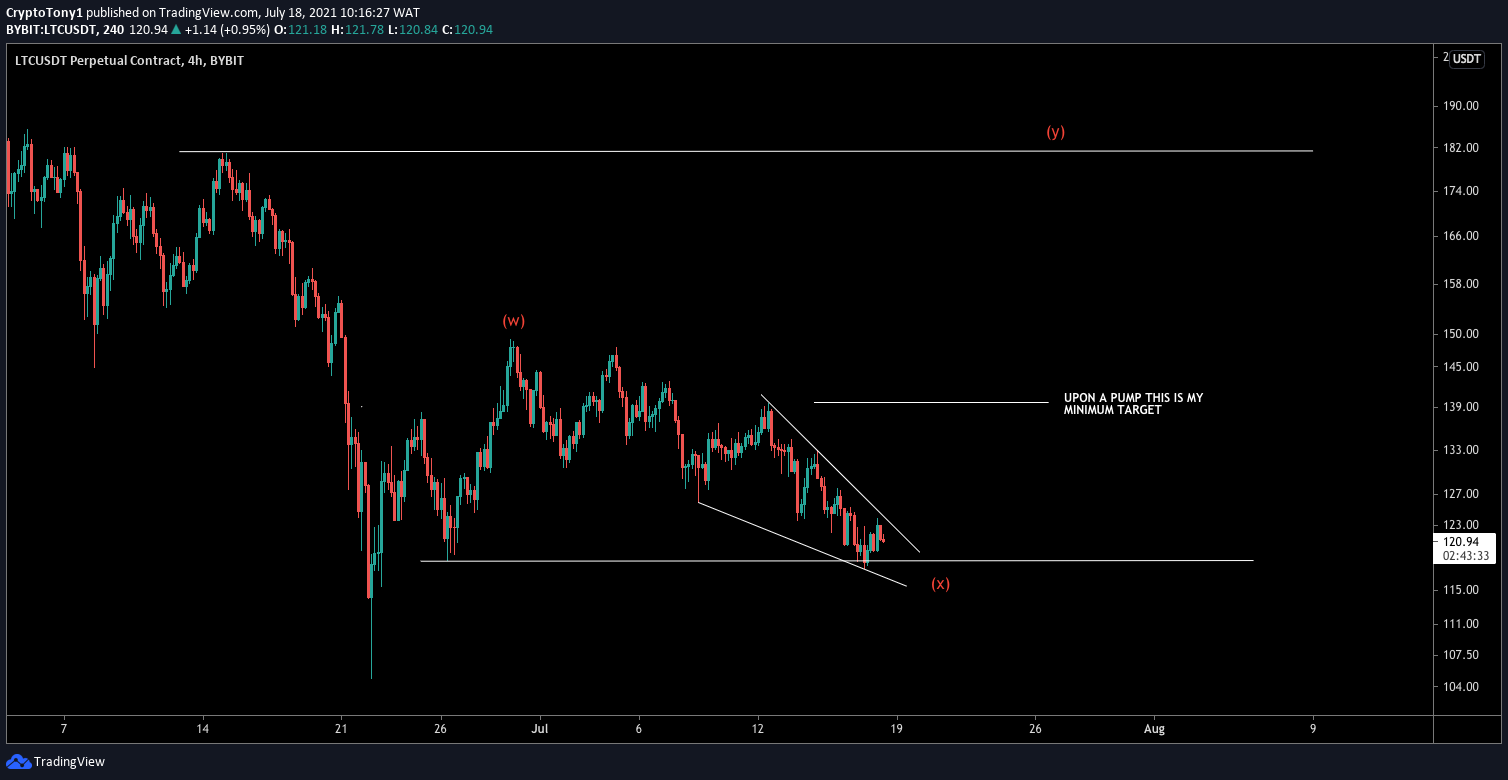
Since the tweet, LTC has actually broken down from the outlined short-term wedge.
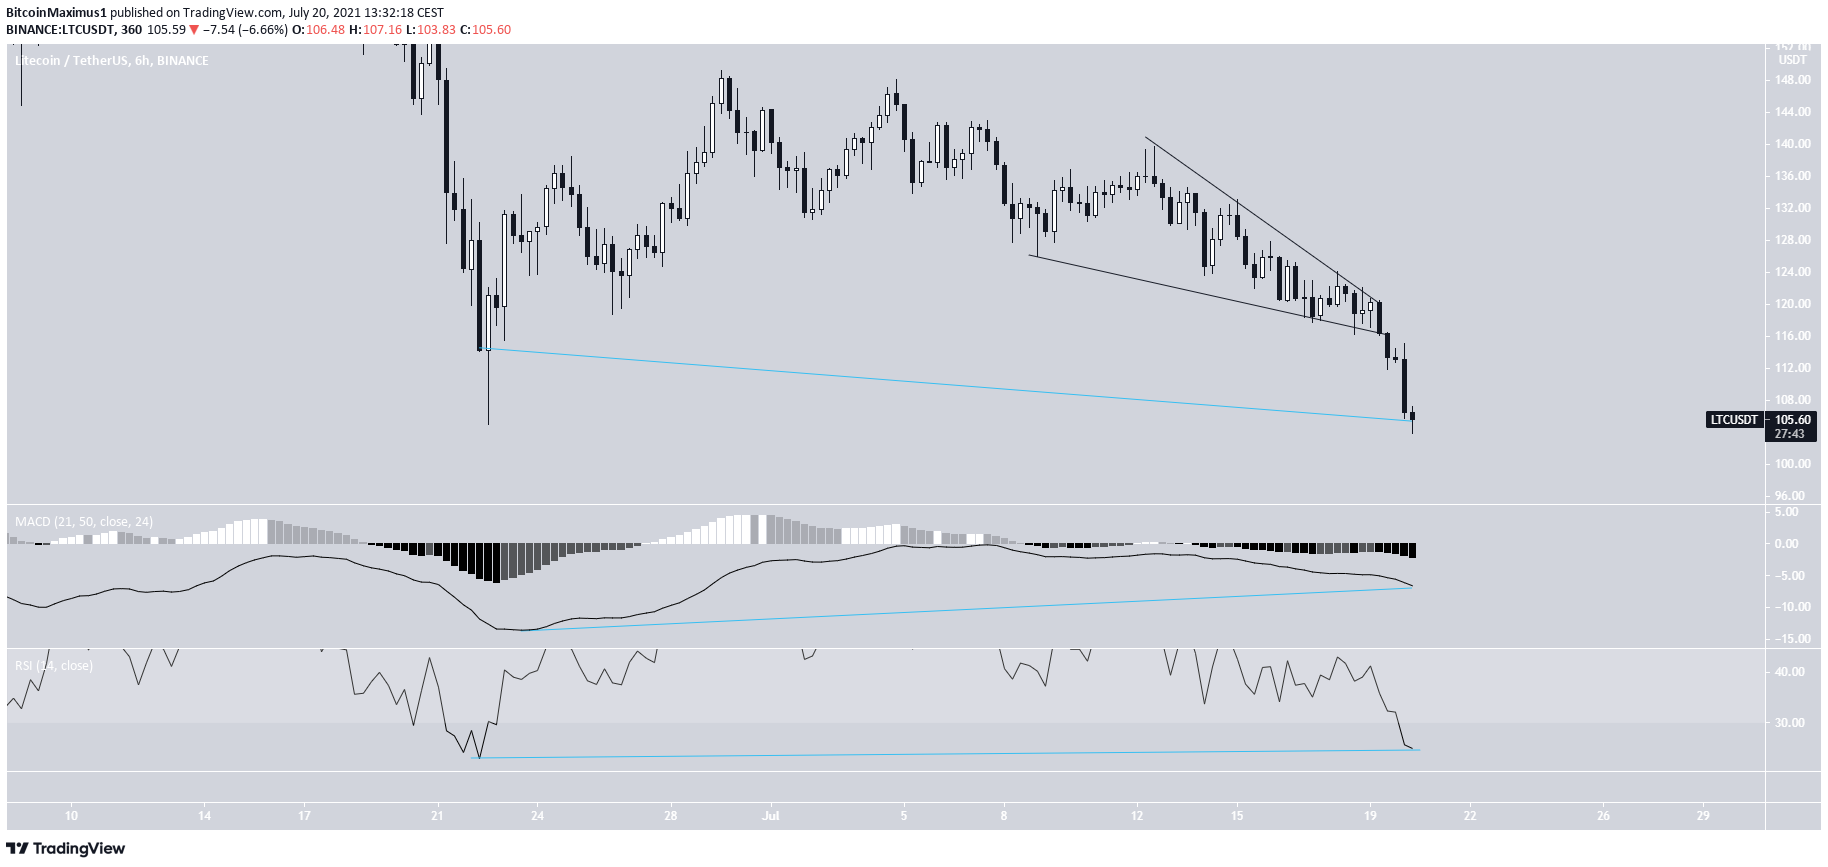
While there are no definite bullish signs, it’s possible that LTC is currently creating a double bottom pattern.
In addition to this, there are unconfirmed bullish divergences in place in the RSI and MACD.
However, LTC has to rebound quickly in order to confirm these divergences.
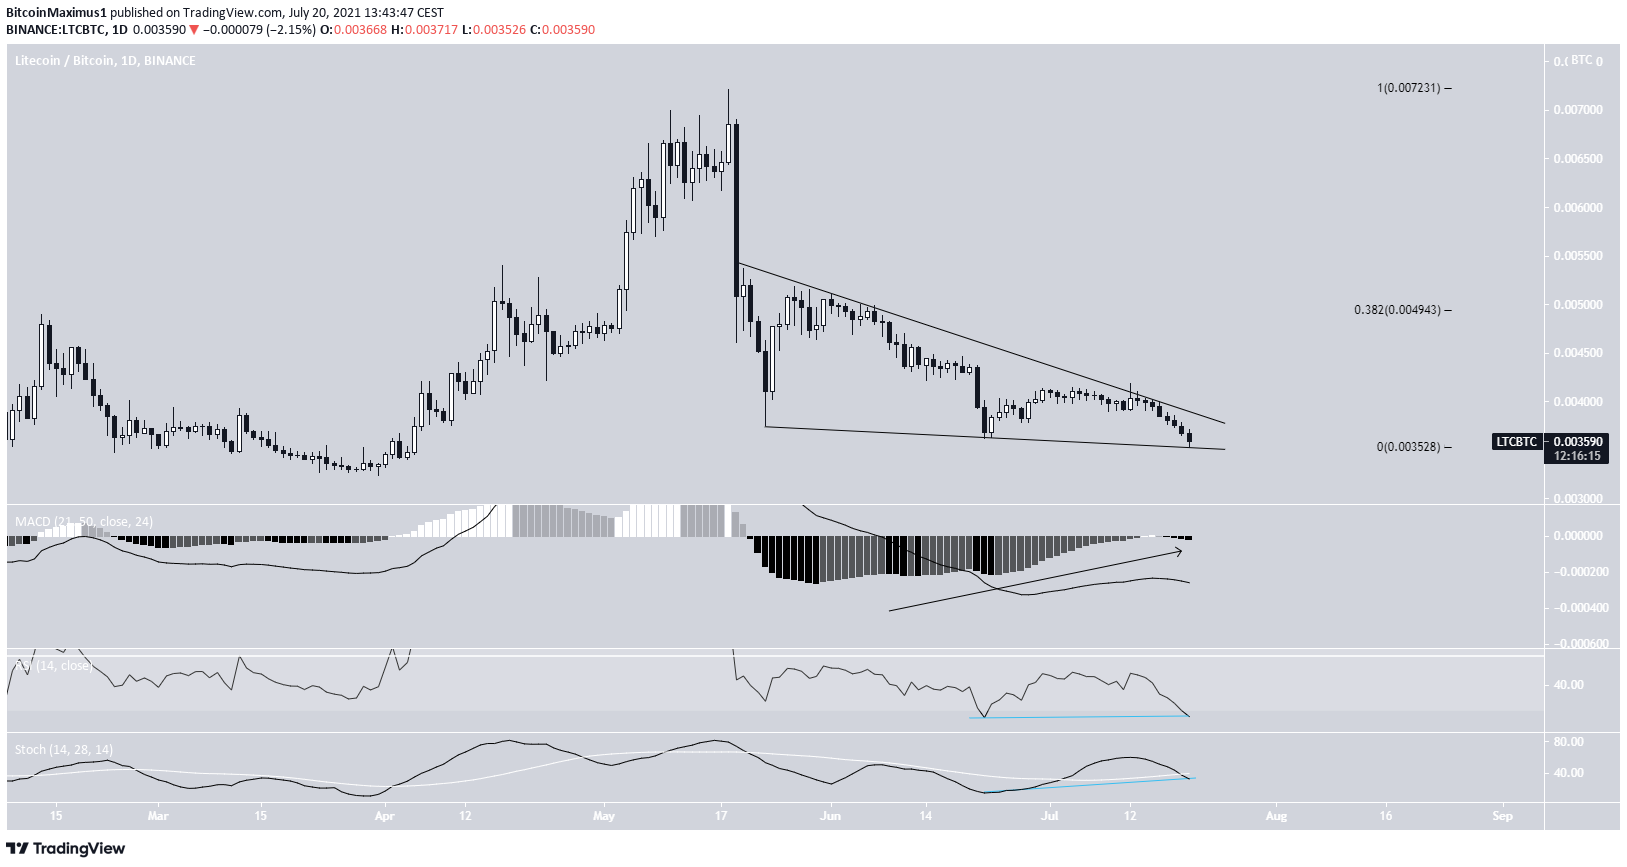
LTC/BTC
LTC/BTC has been decreasing alongside a descending wedge since May 20. It’s trading very close to the point of convergence between support and resistance, at which time a decisive move will likely occur.
The descending wedge is often considered a bullish pattern.
In addition to this, the MACD, RSI, and Stochastic oscillator have all generated bullish divergences.
If a breakout occurs, the closest resistance would be at ₿0.0049.
For BeInCrypto’s latest bitcoin (BTC) analysis, click here.
