


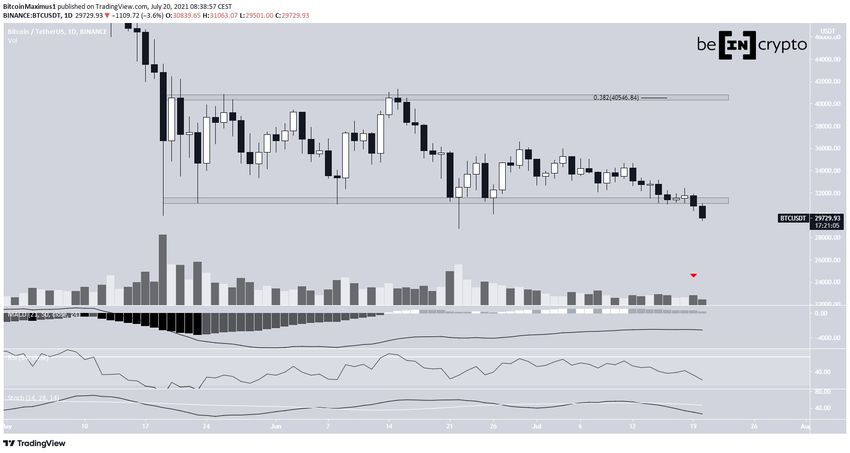
Bitcoin (BTC) decreased on July 19, falling below the $31,300 horizontal support area that has been in place since May.
The next closest support level would be a potential double bottom at the $28,805 level.
BTC range breakdown
BTC had been trading inside a range between $30,300 and $40,550 since May 19. While it had fallen below the support area a few times, it did not reach a daily close below it.
On July 19, it fell below the area once more and proceeded to reach a close of $30,839, which is the lowest since January.
Even though there are multiple unconfirmed bullish divergences, technical indicators are bearish. The RSI and MACD are falling, and the Stochastic oscillator has made a bearish cross and is also moving downwards.
However, trading volumes on the breakdown have been low.
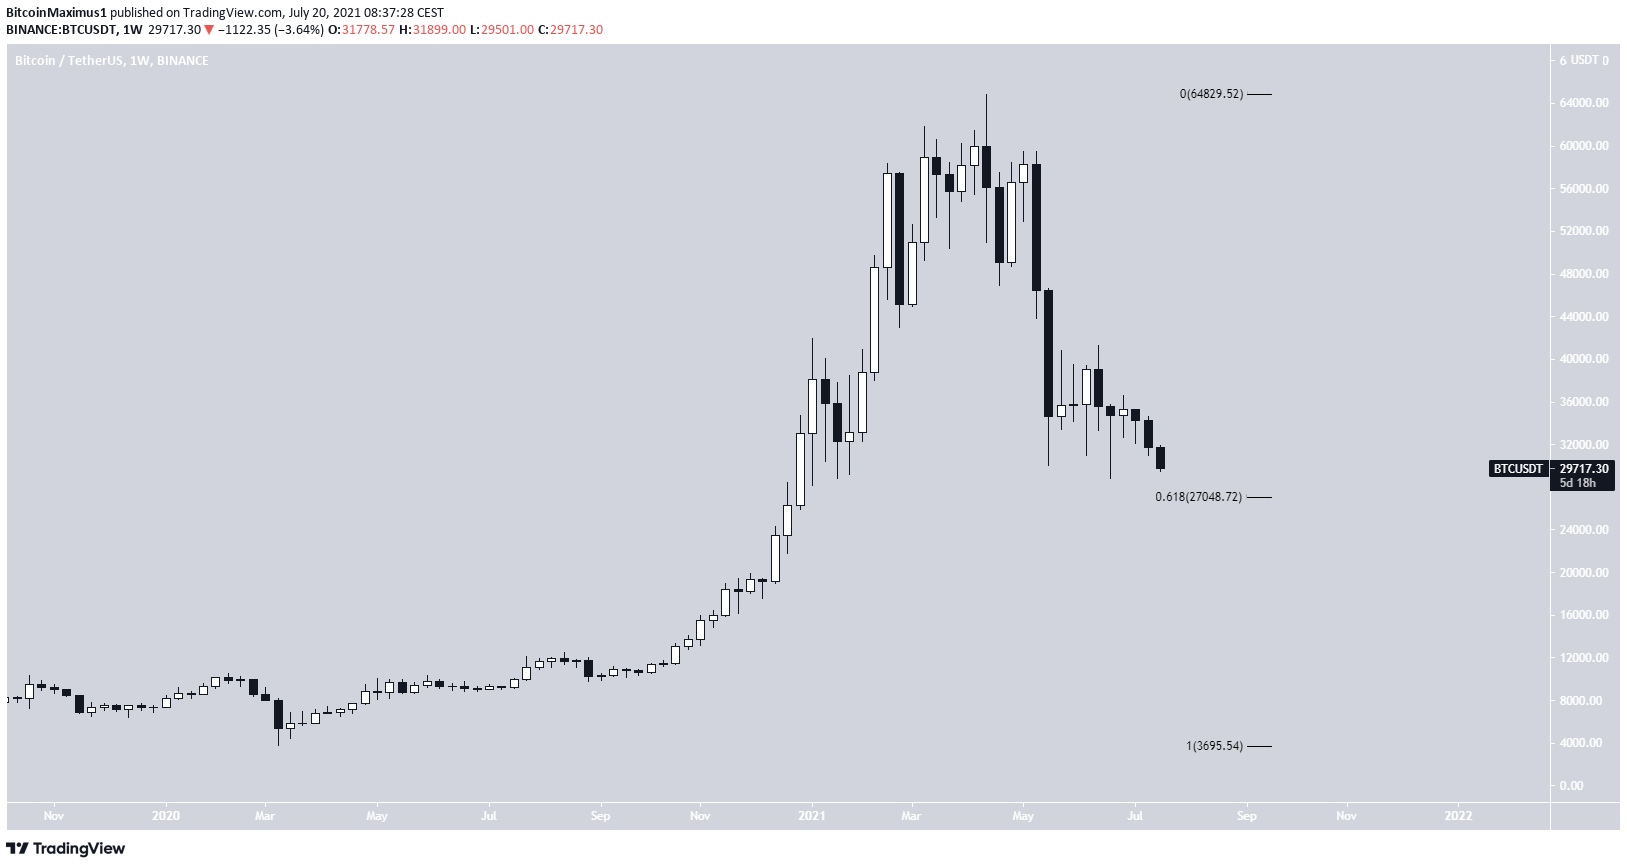
A look at the weekly time-frame shows that the main support area is at $27,050. This is the 0.618 Fib retracement support level when measuring the entire upward movement since March 2020.
Channel breakdown
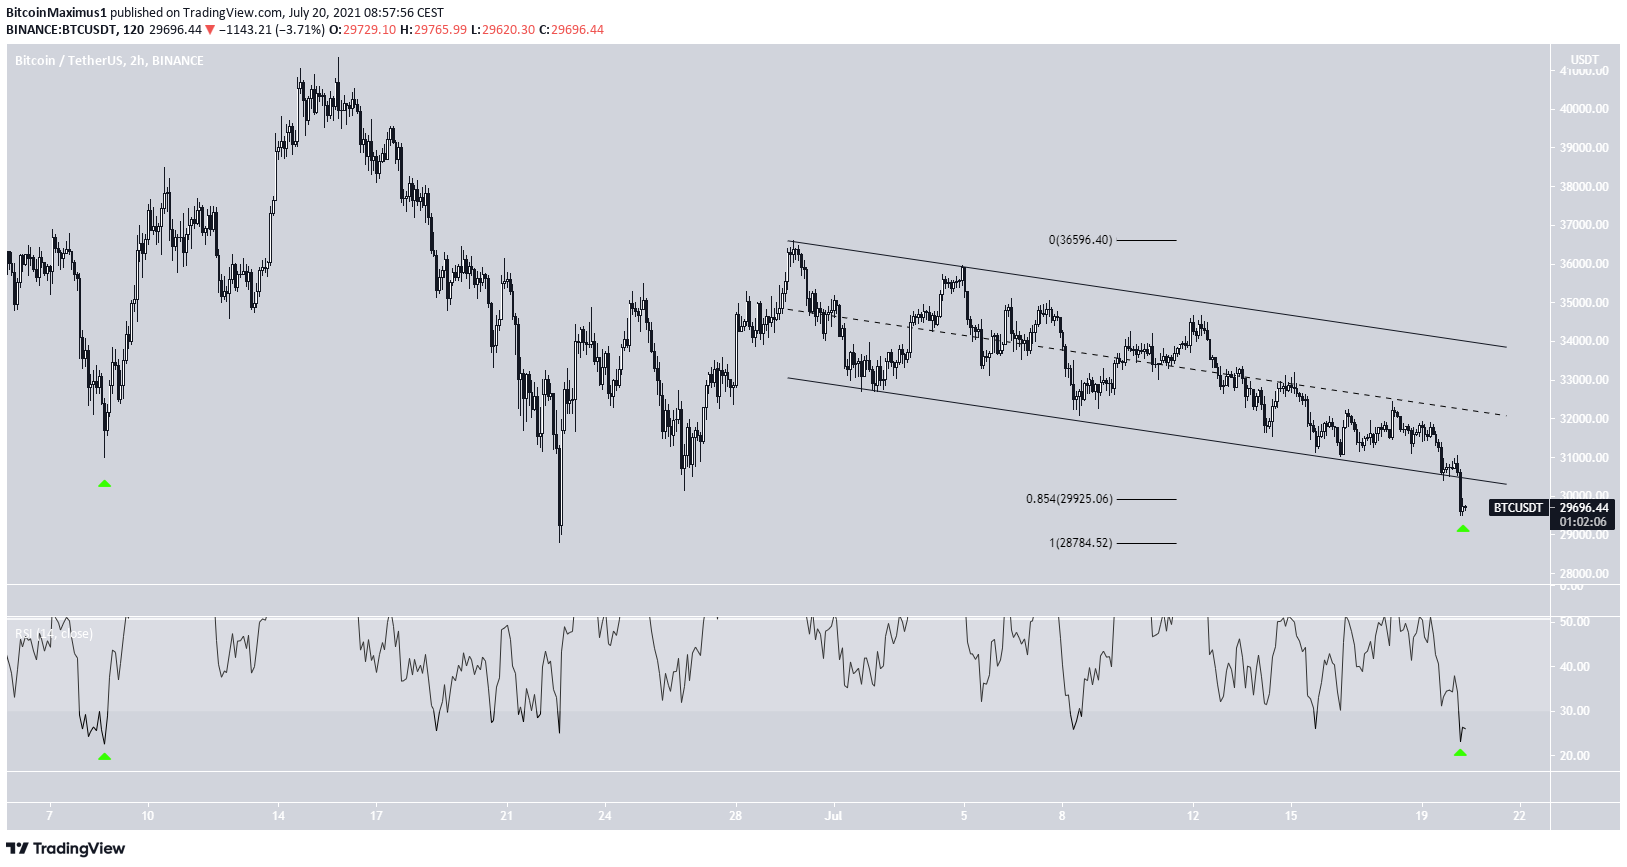
BTC had been decreasing alongside a descending parallel channel since June 29.
Yesterday’s decrease caused a breakdown from the channel. In addition to this, the price did not bounce at the 0.854 Fib retracement support level at $29,925. The next potential support would be a double bottom at $28,784.
The two-hour RSI is extremely oversold, currently being at 23. This is the lowest it has been since June 8, when an upward move of more than 30% followed.
Wave count
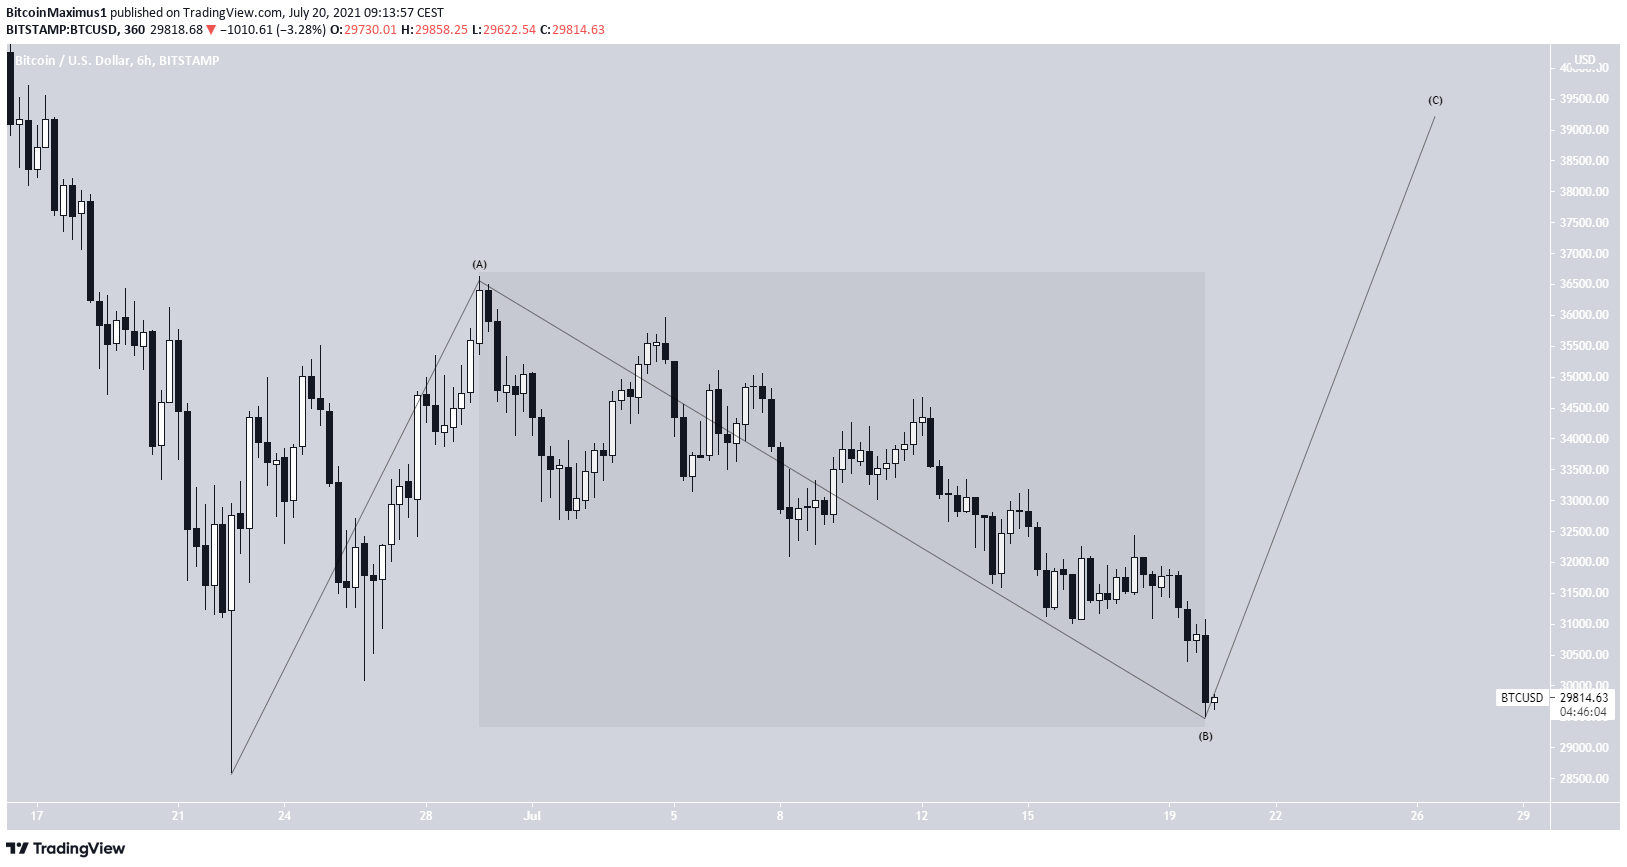
The wave count indicates that BTC is in a flat corrective structure. The downward movement since June 28 is extremely choppy and gradual, making it unlikely that it is a bearish impulse.
Flat corrections often retrace fully, therefore a potential double bottom scenario remains in play.
For a more detailed look at the longer-term wave count, click here.
For BeInCrypto’s previous bitcoin (BTC) analysis, click here.


