
While Litecoin (LTC) has validated a long-term bullish structure, the direction of the short-term trend seems to be bearish
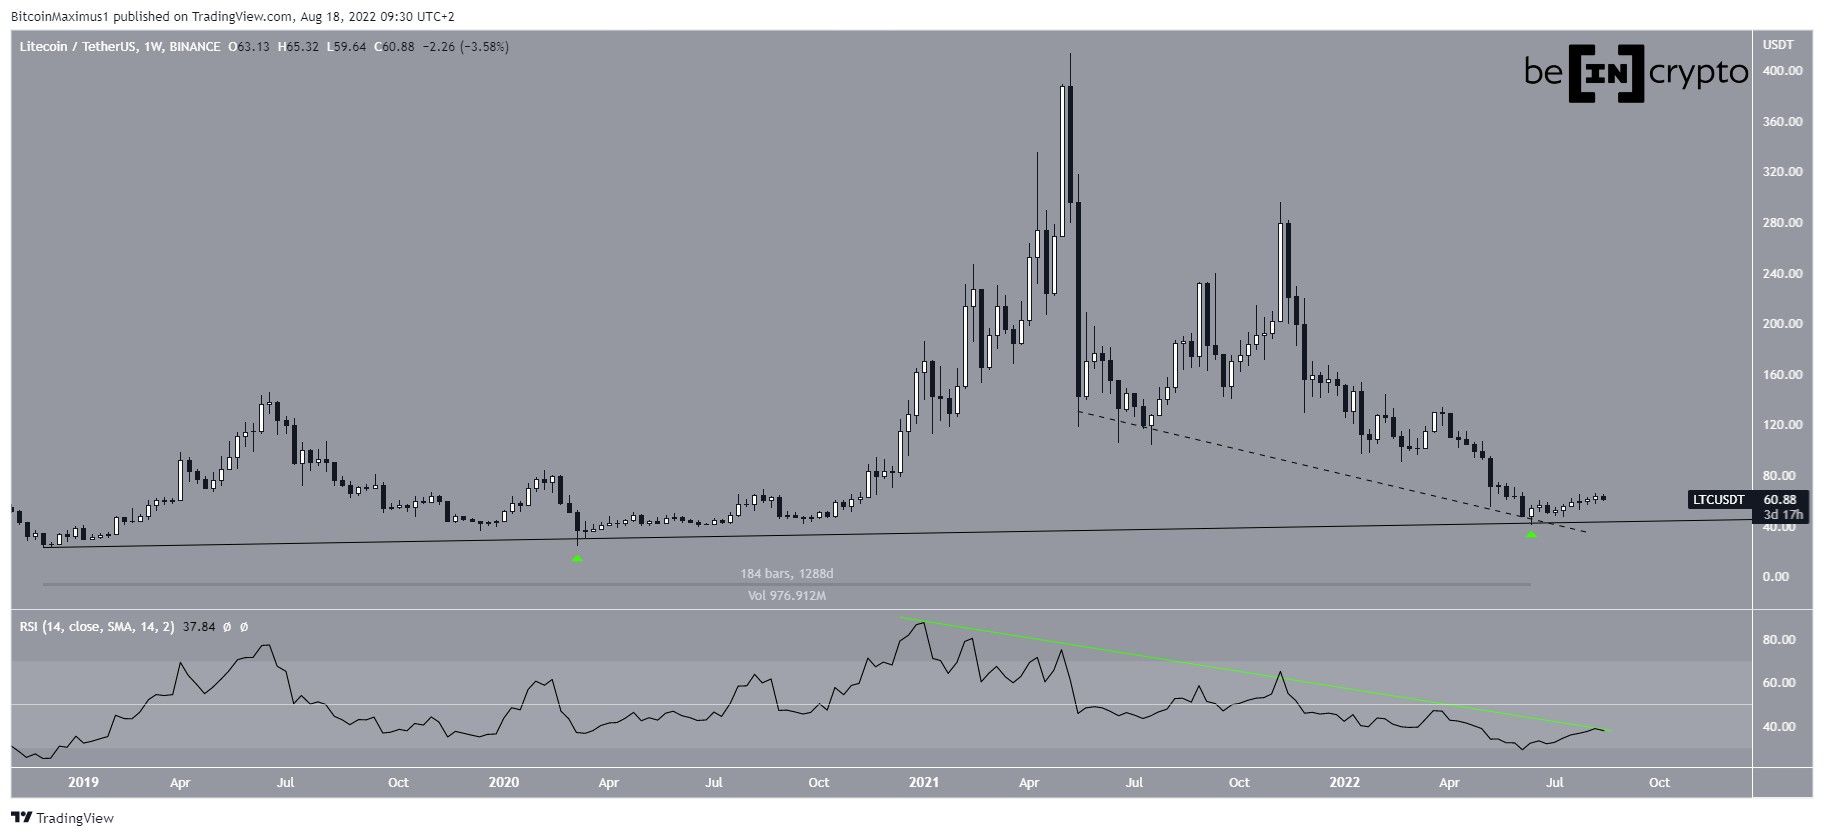
LTC has been falling since reaching a high of $413.49 in April 2021. The downward movement has so far led to a low of $40.30 in June.
Litecoin bounced afterward, validating an ascending support line that has been in place for 1,288 days. This is the third touch of the line, granting legitimacy to its slope. Furthermore, the price has also following a descending support line (dashed) since April 2021.
Despite the ongoing increase, the weekly RSI is still following its descending trend line (green). Until it breaks out from this line, the bullish reversal cannot be confirmed.
Current LTC pattern
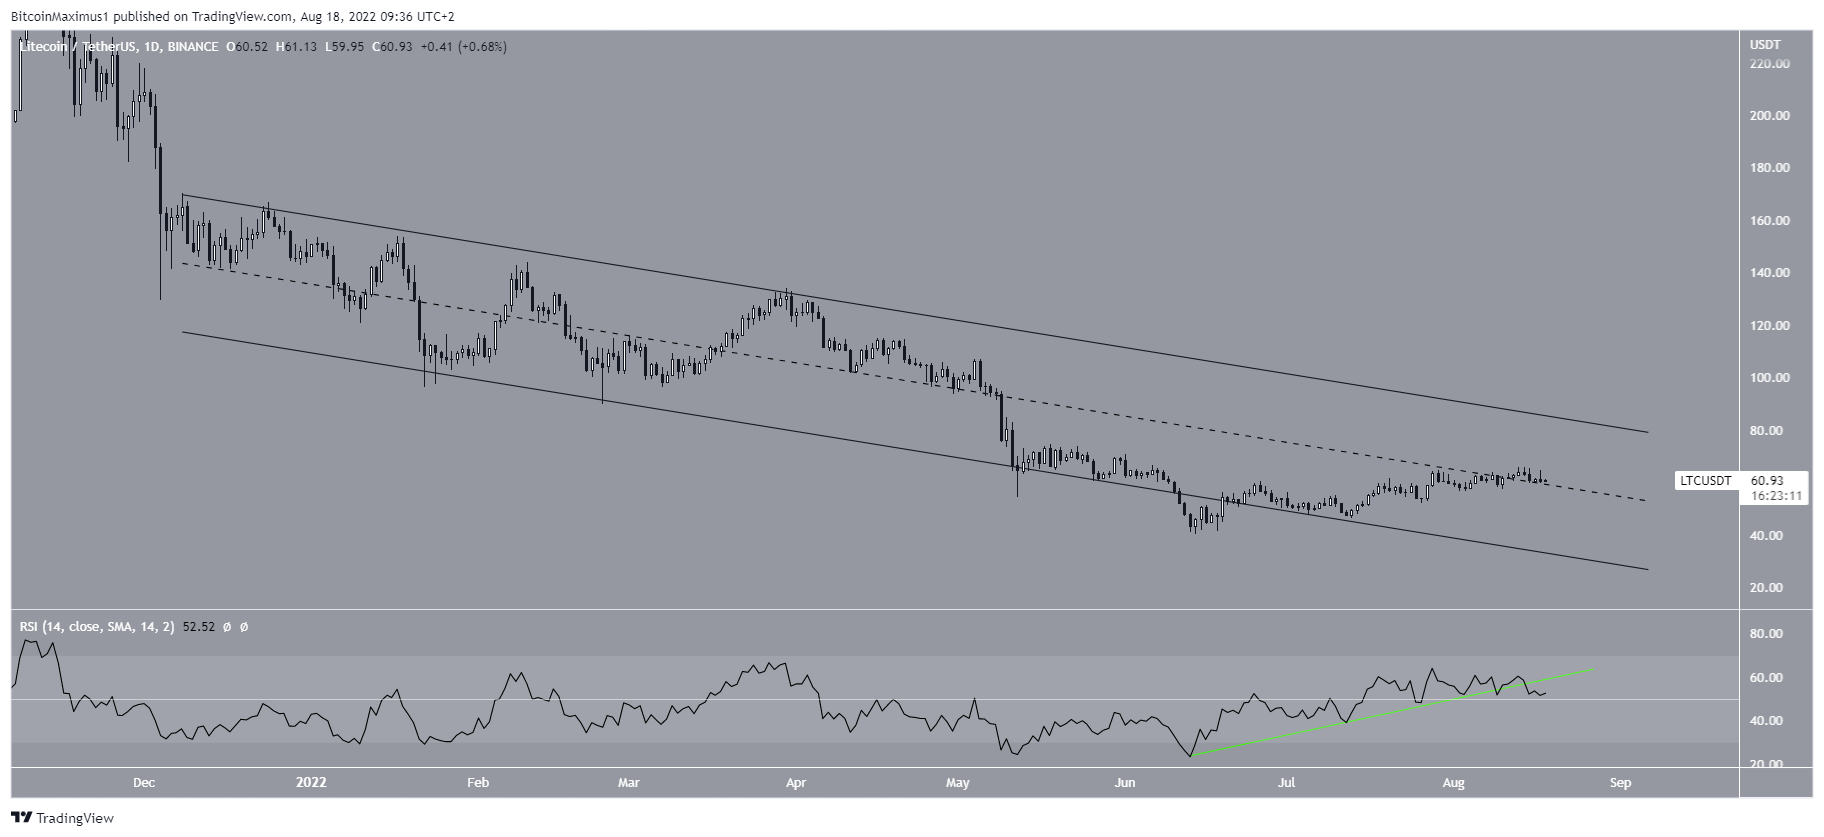
The daily chart provides several mixed signs, thus failing to confirm the direction of the future trend.
On the bullish side, LTC seems to be trading inside a descending parallel channel, which has been in place since Dec.
While it deviated below this channel on June 14, it has since reclaimed it. Currently, the price is making an attempt at moving above the midline, which would be a strong bullish sign.
However, the daily RSI is bearish, since it has broken down from its ascending support line (green line). Such breakdowns are usually signs that the upward movement has ended. A decrease below the middle of the channel would confirm this possibility.
Short-term movement
Cryptocurrency trader @Altstreetbet tweeted a chart of LTC, stating that the increase was corrective, and the price is now in a downward trend.
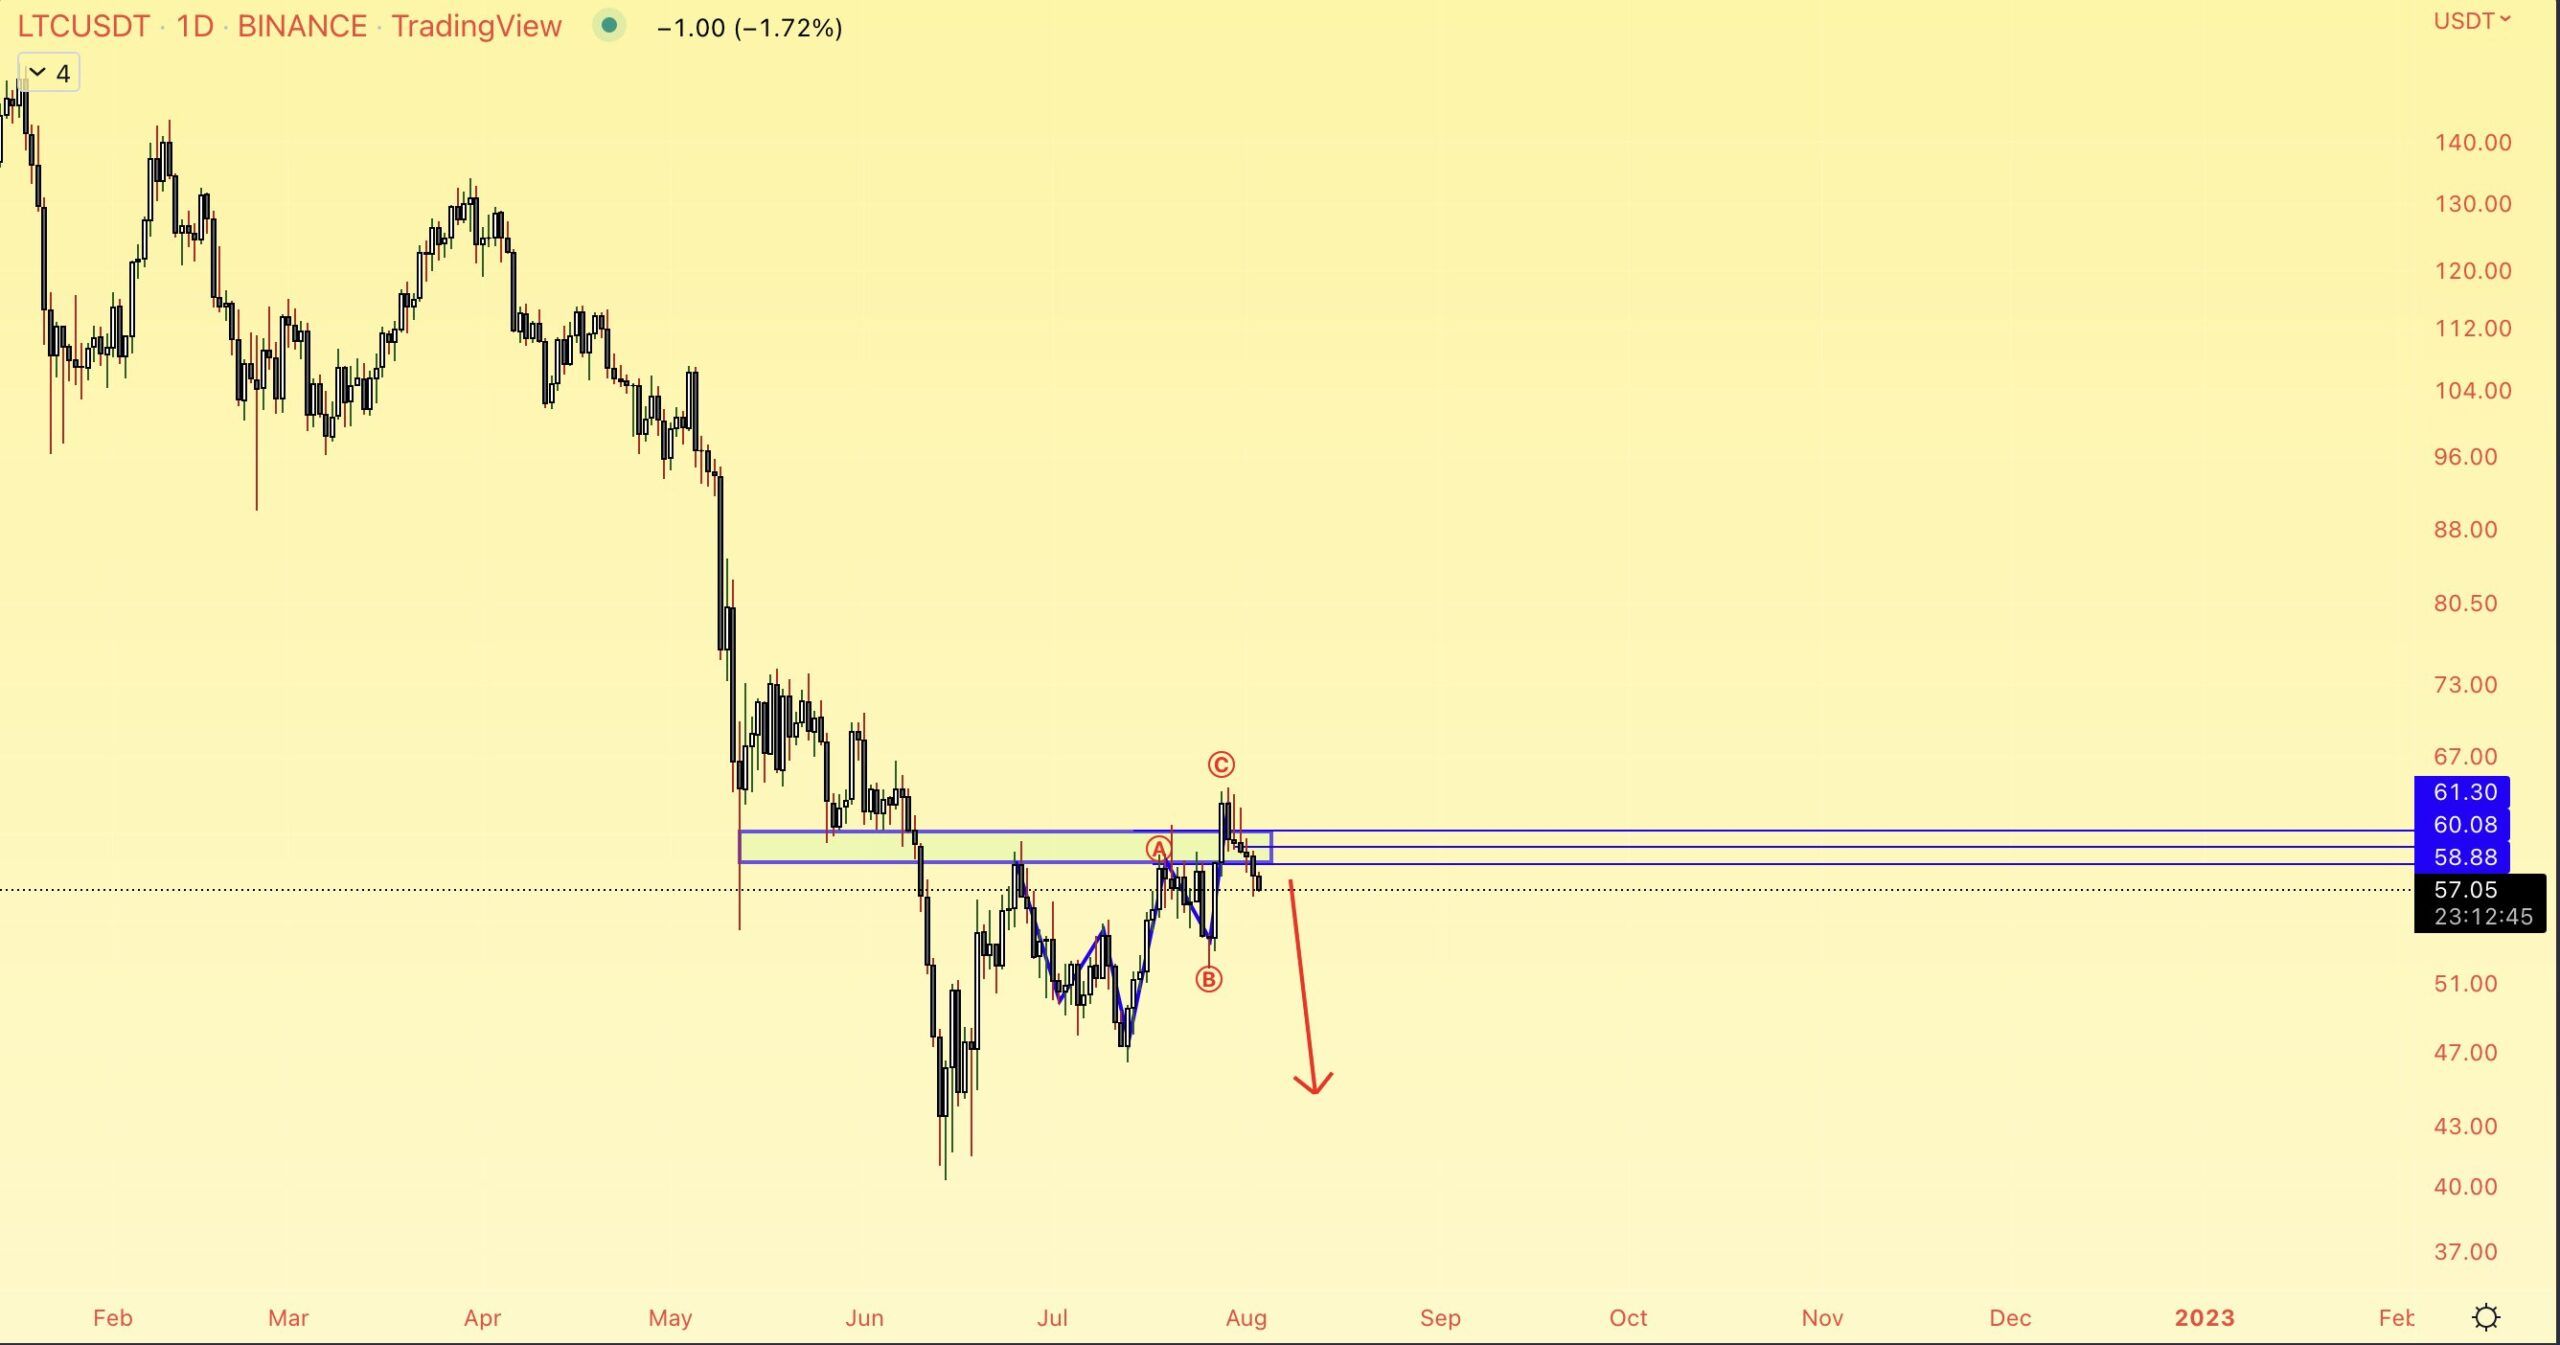
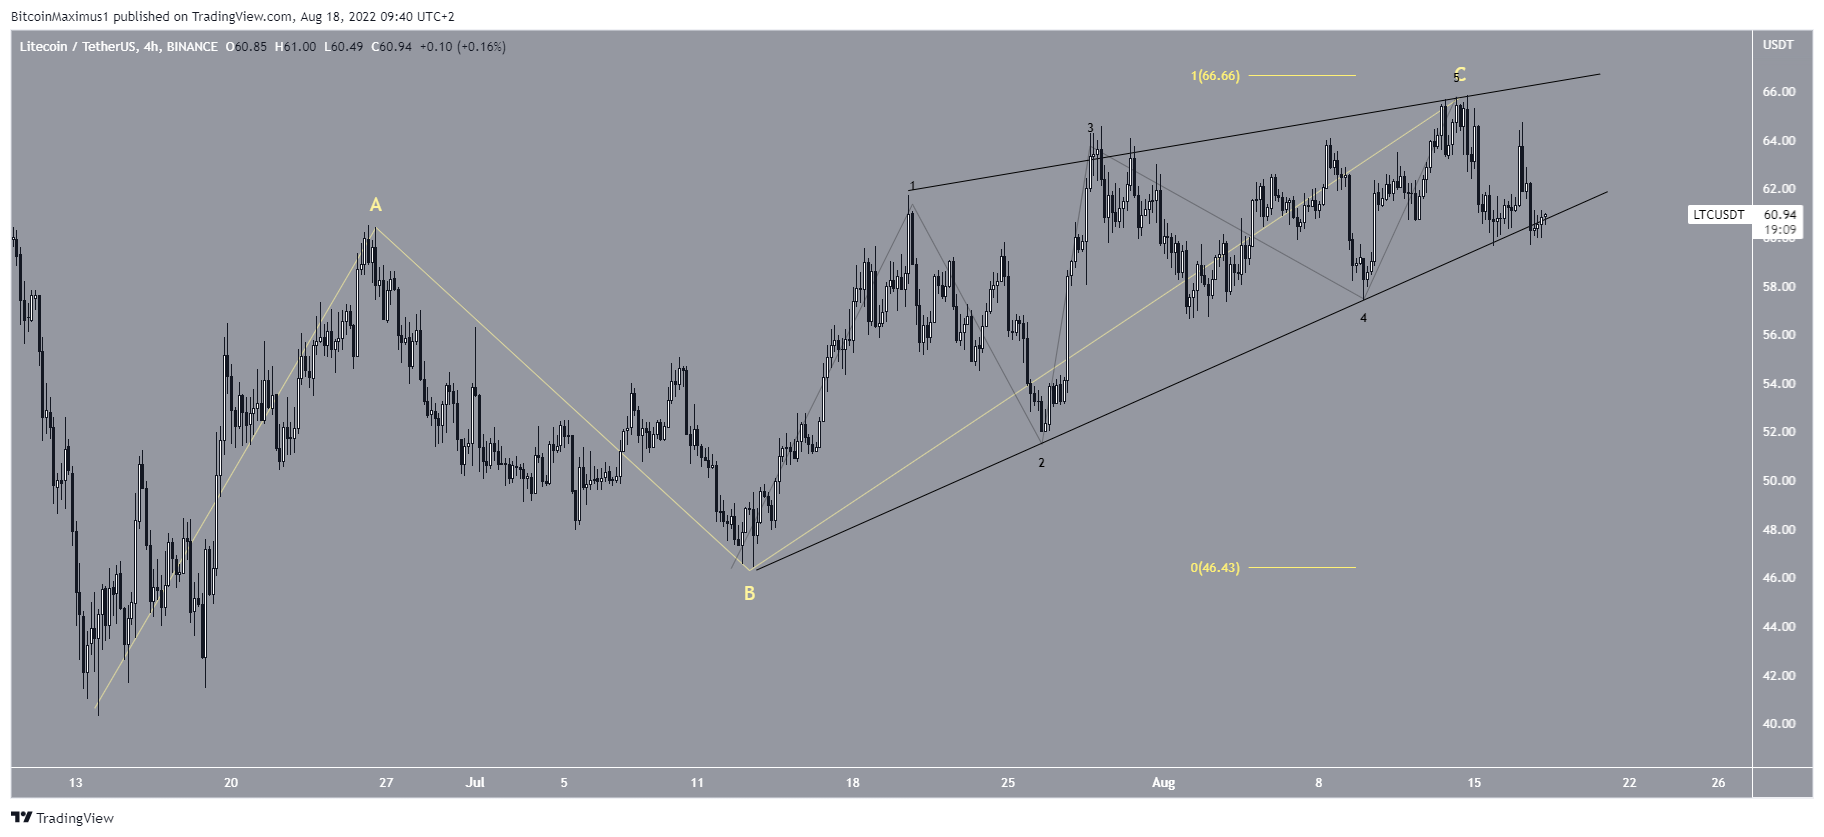
The short-term count does seem to be bearish, suggesting that the upward movement that began on June 13 is an A-B-C corrective structure (yellow). In it, waves A:C had an exactly 1:1 ratio, which is common in such structures.
Additionally, wave C developed into an ending diagonal, hence the shape of the ascending wedge. The sub-wave count is given in black.
If correct, a decrease towards at least $50 and potentially new lows would be likely.
For Be[in]Crypto’s latest Bitcoin (BTC) analysis, click here
