
The Litecoin price has successfully validated the ₿0.007 level as support and has been moving upwards since. After a short-term retracement, LTC has been increasing since reaching a low on Feb 19.
Litecoin (LTC) Price Highlights
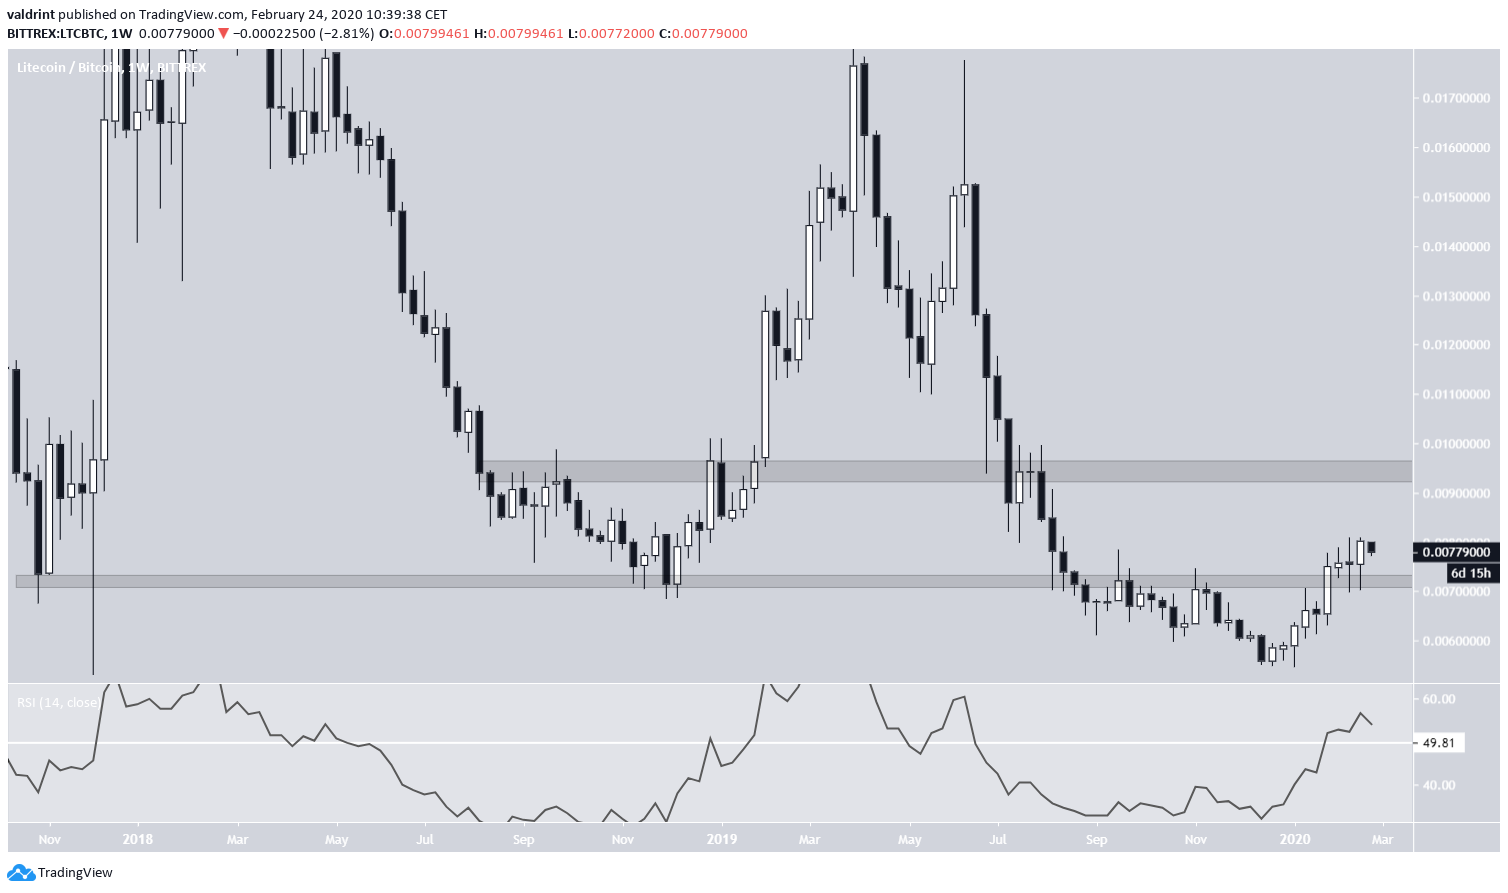
- Support and resistance levels exist at ₿0.007 and ₿0.0095 respectively.
- The weekly RSI is bullish.
- A golden cross has transpired.
- The price is trading inside an ascending channel.
Cryptocurrency investor and trader @George1Trader tweeted a Litecoin chart stating that the price movement looks very bullish. LTC has flipped the area at ₿0.007 as support and is in the process of moving upwards towards the next target at ₿0.0095.
Looks ripe. Not in this one since I'm already in ethbtc, but this looks hella bullish imo. Blue next. pic.twitter.com/Hb5SVQ6nP2
— George (@George1Trader) February 24, 2020
Weekly Outlook
The Litecoin price has indeed flipped the ₿0.007 area as support with a strong bullish candlestick last week. This area has been historically significant, most notably in October 2017 and December 2018 when it provided support.
The weekly RSI has clearly moved above 50, a sign that the downward trend has ended and LTC wants to move upwards.
The next resistance area is found at ₿0.0095.
Ascending Channel
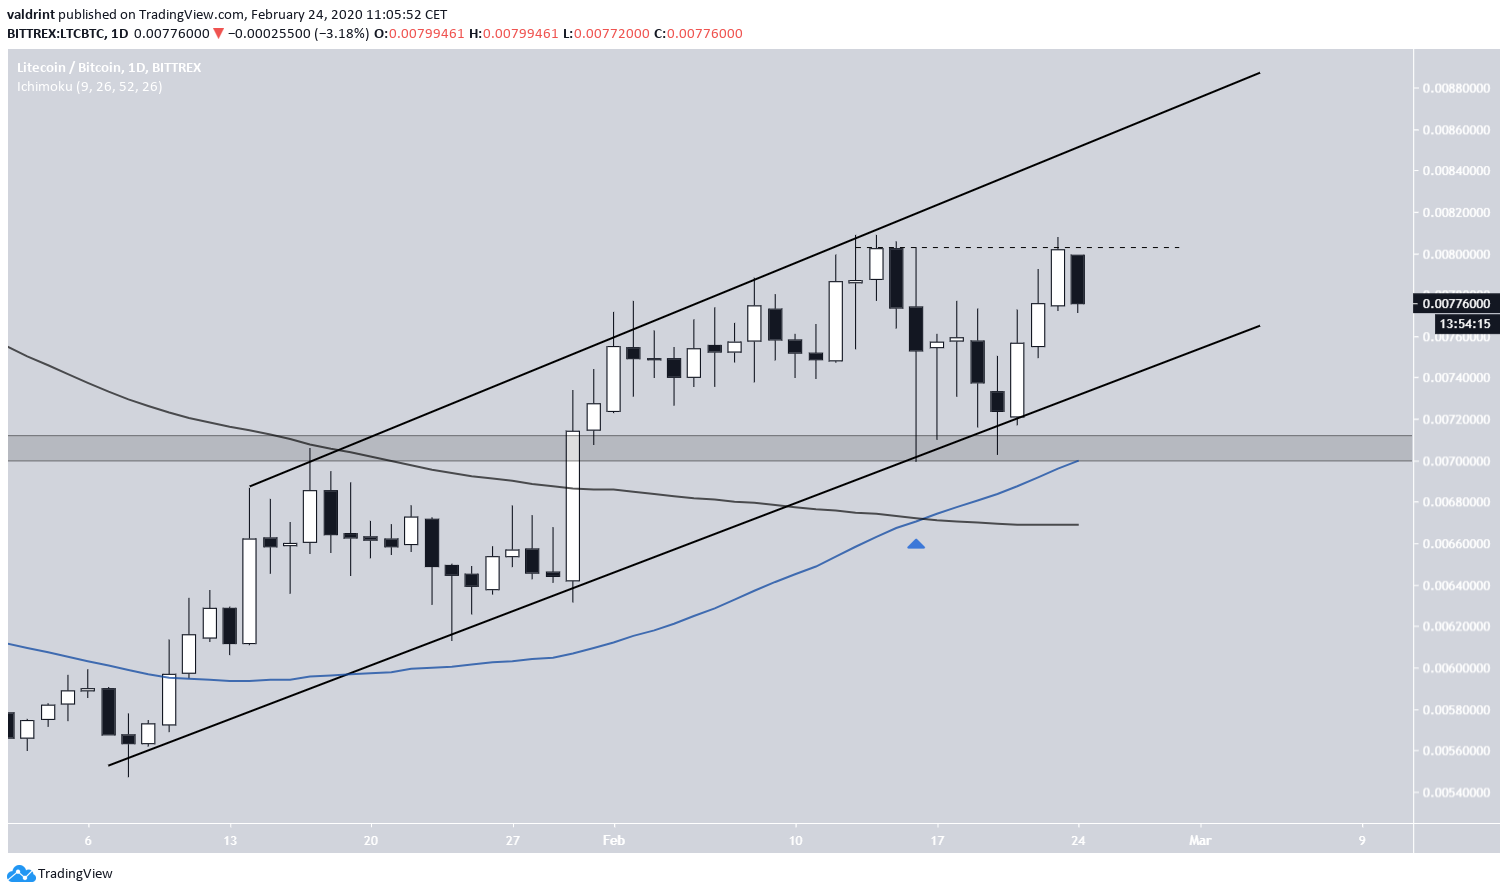
The Litecoin price has been trading inside an ascending channel since Feb 8, having validated both the resistance and support lines numerous times. The price touched the support line on Feb 19 for the final time and has been increasing since.
A bullish cross between the 50 and 200-day moving averages (MA) transpired on Feb 13 and the price is trading above both these MAs, a sign that it wants to continue moving upwards.
However, the possibility remains that LTC creates a double top and decreases instead.
Possible Double Top?
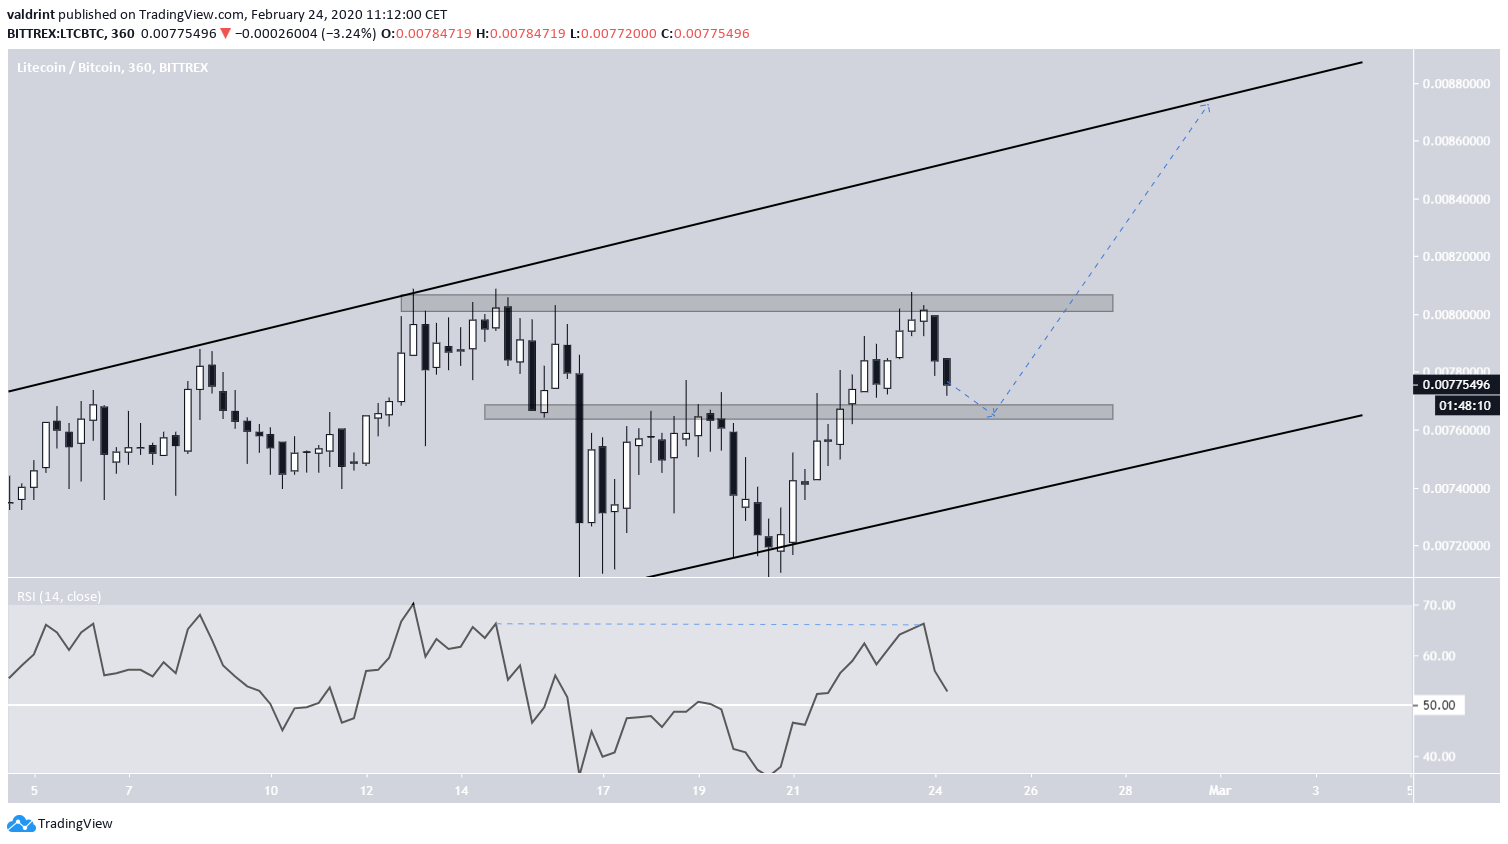
We can see that the RSI shows no bearish divergence whatsoever to indicate a price decrease.
Also, the price has flipped the minor ₿0.0075 level as support. After possibly validating it once more, which would also cause the RSI to validate the 50-line, the price is expected to move upwards and reach the resistance line at ₿0.0087.
If the price continues to increase at the rate predicted by the channel, it would reach the resistance area of ₿0.0095 outlined in the tweet around March 20.
To conclude, the LTC price has been increasing since touching the support line of its channel on Feb 19. The increase will likely continue until the price reaches the resistance line of the same channel.
