
The Litecoin price began April 10 on a bullish note, increasing all the way to ₿0.00645. However, a swift downward move followed, and the price has decreased by almost 5% since.
It is possible that the decrease occurred as a result of a similar decrease in the price of Bitcoin. Another possibility is the similarity of the current short-term pattern to one in March, which similarly led to a breakdown.
Cryptocurrency trader and analyst @TradingTank outlined an LTC chart that shows that the price is currently trading inside a symmetrical triangle. This movement has been seen prior, more specifically on March 9, and was followed by a very rapid decrease.
Do you like my $LTC drawing? #Chartwork pic.twitter.com/ZfwXwHZVN2
— Trading Tank (@TradingTank) April 9, 2020
Will the LTC price decrease this time around? If so, where will it find support? Continue reading below if you are interested in finding out.
Daily Time-Frame
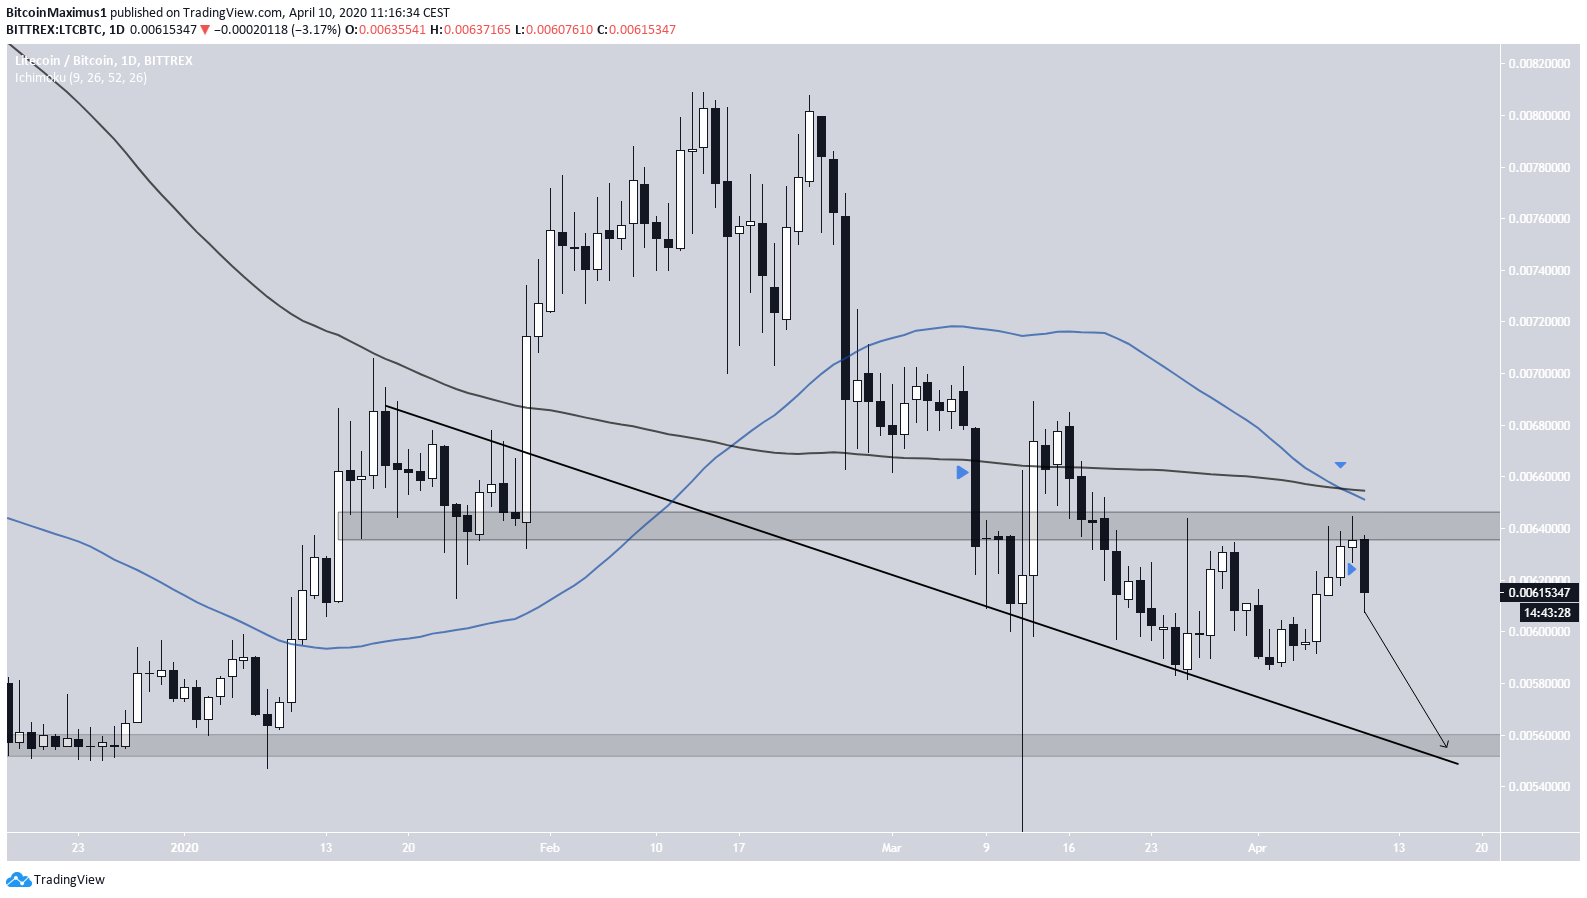
The daily time-frame gives a bearish outlook.
The price was just rejected by the ₿0.0064 resistance area and is in the process of creating a bearish engulfing candlestick. The symmetrical triangle outlined in the tweet occurred during the similar bearish engulfing candlestick on March 8, as outlined by the blue arrow. If a similar decrease transpires this time around, the LTC price would be expected to fall to the descending support line, which coincides with the ₿0.0056 support area.
The bearish cross between the 50- and 200-day moving averages (MA) supports the possibility of this decrease occurring.
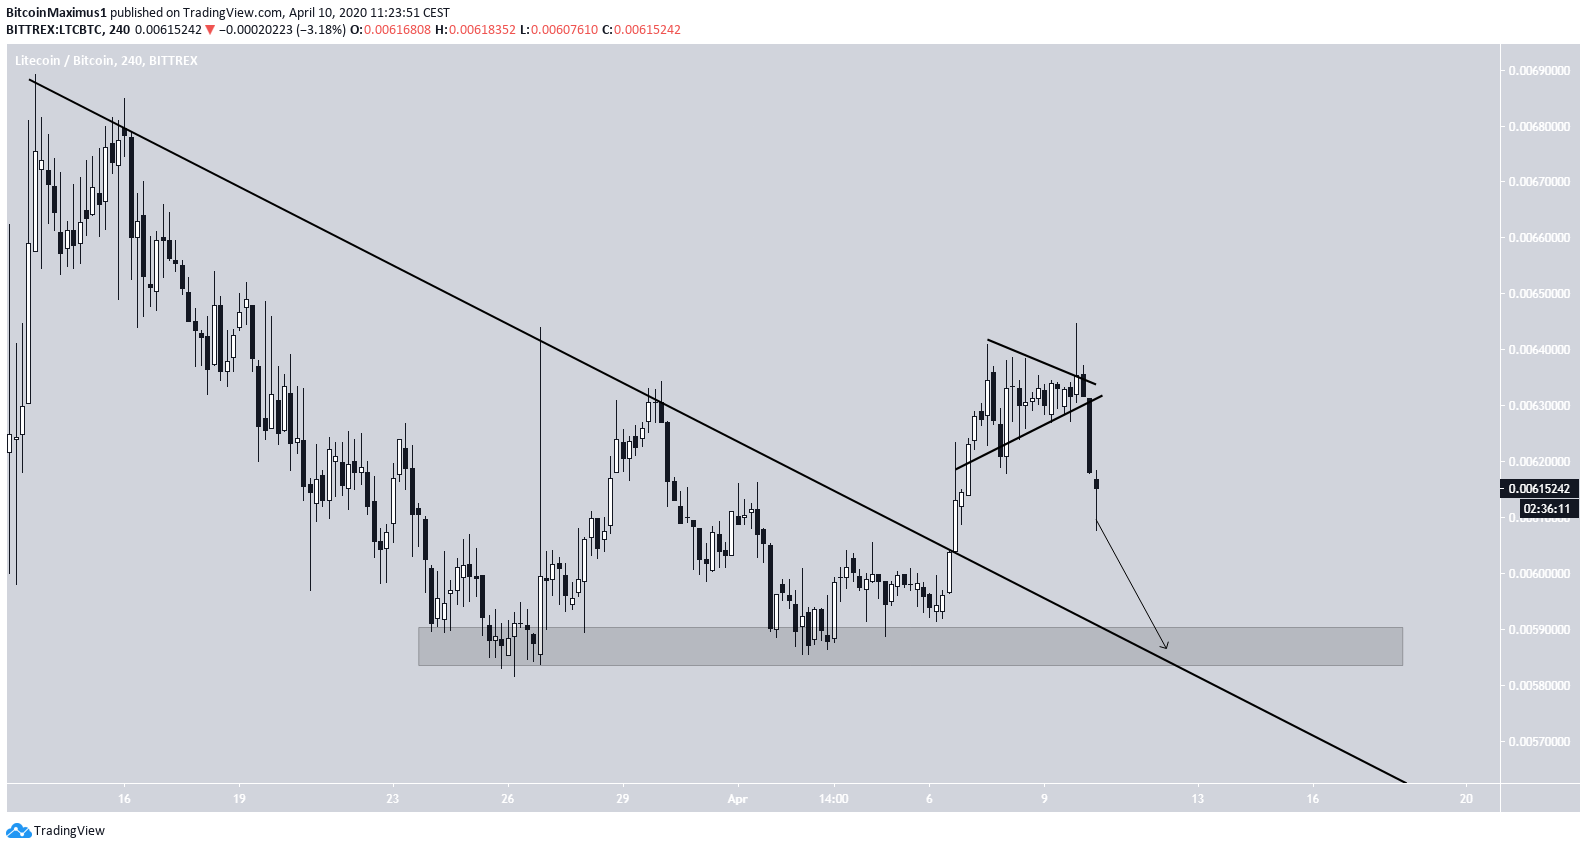
Symmetrical Triangle
Since the tweet, the LTC price has already broken down from the triangle. In the short-term, the most likely movement would be a re-test of both the descending resistance line the price has just broken out from and the ₿0.0058 support area. This area could provide some short-term relief before the price heads towards the support area outlined in the previous section.
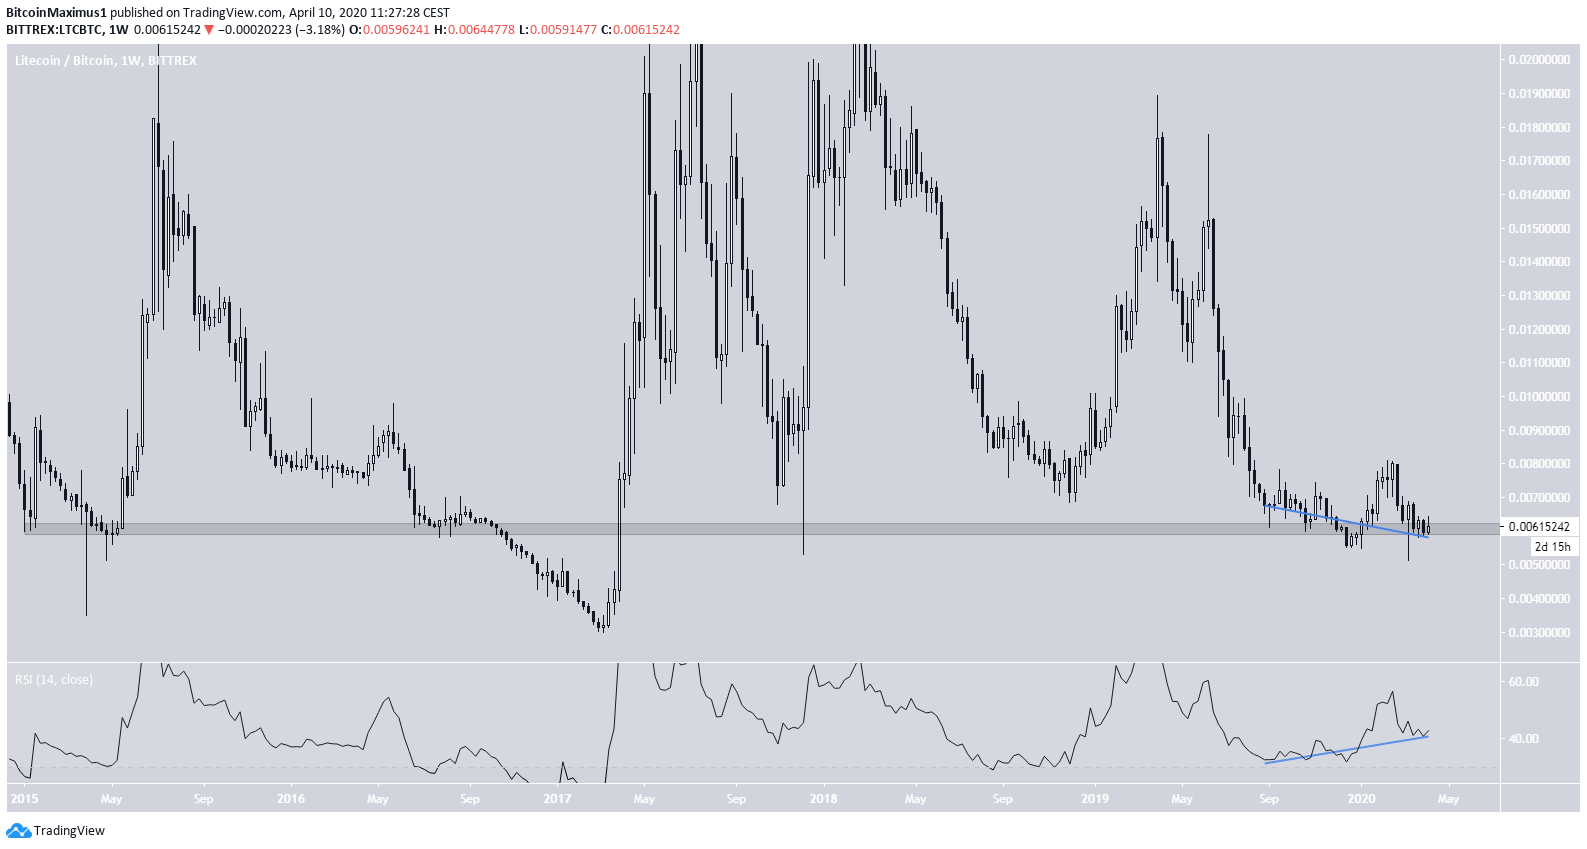
Long-Term Movement
The weekly chart shows that the LTC price is still trading inside a very strong support level that has previously been the catalyst for the initiation of a long-term upward move. In addition, the weekly RSI has generated considerable bullish divergence.
As long as the LTC price does not reach a decisive weekly close below this level, the current decrease is expected to be a short-term occurrence, and the price is expected to eventually begin a long-term upward move.
To conclude, the LTC price has broken down from its short-term pattern and is expected to continue decreasing until it reaches one of the support areas outlined above. However, the price is still trading inside a long-term support area. As long as it stays above it, the current decrease is not considered a breakdown from the long-term trend. Rather, the price is expected to eventually begin a new, long-term upward move.
