


The Litecoin price has been sinking since Jan 17. It is trading inside a symmetrical triangle, of which it looks close to breaking out to the upside.
Litecoin Highlights
- The Litecoin price is trading inside a symmetrical triangle.
- It is facing resistance from the 200-day moving average (MA).
- The RSI supports a price increase.
- The closest resistance area is found at ₿0.0071.
- The closest support area is found at ₿0.0061.
On Jan 14, the Litecoin price broke out above a long-term resistance line, possibly signaling the end of the downward trend. However, the price quickly reached a high and has been decreasing since. Cryptocurrency trader Crypto Krillin tweeted a Litecoin price chart, in which the price is trading inside a symmetrical triangle. He believes that the price will break out from this triangle.
Forgot to update as I closed it when it started to retrace after the second target… should have sticked to the original setup lol.
Now forming a nice triangle, beautiful PA, only noticing now thanks to @IrnCrypt, would have loved an entry on the diag. Not gonna fomo here pic.twitter.com/ue5YCOjJq4
— krillin ॐ (@LSDinmycoffee) January 29, 2020
Moving Average
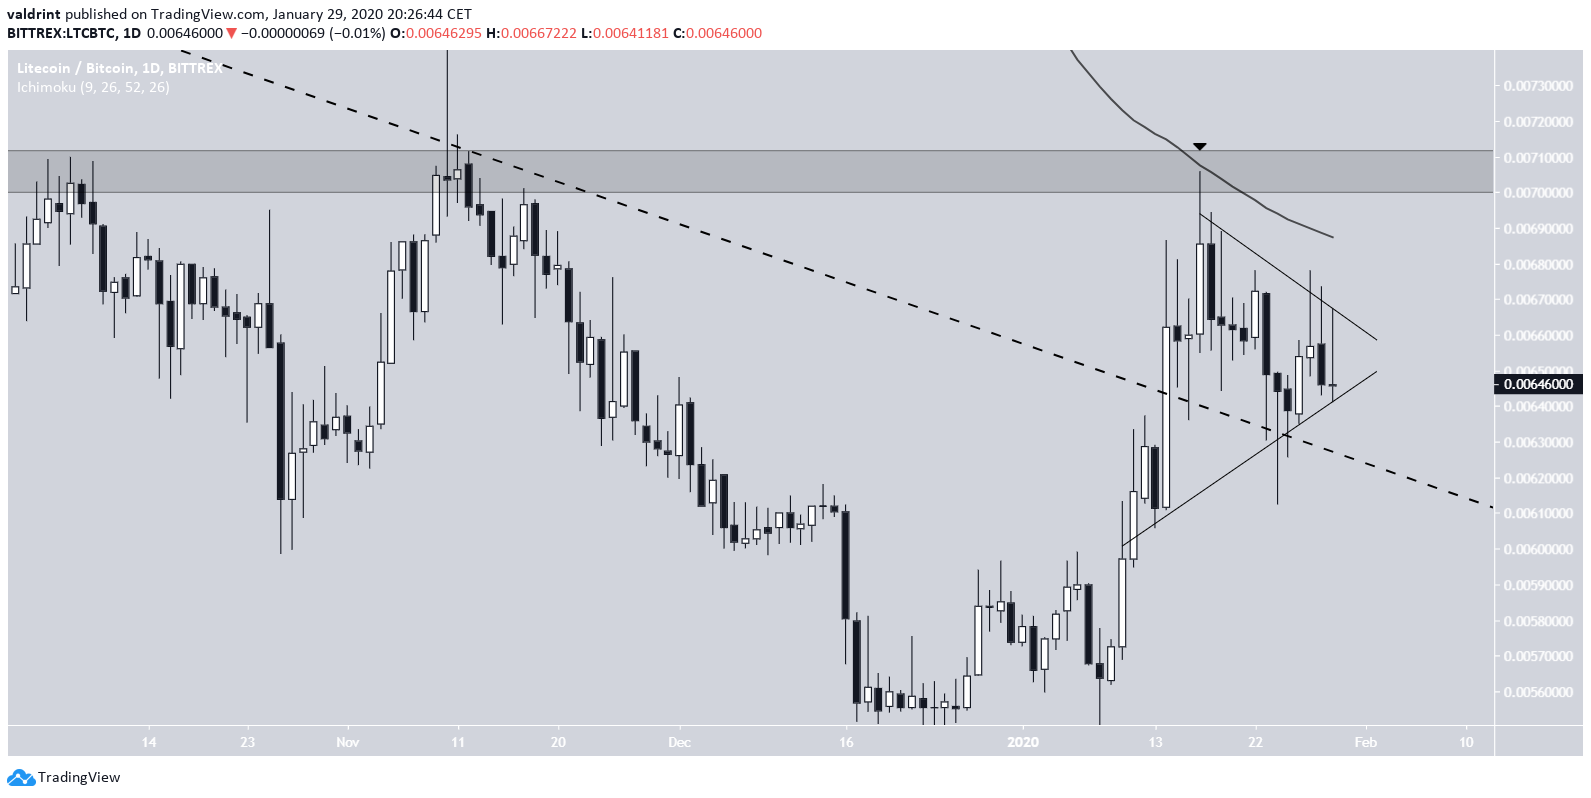
The Litecoin price previously broke out from a long-term descending resistance line. Afterward, the price decreased and validated this line as support, a customary movement after price breakouts.
However, the price is facing close resistance from its 200-day moving average (MA). Furthermore, if it breaks out above this very significant MA, it is likely to face resistance at the ₿0.071 area. Therefore, the potential for upside seems limited, at least in the short-to-medium term.
Symmetrical Triangle
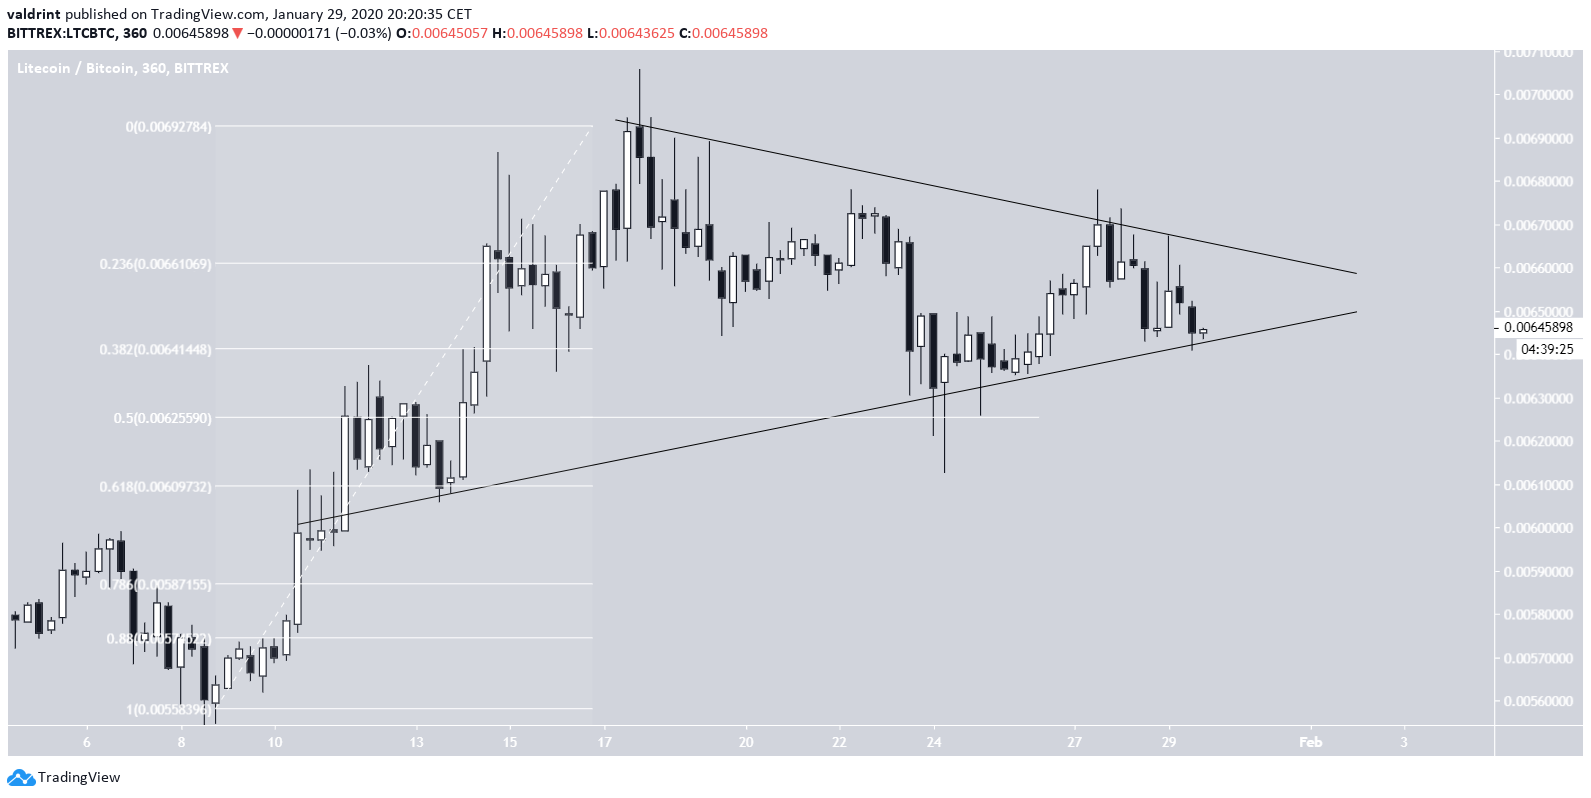
The Litecoin price is indeed trading inside a symmetrical triangle, having done so since Jan 11. In addition, the price has likely completed the correction following the aforementioned upward move, since it bounced perfectly at the 0.5 fib line. BeInCrypto predicted this reversal in our previous analysis.
At the time of publishing, the price was approaching the projected end of this triangle.
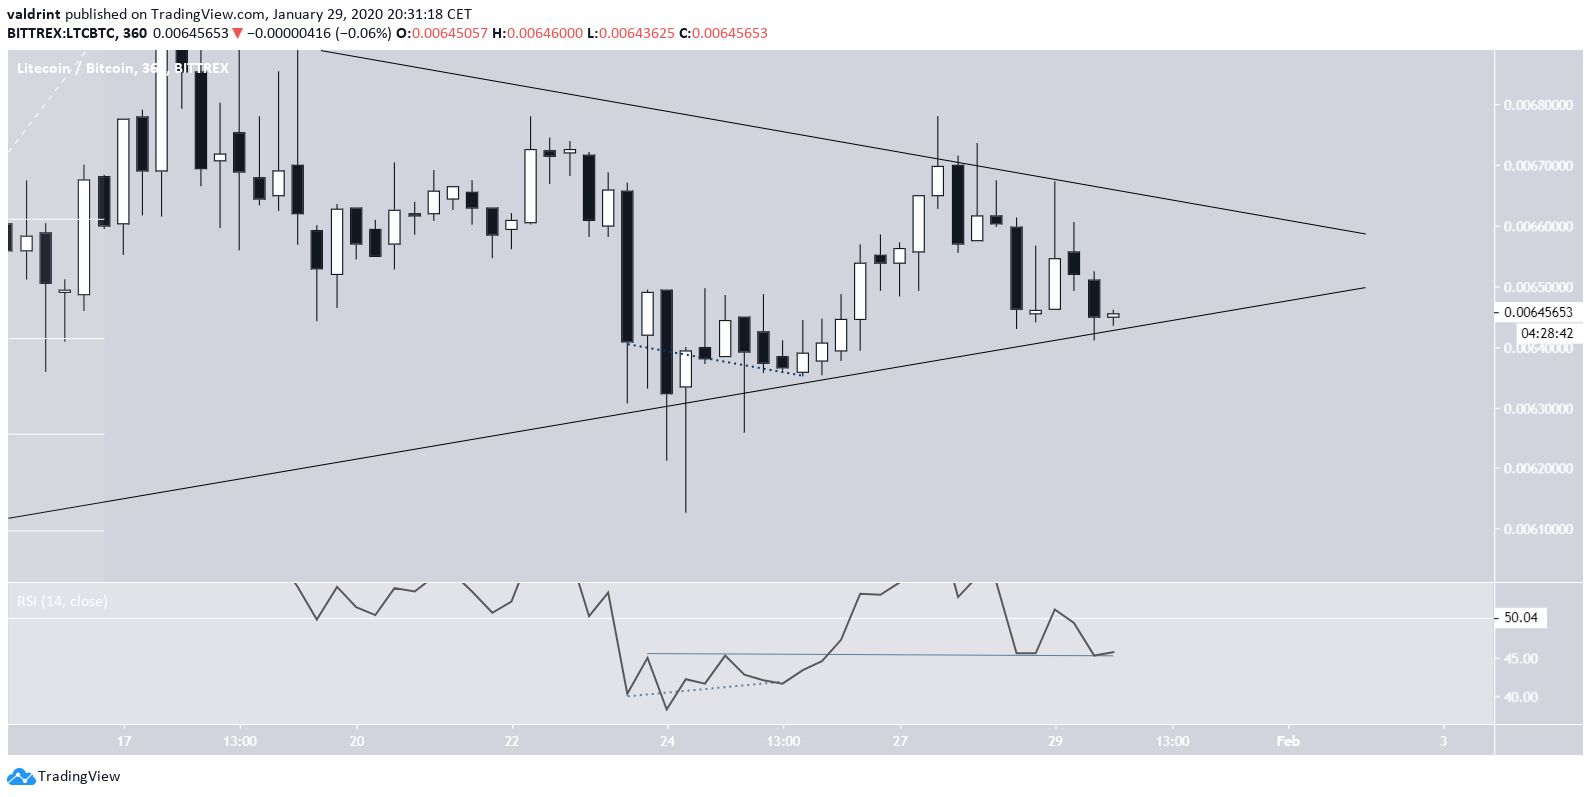
The price looks likely to break out from this pattern, primarily because the symmetrical triangle is considered a reversal pattern, so a breakout would be expected after an upward move.
In addition, the RSI has completed a failure swing bottom after generating bullish divergence. This is often a sign of reversal, especially since the RSI has been holding above the support area.
Future Movement
If the Litecoin price breaks out, it could increase all the way to the resistance area. On the other hand, a slightly more bearish scenario would have the price decrease to validate the resistance line once more, possibly inside the ₿0.0061 support. Afterward, it should similarly increase towards ₿0.0071.
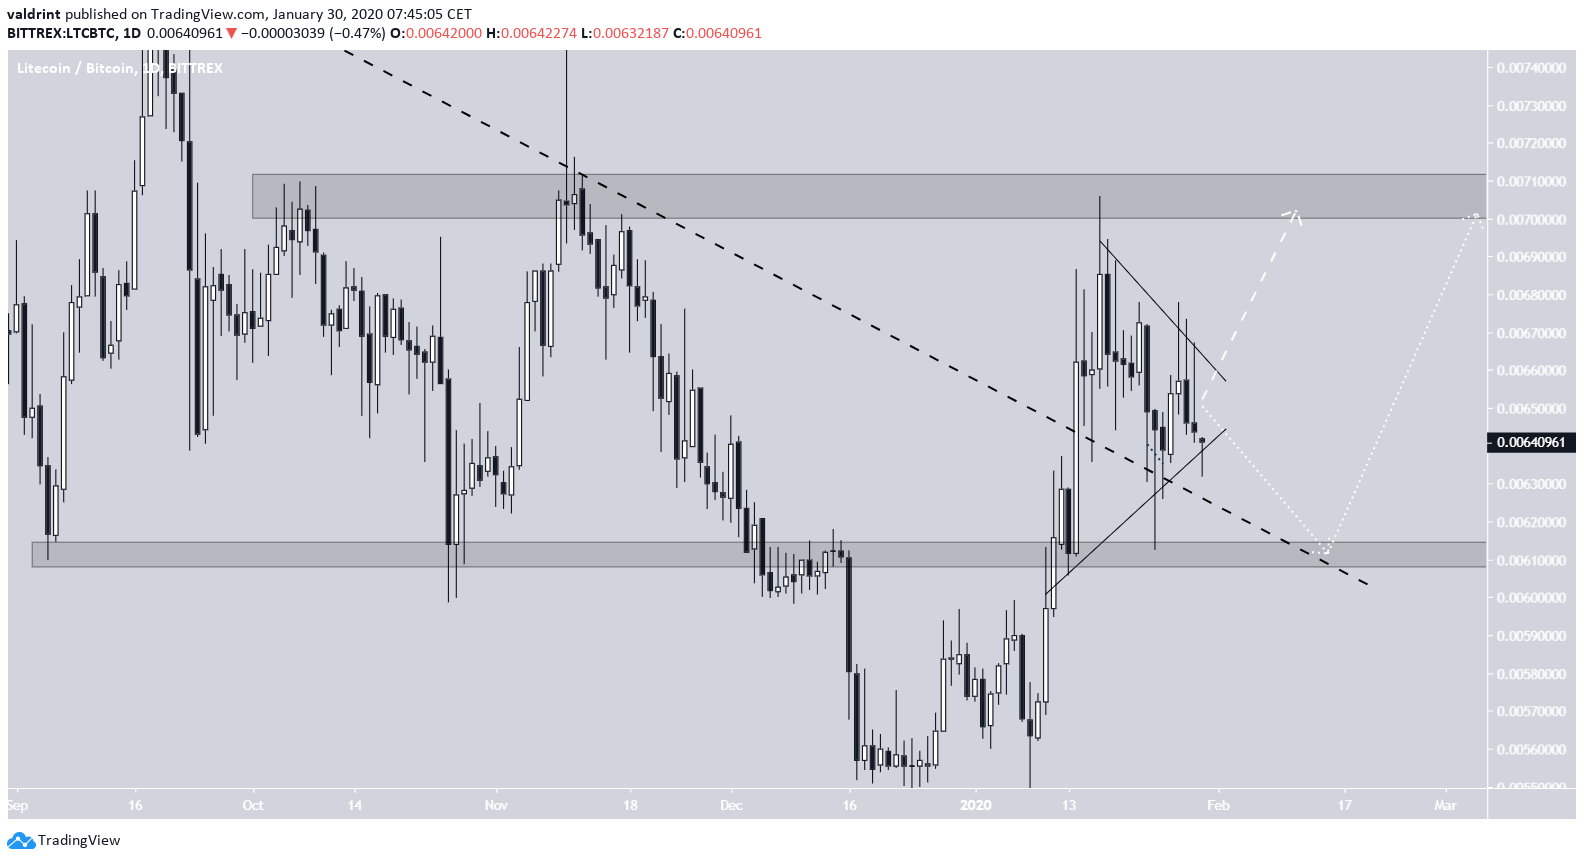
To conclude, the Litecoin price previously broke out above a significant resistance line and validated it as support. It is currently trading inside a symmetrical triangle out of which it looks likely to break out of and continue to increase towards ₿0.0071.


