


![Litecoin Price’s Relationship With This Moving Average Will Determine Its Trend [Premium Analysis]](/_mfes/post/_next/image/?url=https%3A%2F%2Fassets.beincrypto.com%2Fimg%2F7ZRc5XOfLlhyVfaL7LQ18Y2_-gM%3D%2Fsmart%2F714a5ddfcd8247be837fb8abcfc9fd6a&w=1920&q=75)
On January 14, the Litecoin price broke out above the descending channel it had been trading in since August 14, 2019. Until the price breaks out above its 200-day moving average (MA), we cannot confidently state that it has begun a new upward trend.
Litecoin Price Highlights
- The Litecoin price broke out from a long-term descending channel.
- There is resistance at ₿0.007 and ₿0.0078.
- The 200-day MA is providing close resistance to the price.
- The price has shown some short-term weakness.
- There is support at ₿0.0064.
Crypto trader @Crypto__DC stated that the Litecoin price looks primed for a breakout, and suggested buying once the price does so.
$LTC looking amazing for big move in coming days. buy at breakout$BTC pic.twitter.com/Zo0CYlOPWm
— CryptoDC (@CryptoDC_) January 21, 2020
Will the LTC price breakout? If so, where would be the optimal place to enter the trade? Keep reading below if you want to find out.
Possible Breakout
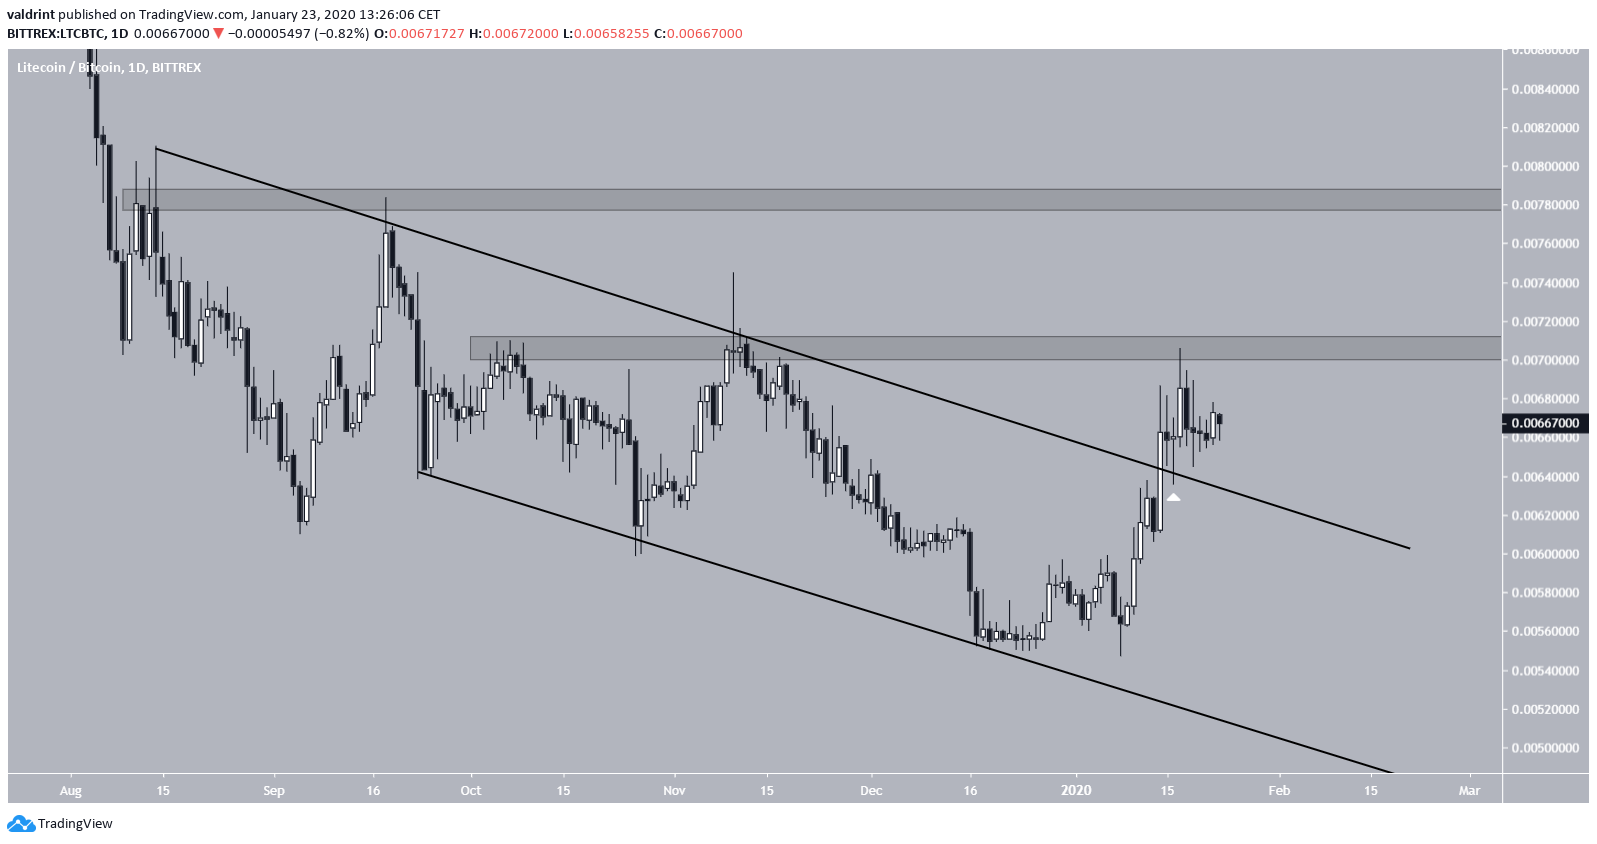
We are using a slightly different resistance line, mainly due to its relationship with the descending support line. If we use the closing prices instead of the wick highs, which is common in cases in which wicks have considerable length, the Litecoin price was trading inside a parallel descending channel since August 14, 2019.
On January 14, 2020, the price broke out above this channel. It reached the resistance area at ₿0.007 and retraced slightly. If the price continues to increase, the next resistance area is found at ₿0.0078.
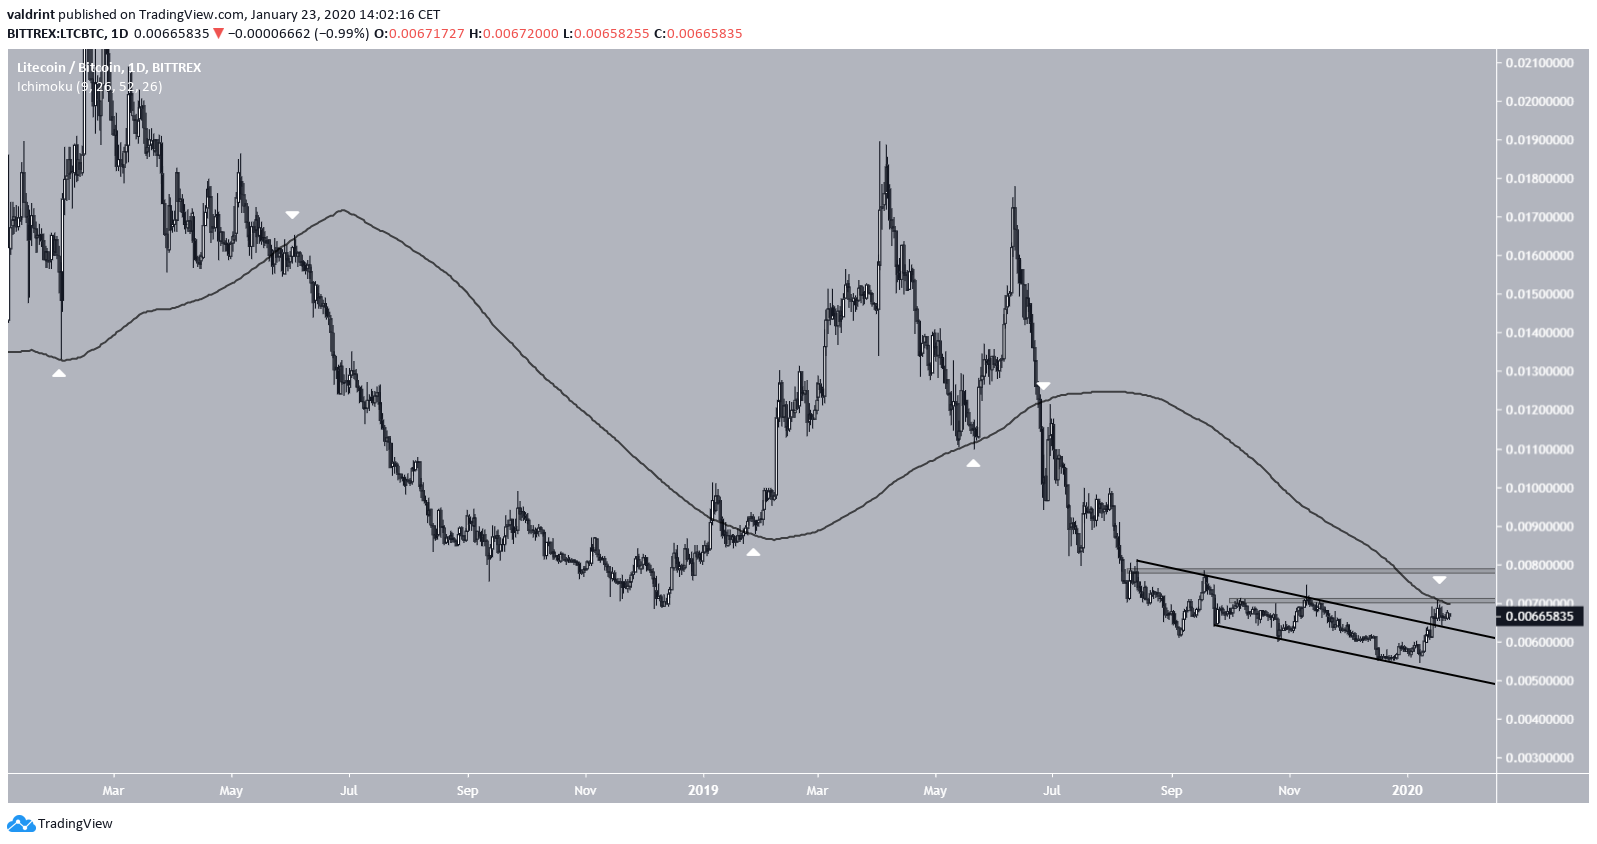
Looking at Litecoin’s price history since 2018, we can see that the 200-day MA has been a relatively good measurement of the direction of LTC’s trend.
Whenever the price is trading above this MA, the trend is bullish and vice versa. While the recent breakout was legitimate, it failed to flip the 200-day MA, rather decreased once it reached it. Until the price successfully flips it, we cannot confidently state that it is in an upward trend.
Corrective Period
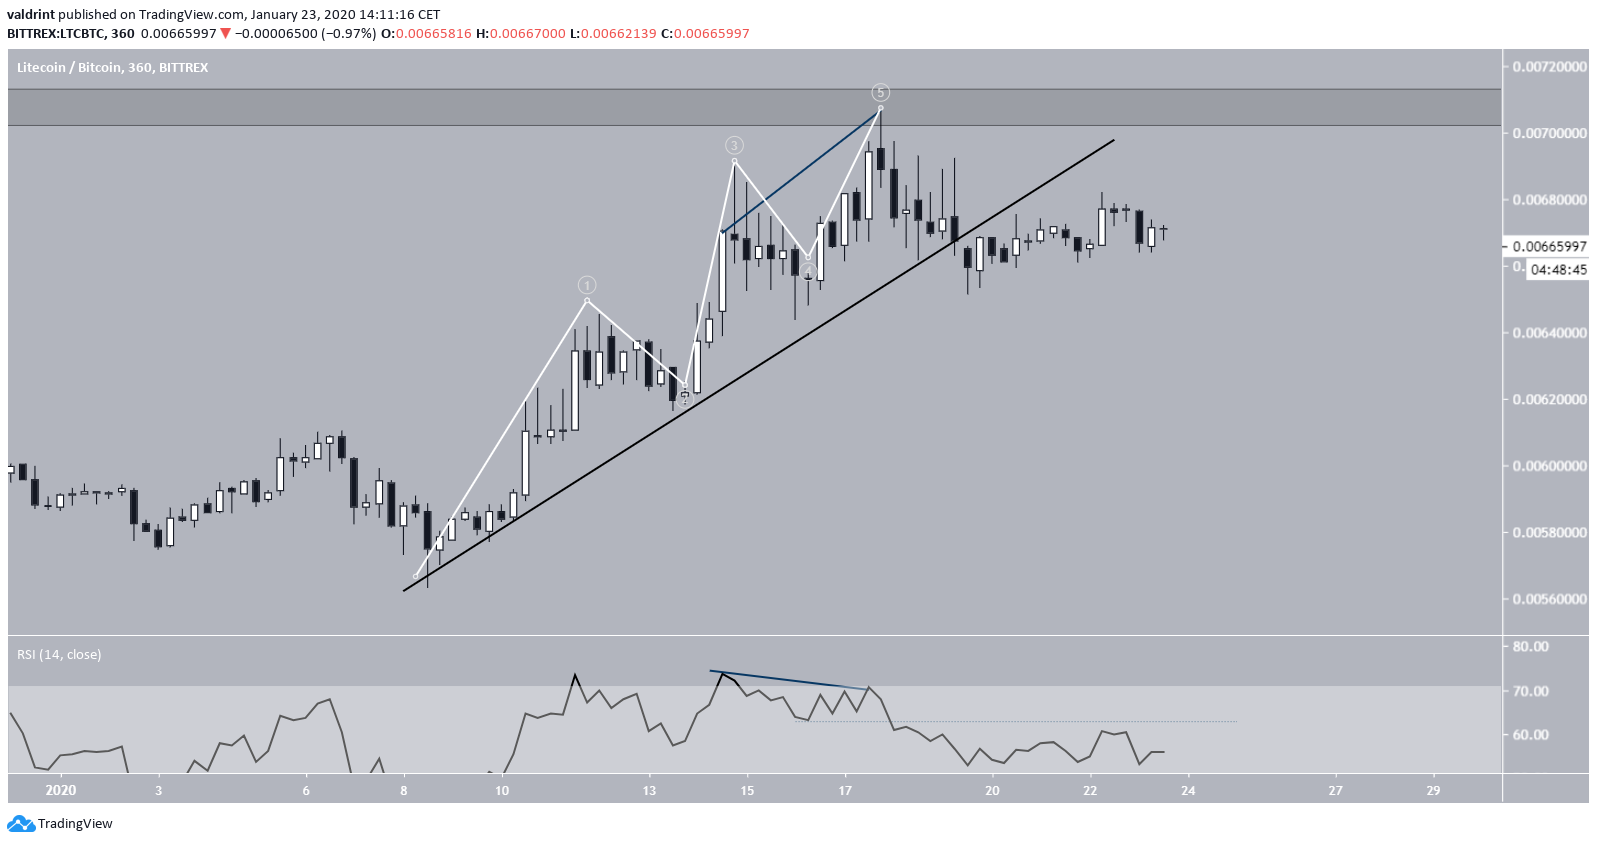
Beginning on January 8, the LTC price completed a five-wave Elliott formation. Afterward, the price broke down from the ascending support line that had been measuring the rate of increase.
The breakdown was preceded by bearish divergence in the RSI, which later completed a failure swing top.
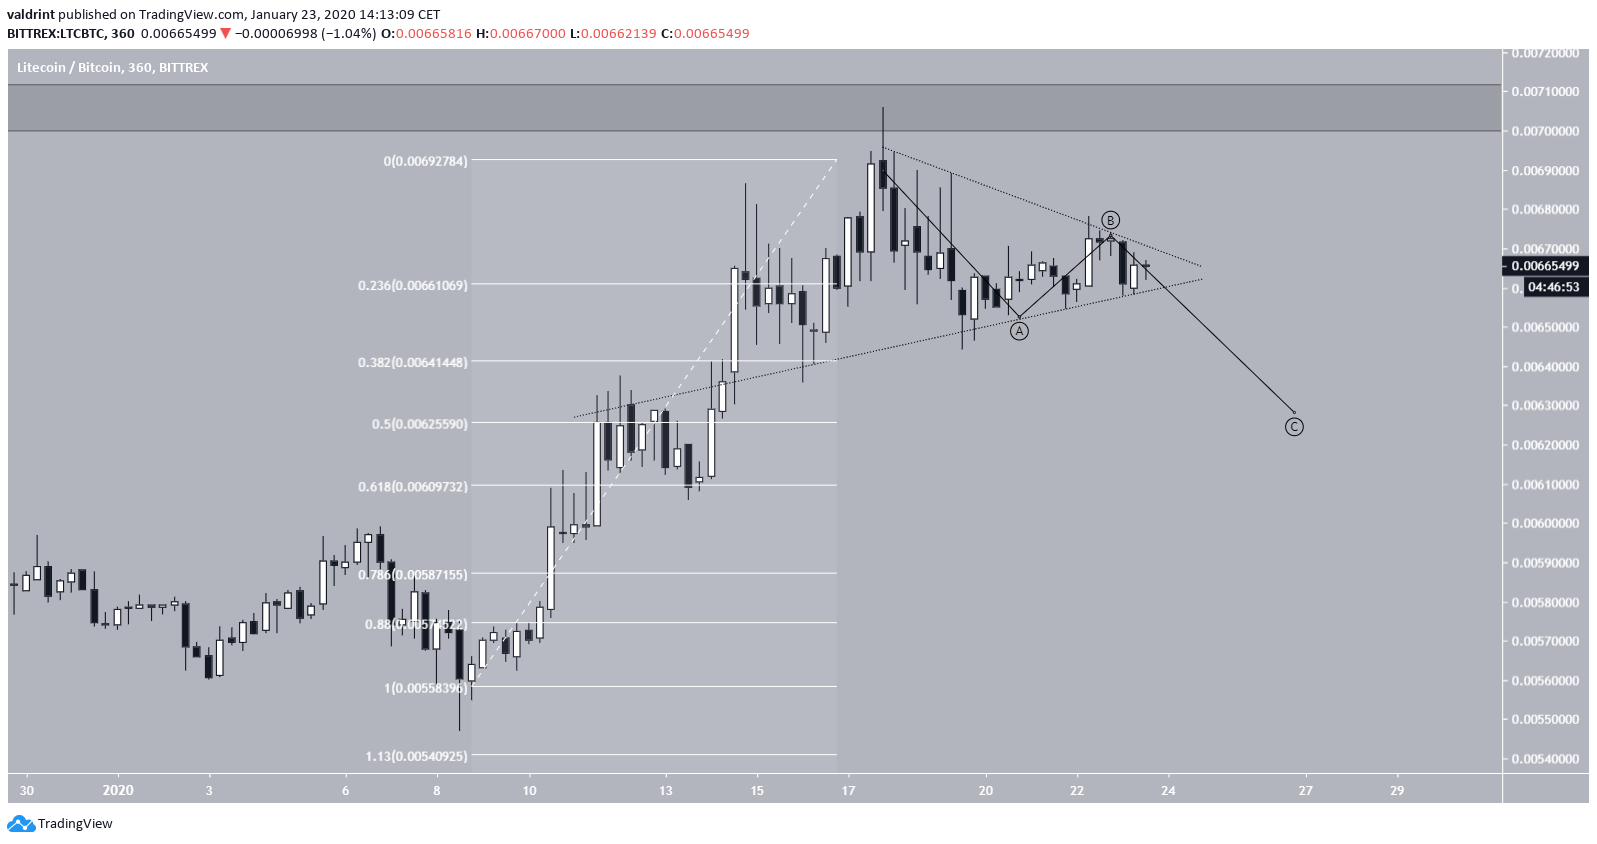
In the future, the customary movement would be for LTC to complete an A-B-C correction that ended near ₿0.0064, the 0.5 fib level of the entire upward move.
To go back to the question presented in the beginning, this would present the optimal level of entering the trade in anticipation of an upward move.
To conclude, while LTC broke out above a long-term resistance line, we cannot confidently state that it is in an upward trend. We believe a short-term correction towards 0.0064 is likely before the price resumes its upward movement. As long as the price is trading below the 200-day MA, we cannot state that it has begun an upward trend.
