
ChainLink (LINK) has been increasing since bouncing above the $19 support area on May 23. However, it has yet to reclaim any important resistance levels.
It is trading inside a short-term descending parallel channel, from which a breakout is expected.
Long-term LINK movement
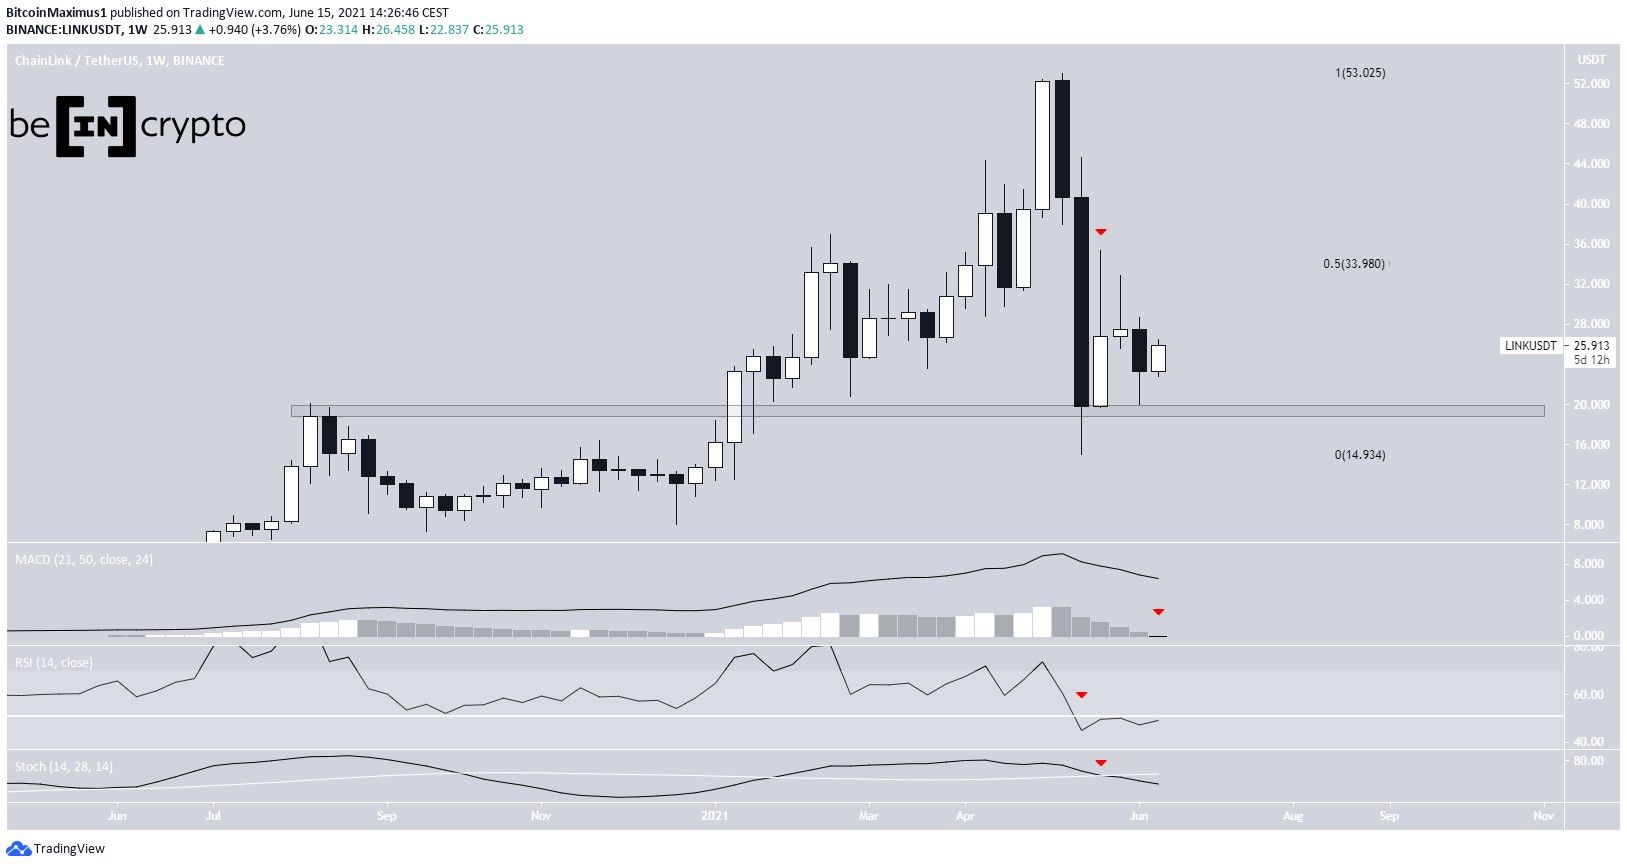
LINK has been decreasing since May 10, when it reached an all-time high price of $53. It fell to a low of $15 on May 23 before bouncing sharply. The drop validated the $19 area as support.
There is resistance at $33.9, which was touched during the week of the bounce, leaving a long upper wick in place (red icon). This is the 0.5 Fib retracement resistance level.
Despite the bounce, technical indicators are firmly bearish. The MACD has crossed into negative territory and the RSI is below 50. In addition, the Stochastic oscillator has made a bearish cross.
Ongoing LINK bounce
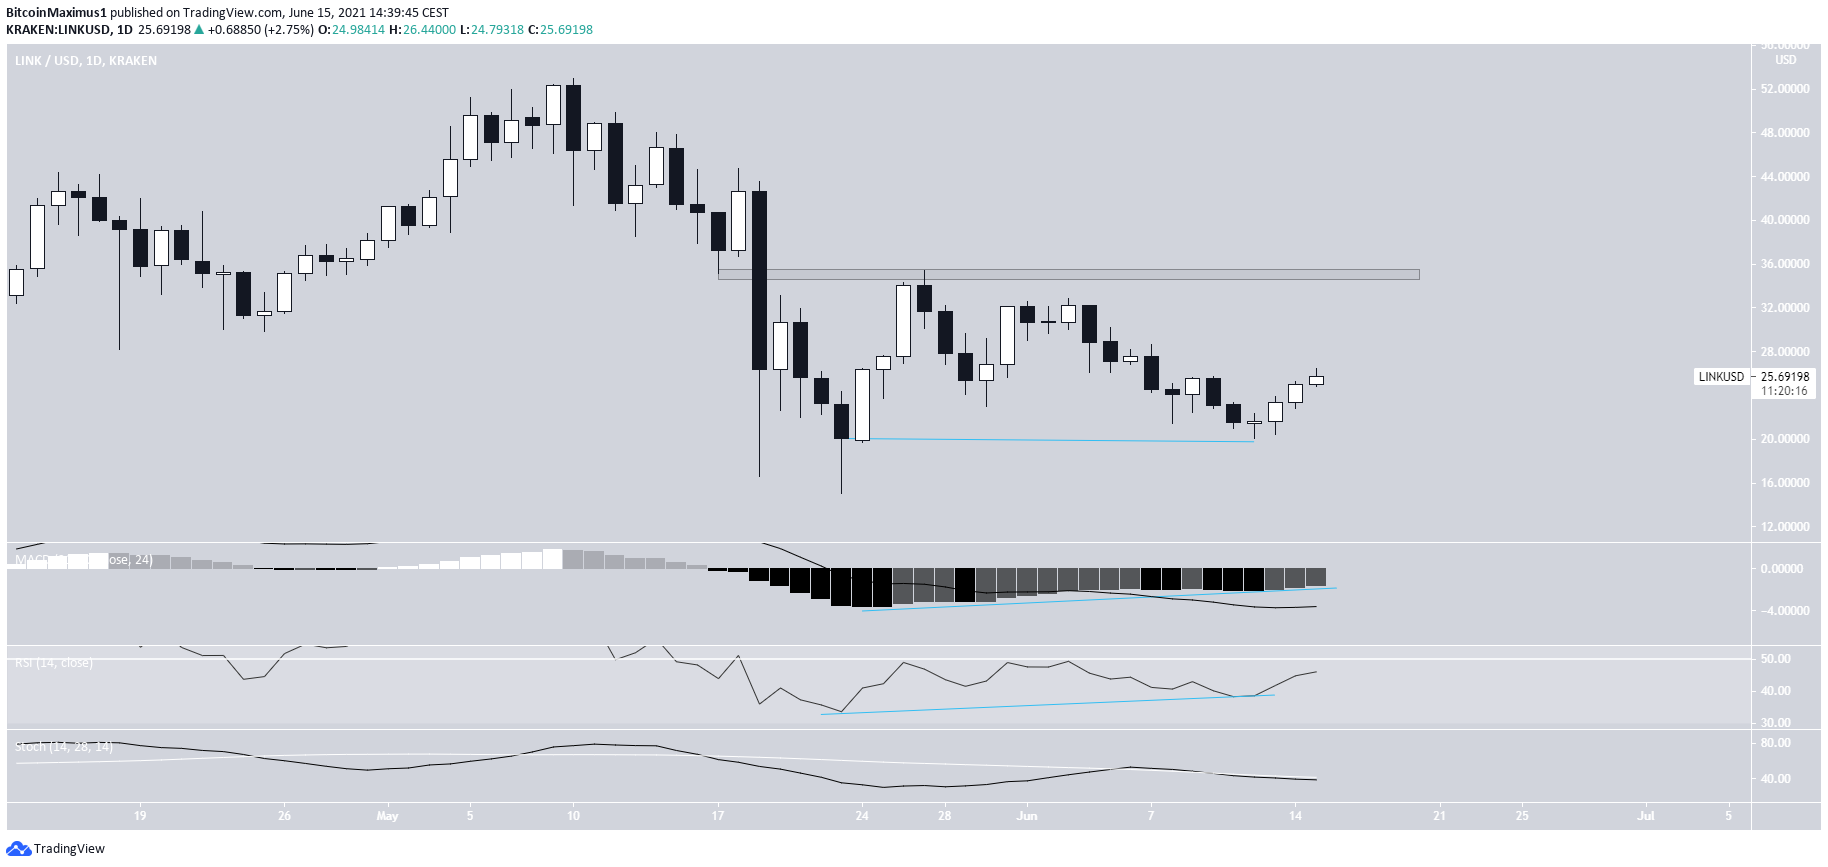
The daily chart provides a slightly more bullish outlook. LINK has created a higher low and both the MACD & RSI have generated bullish divergence. The Stochastic oscillator is also close to making a bullish cross.
There is horizontal resistance at $35, strengthening the Fib resistance from the previous section.
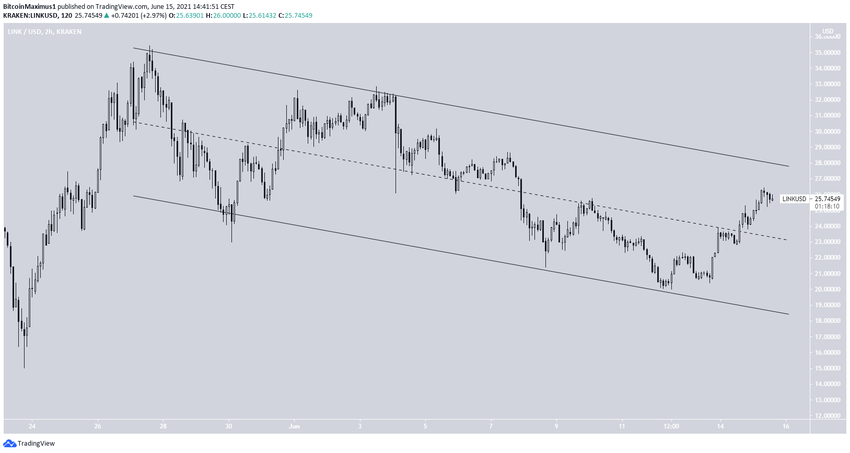
The shorter-term two-hour chart shows a descending parallel channel in place since May 26. LINK bounced at its support line on June 12, creating the aforementioned lower highs.
Considering the short-term bullish signs and the fact that parallel channels often contain corrective movements, a breakout is expected.
Wave count
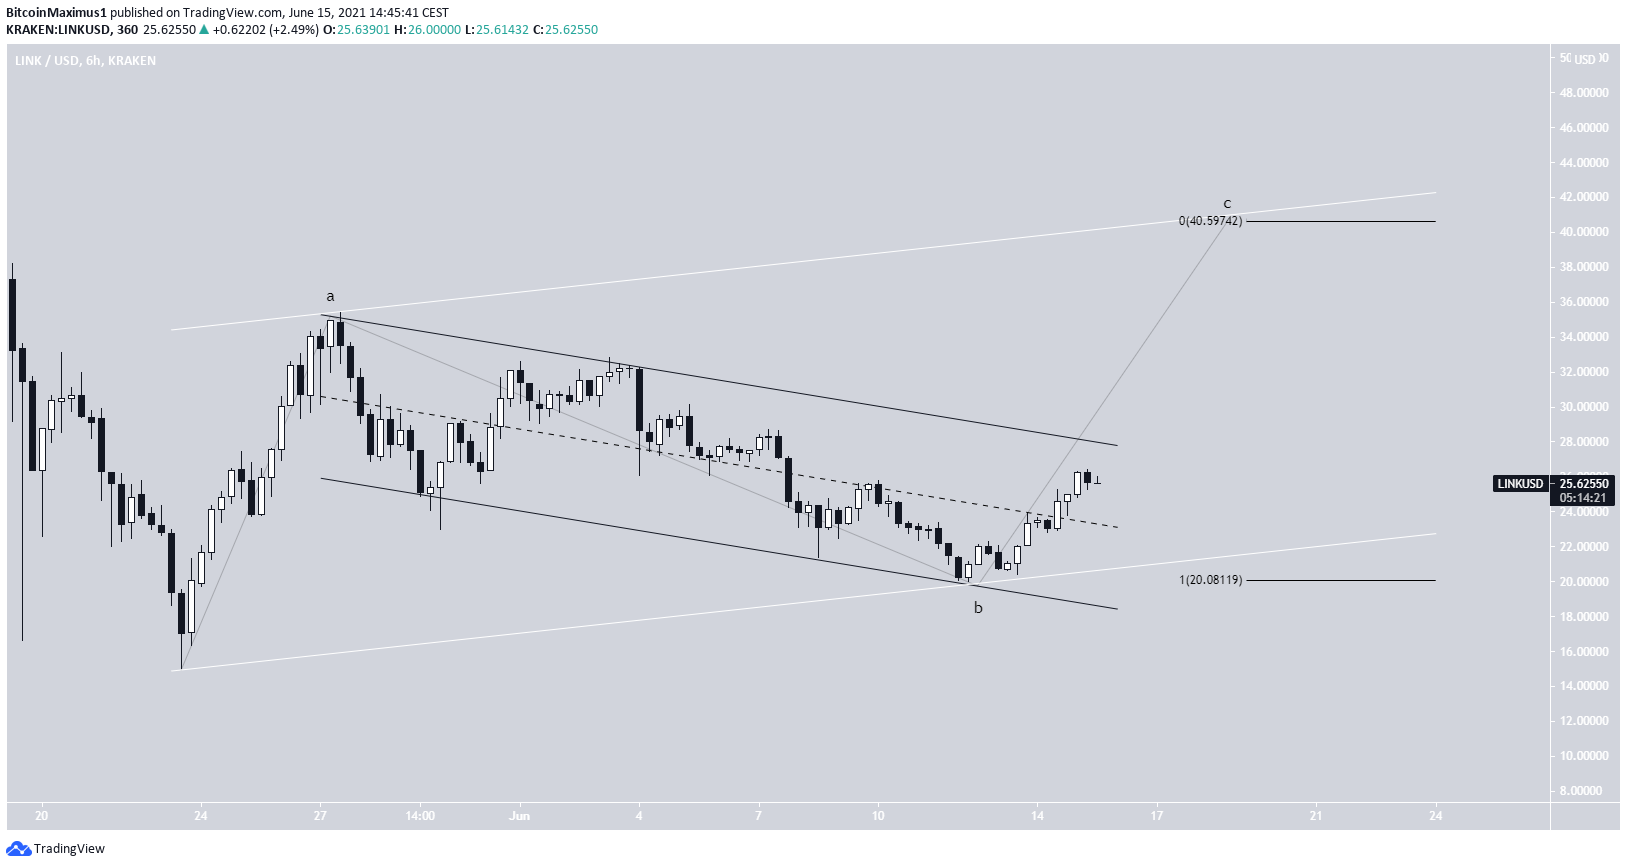
Cryptocurrency trader @AltstreetBet outlined a LINK chart, stating that the token is completing an A-B-C corrective structure.
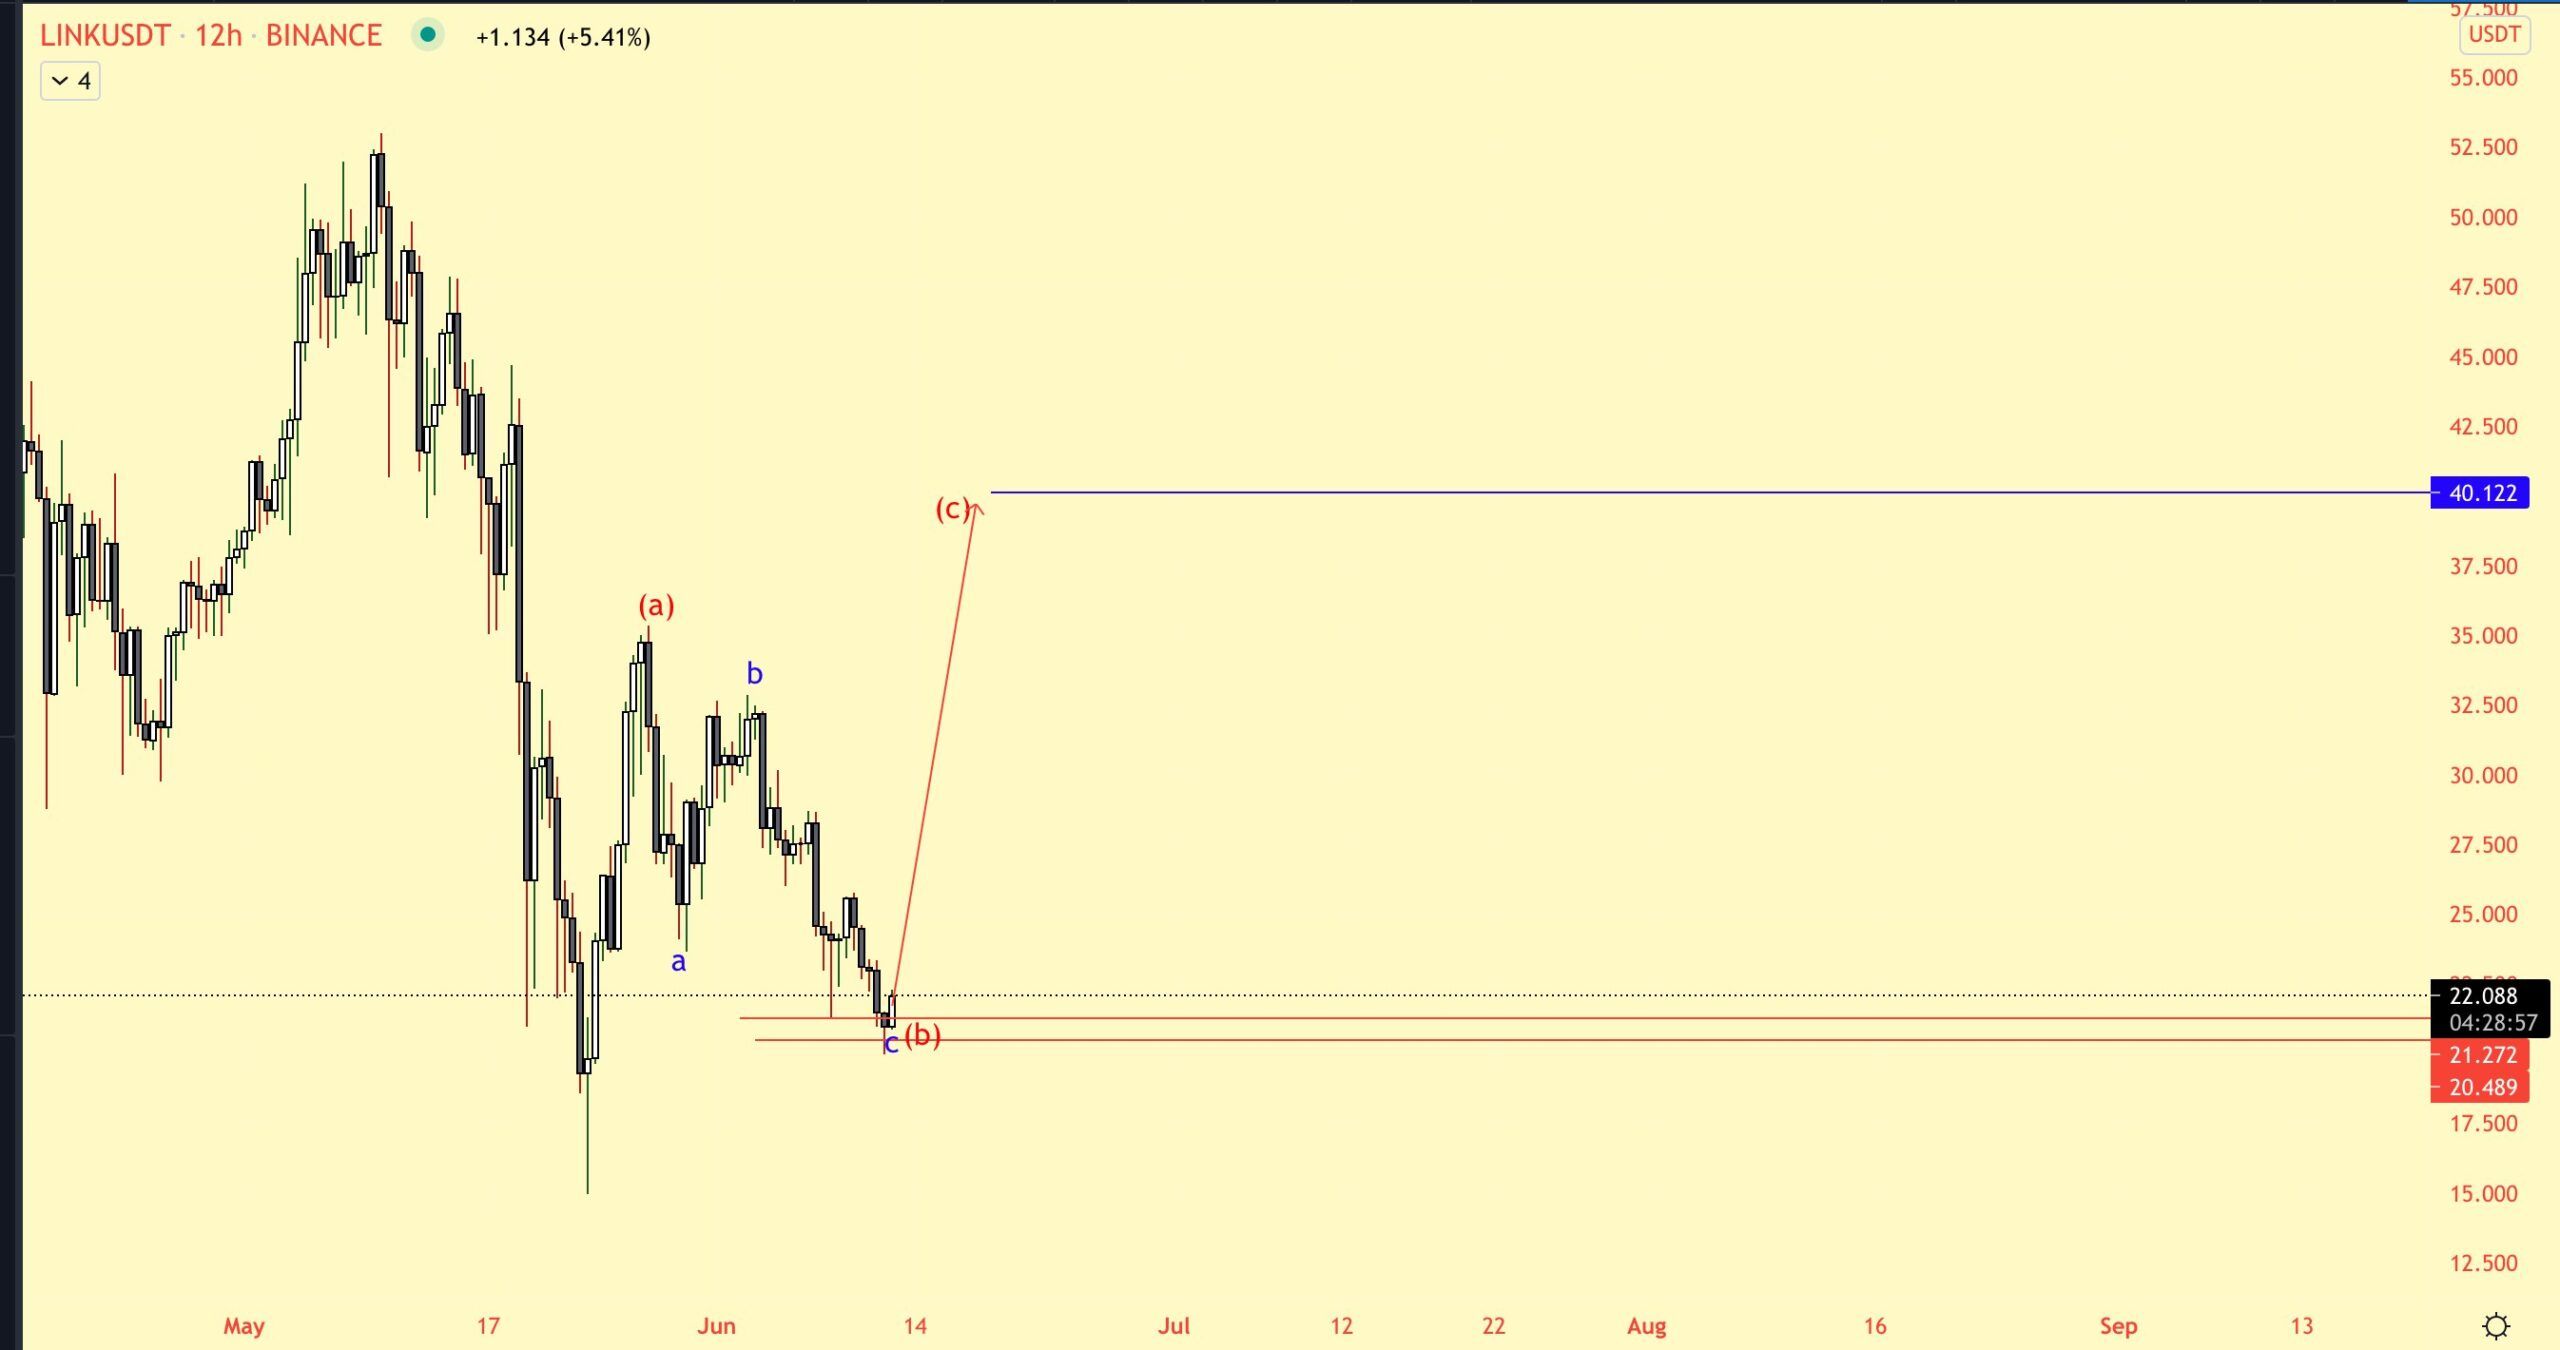
The movement looks like an A-B-C structure (black), in which the movement inside the channel comprises the B wave. A breakout from the channel would confirm this.
If so, a potential target for the top of the entire movement for LINK would be at $40.60. This would give waves A:C a 1:1 ratio and would reach the resistance line of a parallel channel drawn through the lows of waves A & B (white).
For BeInCrypto’s latest bitcoin (BTC) analysis, click here.
