


The ChainLink (LINK) price has broken out from a downtrend line that had been in place for more than two months.
Despite this, the price has failed to considerably increase after the breakout and has yet to clear a crucial resistance level, which would be a sign that the trend is bullish.
Trading Range
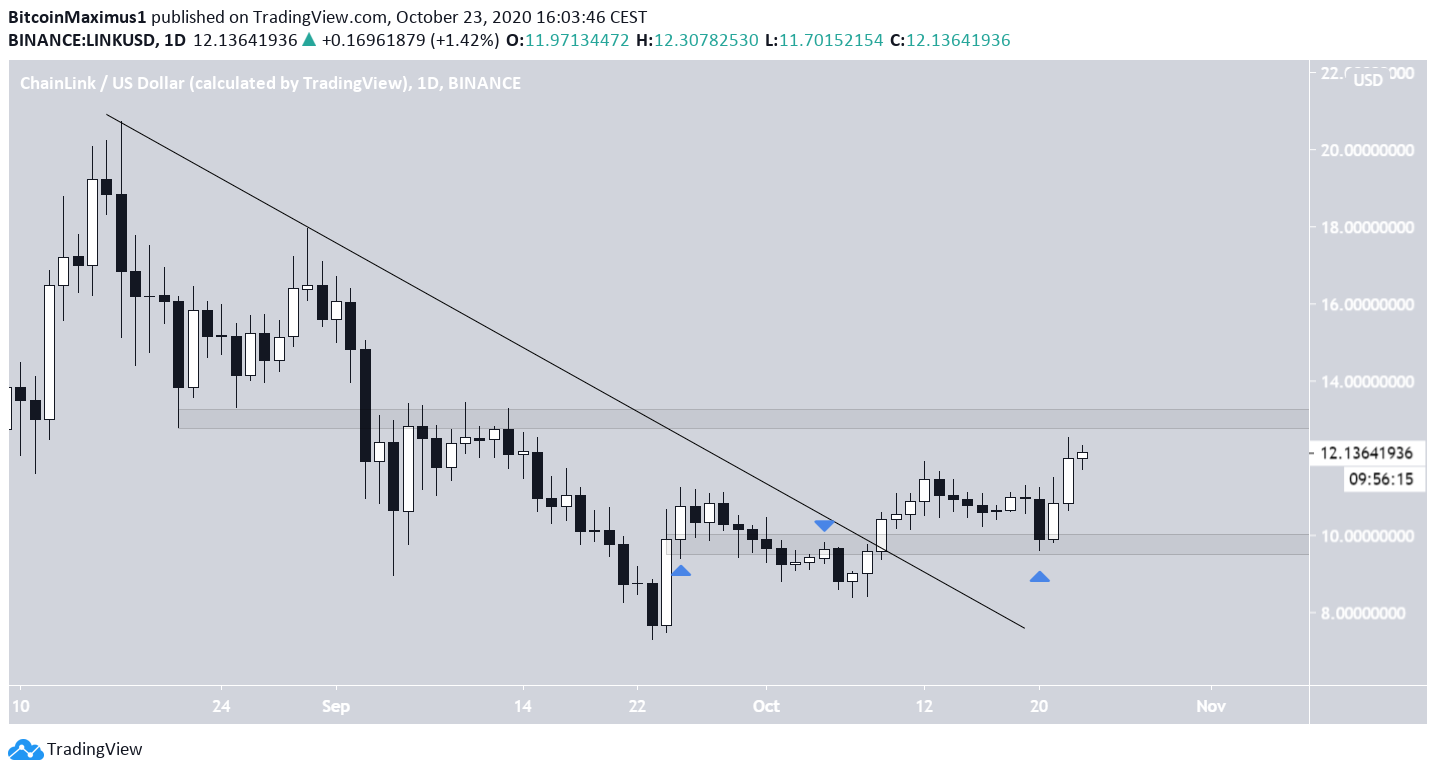
The LINK price had been decreasing alongside a descending resistance line since Aug 17, when it reached a high of $20.71. The decrease continued until a low of $7.28 was reached on Sept. 23. The price has been moving upwards since.
On Oct. 9, LINK successfully broke out from the descending resistance line. After a retracement that served to validate the $9.80 area as support, LINK resumed its upward movement. The closest resistance area is found at $13. Until the price clears this area, it is likely that the current movement is a correction in response to the previous decrease, rather than being the beginning of a new upward move.
Bullish Indicators
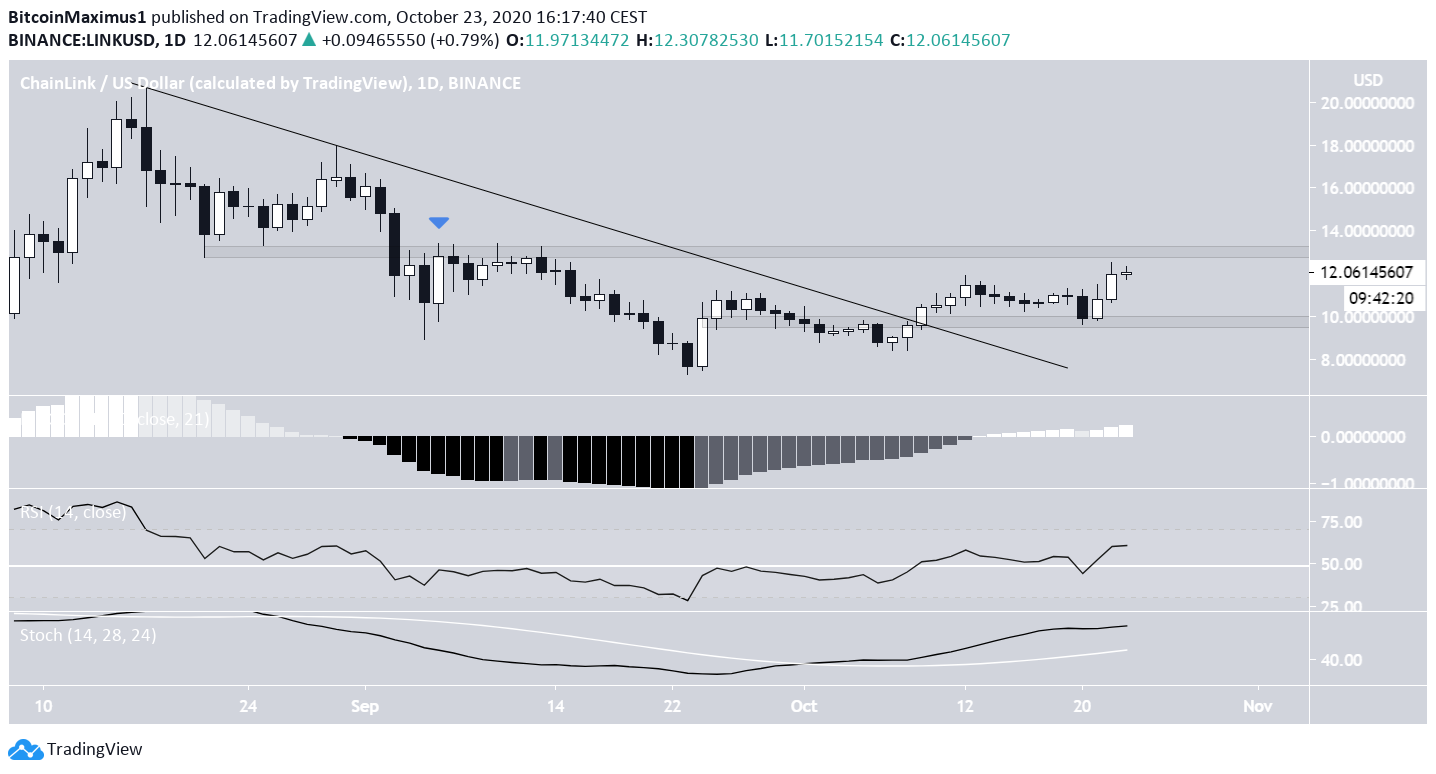
In the daily time-frame, technical indicators are bullish. The MACD is increasing and has crossed into positive territory, the RSI has bounced above the 50-line, and the Stochastic Oscillator is increasing after making a bullish cross. In addition, yesterday’s close was the highest since Sept. 6.
These are signs that the price is likely to continue moving upwards towards the $13 resistance area and possibly break out.
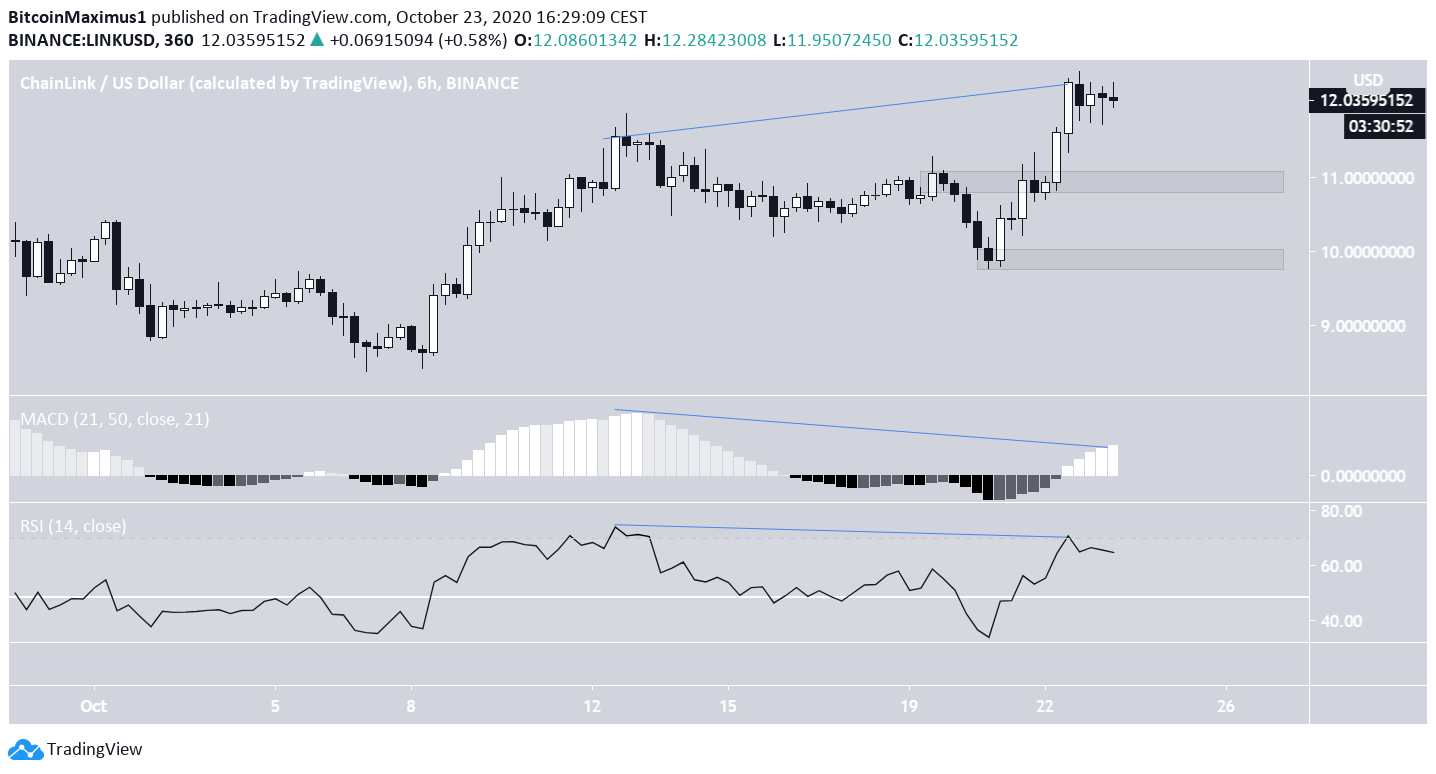
Despite the bullishness from the daily time-frame, shorter-term time-frames have begun to show weakness. Both the RSI and MACD have generated considerable bearish divergence during the most recent highs.
Therefore, the price could decrease in the short-term towards the minor support area at $11, before making an attempt at breaking out above $13. The second minor support area coincides with the longer-term support at $9.80, further increasing its significance.
Possible Diagonal?
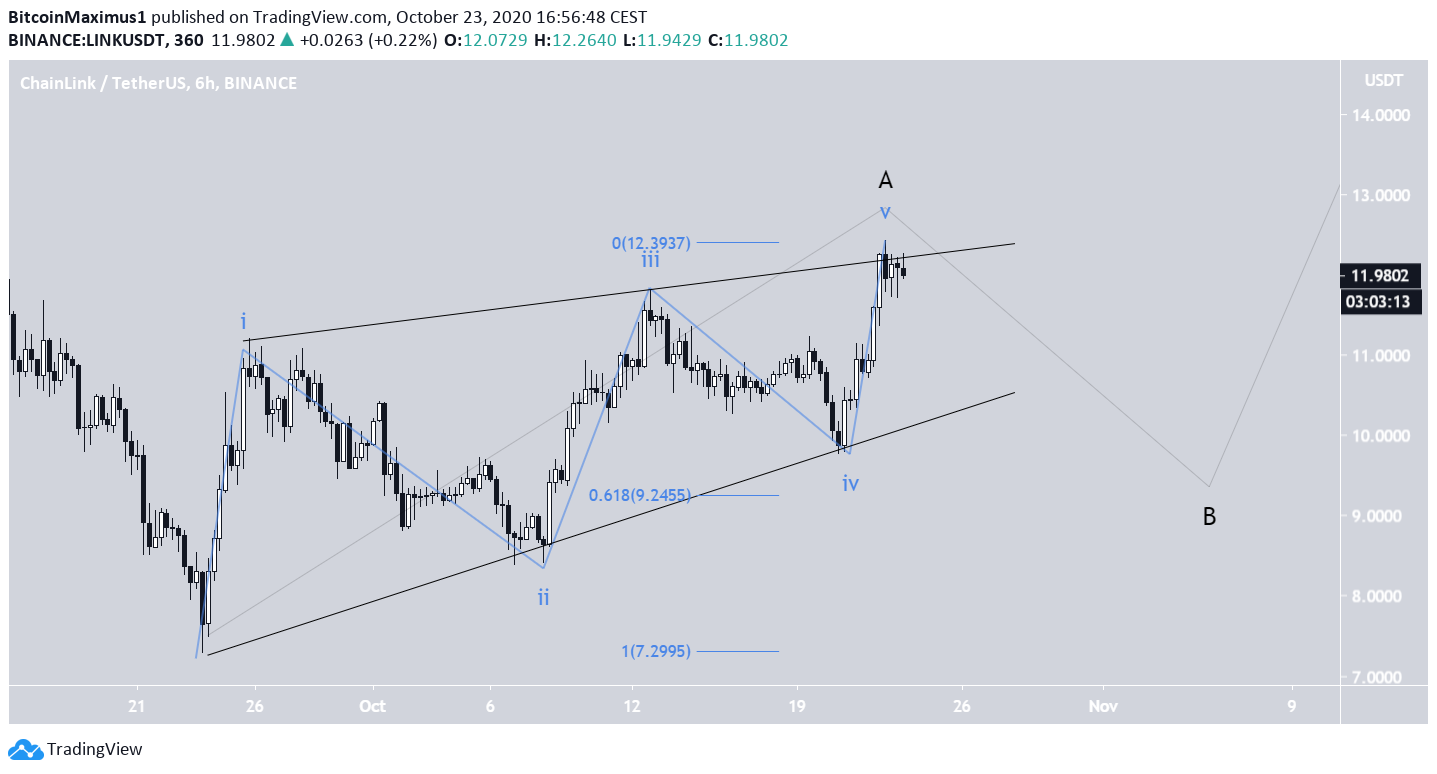
Cryptocurrency trader @TheTradingHubb outlined a LINK chart that shows a possible leading diagonal, after which a decrease would be expected. This would fit with the short-term weakness noted by the divergence.
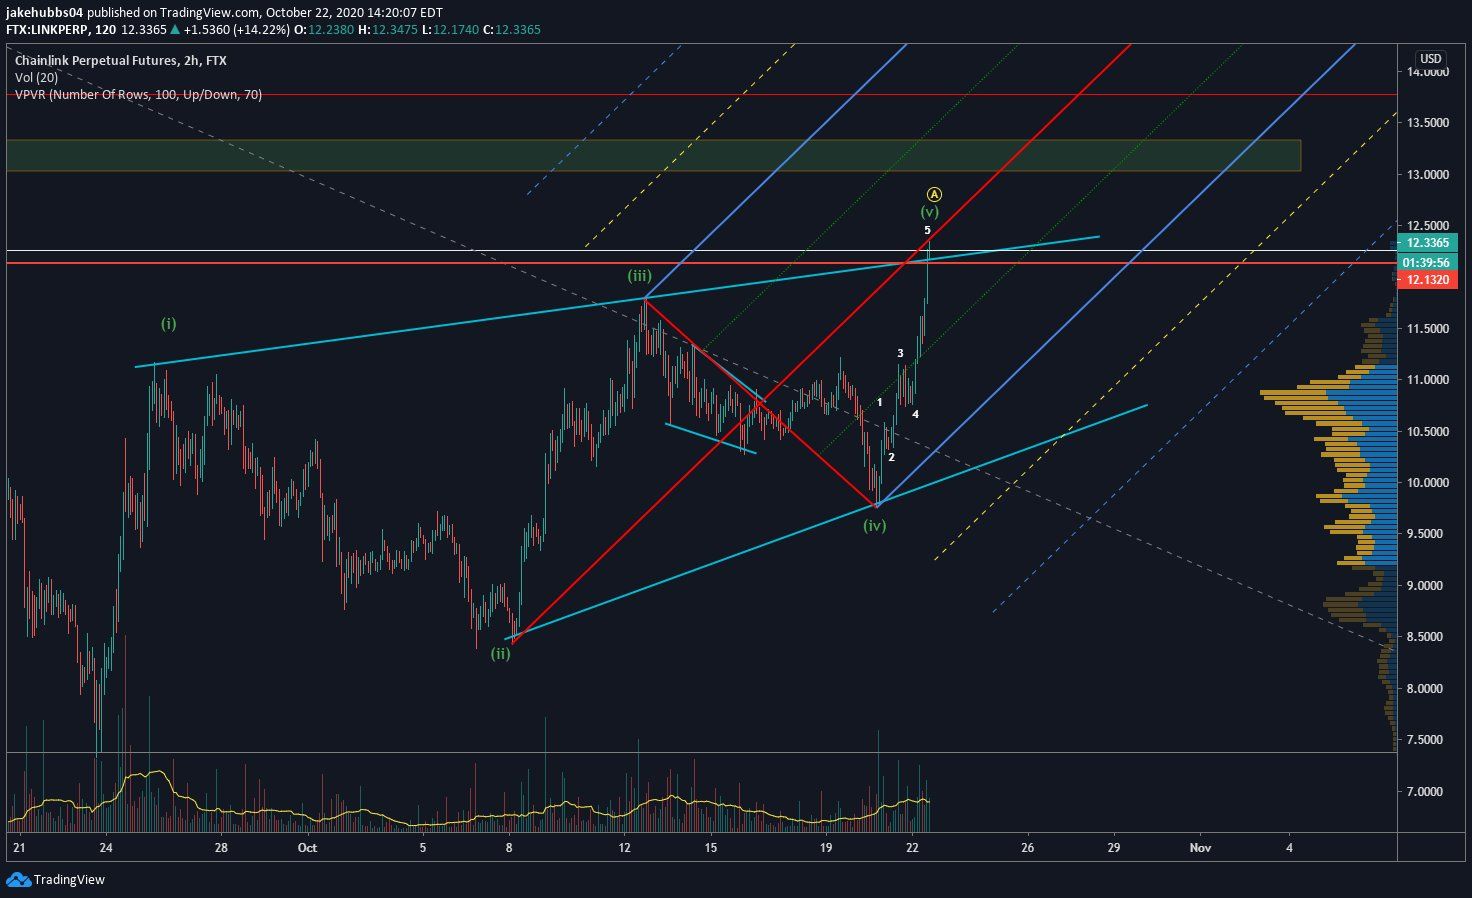
The movement since the Sept. 23 low does indeed look like a leading diagonal (shown in blue below), which could be a part of a longer-term A wave (black).
The leading diagonal also creates an ascending wedge, which is considered a bearish reversal pattern. If the price breaks down, the maximum level of retracement would be all the way to the 0.618 Fib level at $9.245.
The reason why the leading diagonal is more likely to be an A wave rather than the beginning of an impulse is the previous movement, which shows a completed bearish impulse.
Therefore, the current increase is more likely to be corrective. However, the entire movement could take the price all the way to the 0.618 Fib level of the entire decrease at $15.21 before the price drops in order to make new lows.
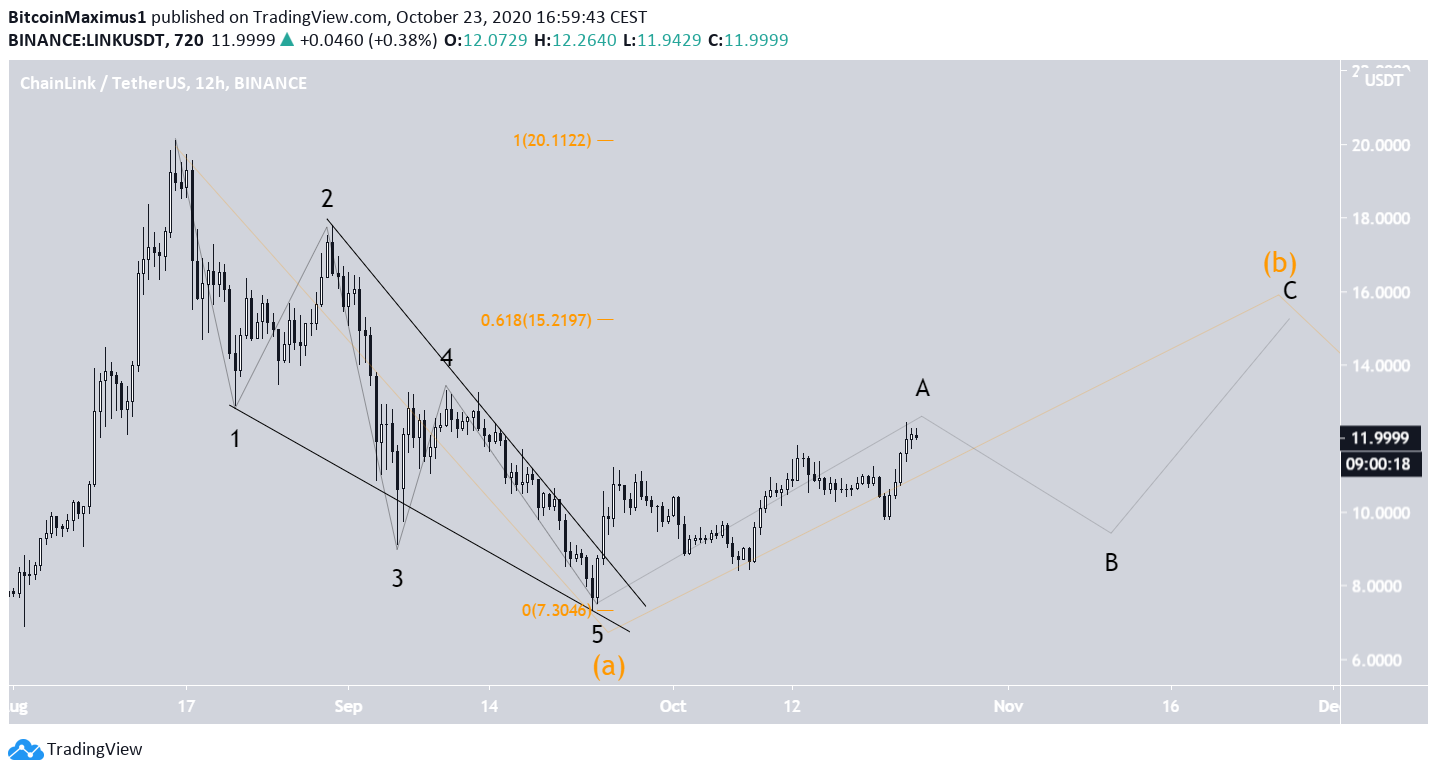
To conclude, after a short-term decrease, the LINK price is expected to gradually move upwards towards $15.
For BeInCrypto’s previous Bitcoin analysis, click here!
Disclaimer: Cryptocurrency trading carries a high level of risk and may not be suitable for all investors. The views expressed in this article do not reflect those of BeInCrypto.


