


On Oct 23, Bitcoin (BTC) continued the upward move which had accelerated on Oct 19.
While the long-term trend is likely bullish, a short-term drop could occur before the price resumes its upward movement.
Bitcoin Continues Ascent
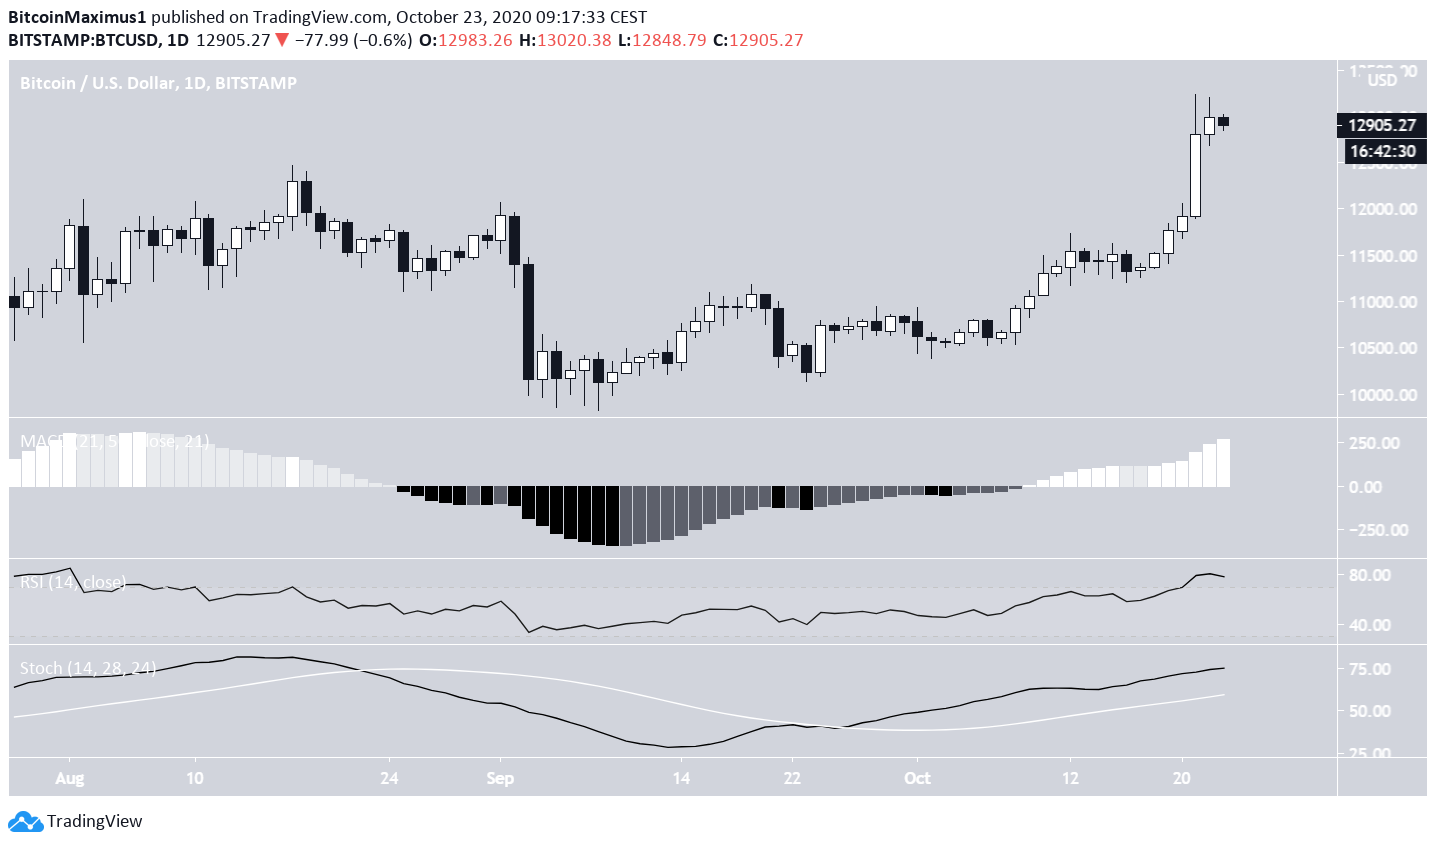
On Oct 23, Bitcoin continued its upward movement by creating another bullish candlestick that was slightly smaller than the candle that preceding it. Furthermore, yesterday’s wick-high of $13,208 was lower than that of Oct 22, which reached $13,235.
Despite this development, there is no visible weakness in the daily time-frame. The MACD, RSI, and Stochastic oscillator are increasing and there is no bearish divergence present.
Short-Term Double-Top
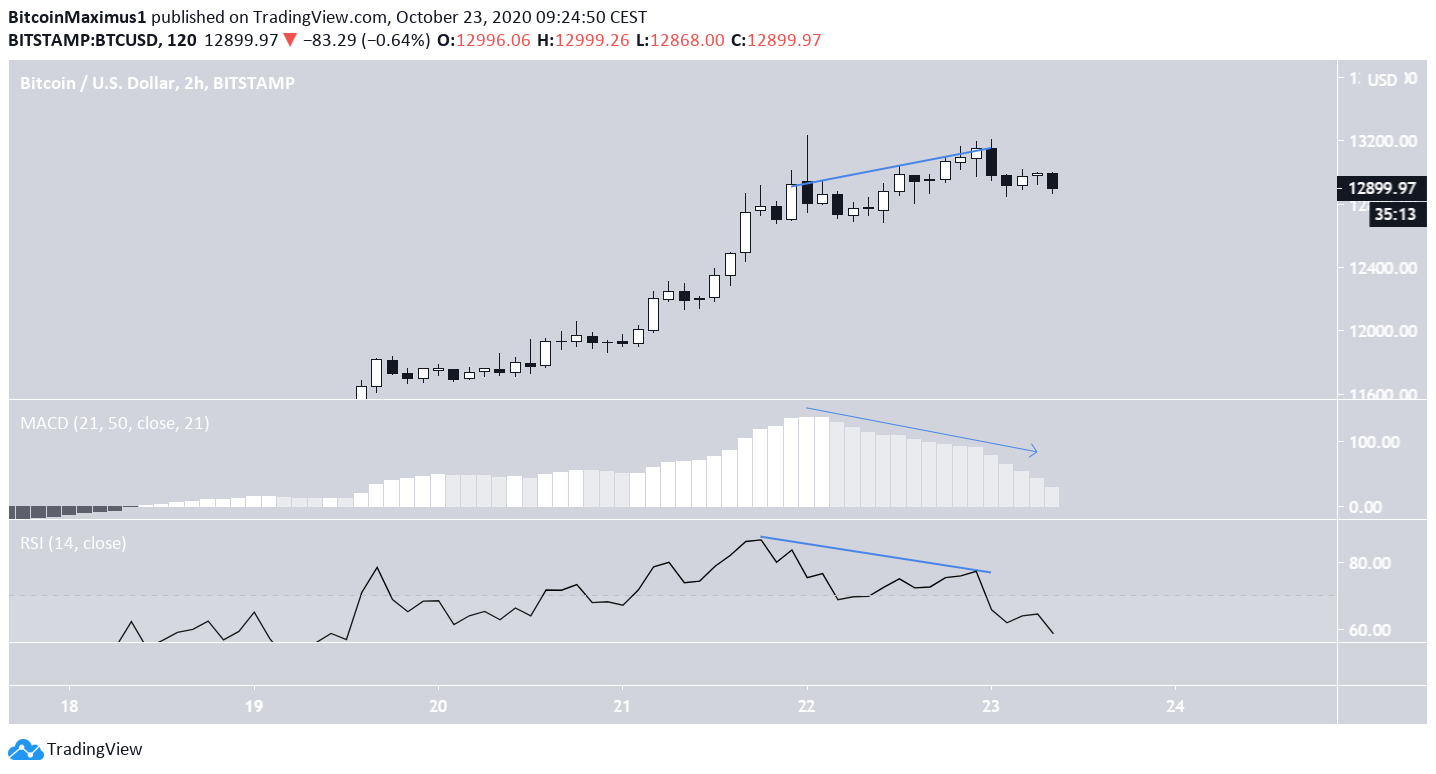
The short-term chart for BTC does show some signs of weakness, however. On Oct 21, BTC created a shooting star candlestick (blue arrow in the image below), which was the first bearish sign during the upward move.
Yesterday, the increase that failed to reach the previous high was combined with significant bearish divergence in both the RSI and the MACD, the latter of which has almost crossed into negative.
Possible Retracement
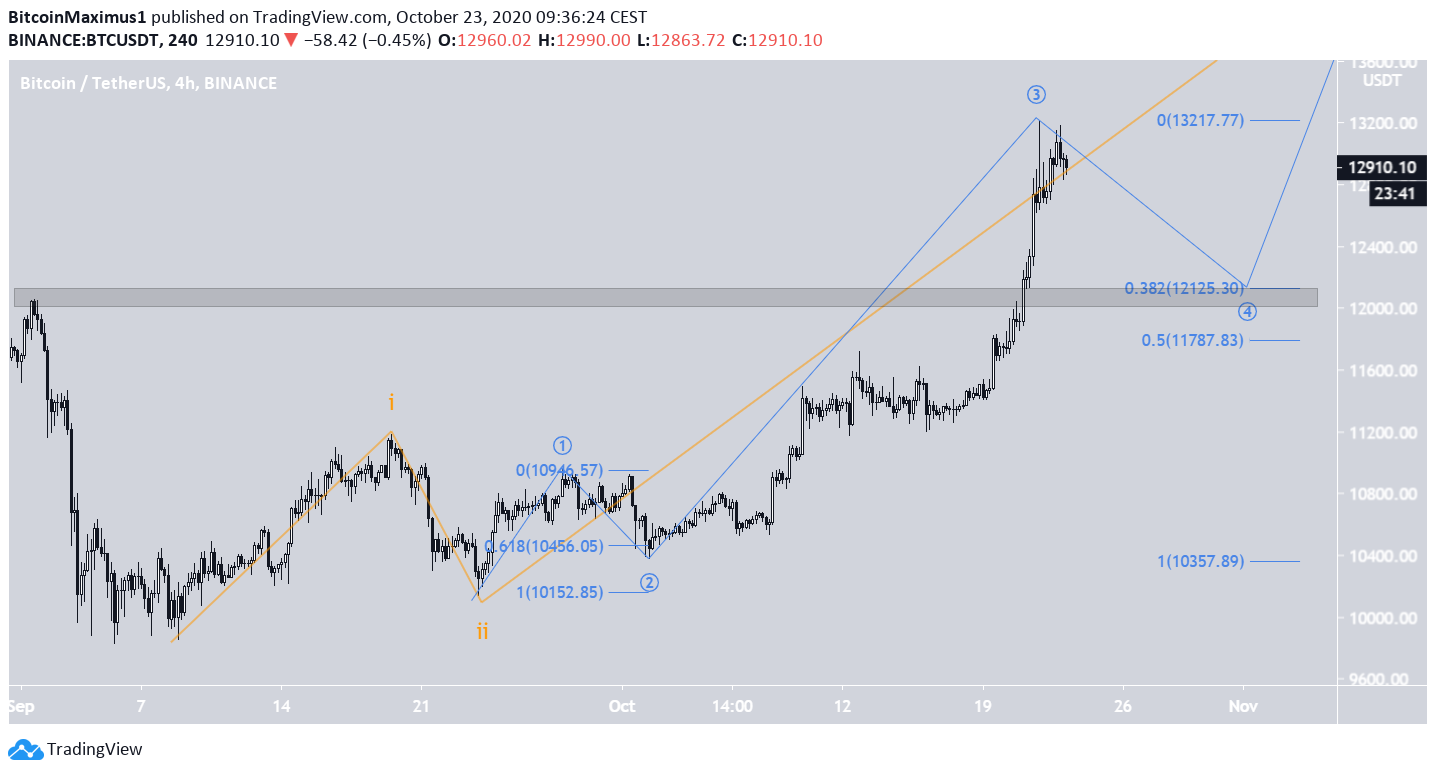
The Oct 21 high might have marked the top of the third sub-wave (shown in blue below), which is a part of a larger third wave (orange).
Considering the short-term bearish implications from the previous section, a retracement is expected. Even though there are no clear support levels below the current price, we can use Fib retracement levels to determine where the retracement will most likely end.
The price could drop to the 0.382 Fib level of sub-wave 3 at $12,125. The reason for this shallow retracement is a counter to the deep retracement of sub-wave 2, which went all the way down below the 0.618 Fib level. Because of the concept of alternation, we would expect to see the opposite in sub-wave 4.
To conclude, while it is likely that BTC is bullish in the longer-term and will move higher, a short-term retracement is expected before the price resumes its upward movement.
For BeInCrypto’s previous Bitcoin analysis, click here!
Disclaimer: Cryptocurrency trading carries a high level of risk and may not be suitable for all investors. The views expressed in this article do not reflect those of BeInCrypto.


