

The Chainlink (LINK) price is trading at the support line of a long-term channel that has been in place since Sept. 22.
LINK is expected to break down from the channel and move towards the support areas outlined below.
LINK Rejected Inside Channel
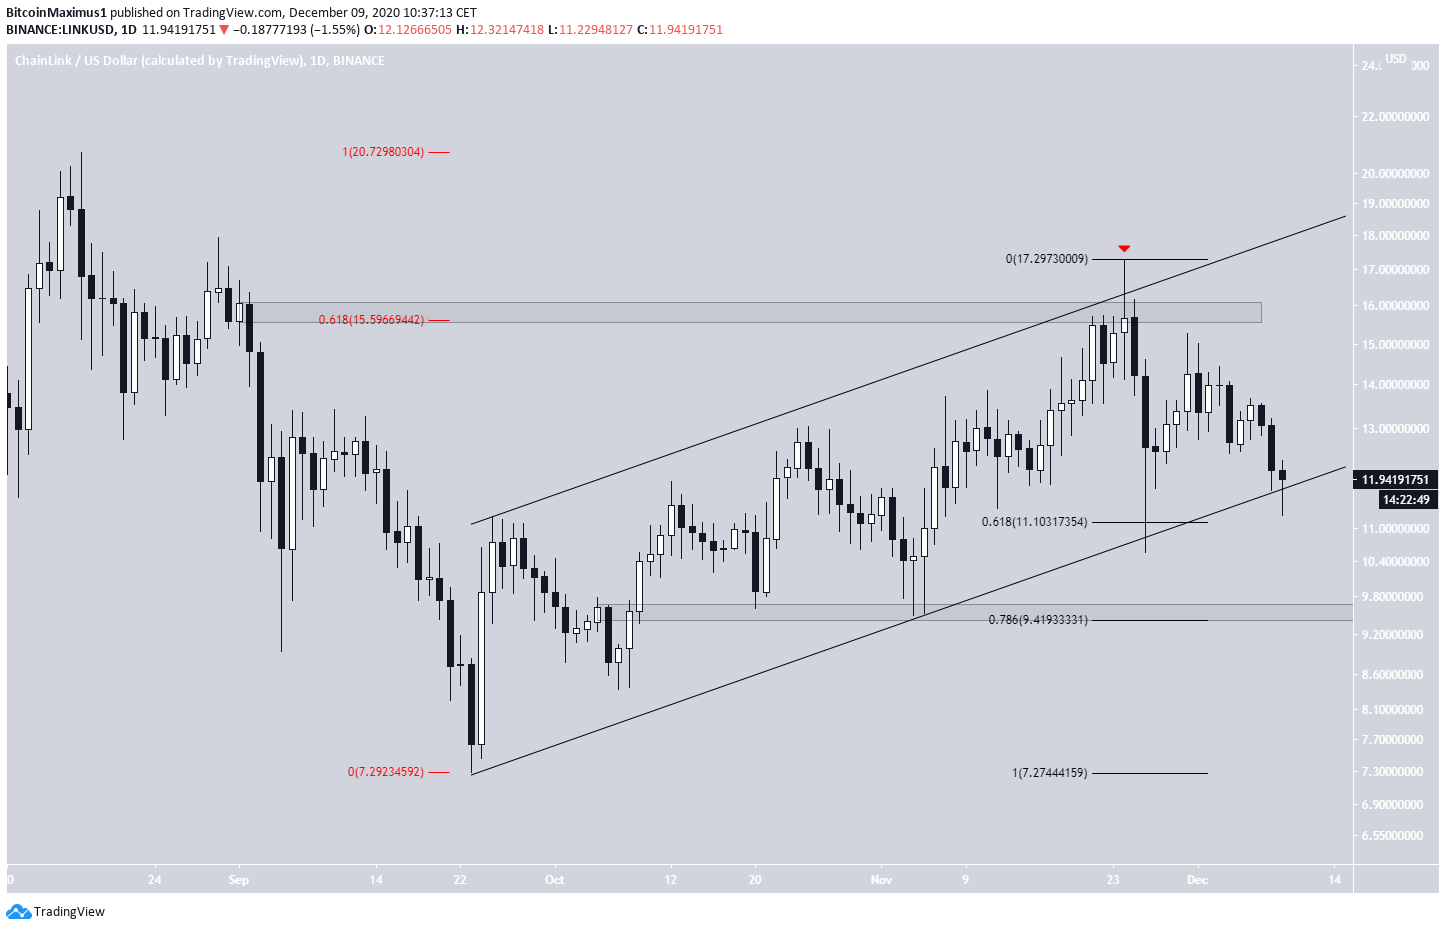
LINK has been decreasing since reaching a high of $17.30 on Nov. 24. The high coincides with the 0.618 Fib retracement level of the previous decrease and the resistance line of a parallel channel, suggesting that the upward move up to this point had been corrective.
The ensuing dip has taken LINK to the support line of the channel. This support coincides with the $11.10 support area, which is also the 0.618 Fib retracement level of the recent upward move.
If LINK breaks down, the next closest support area would be found at $9.45.
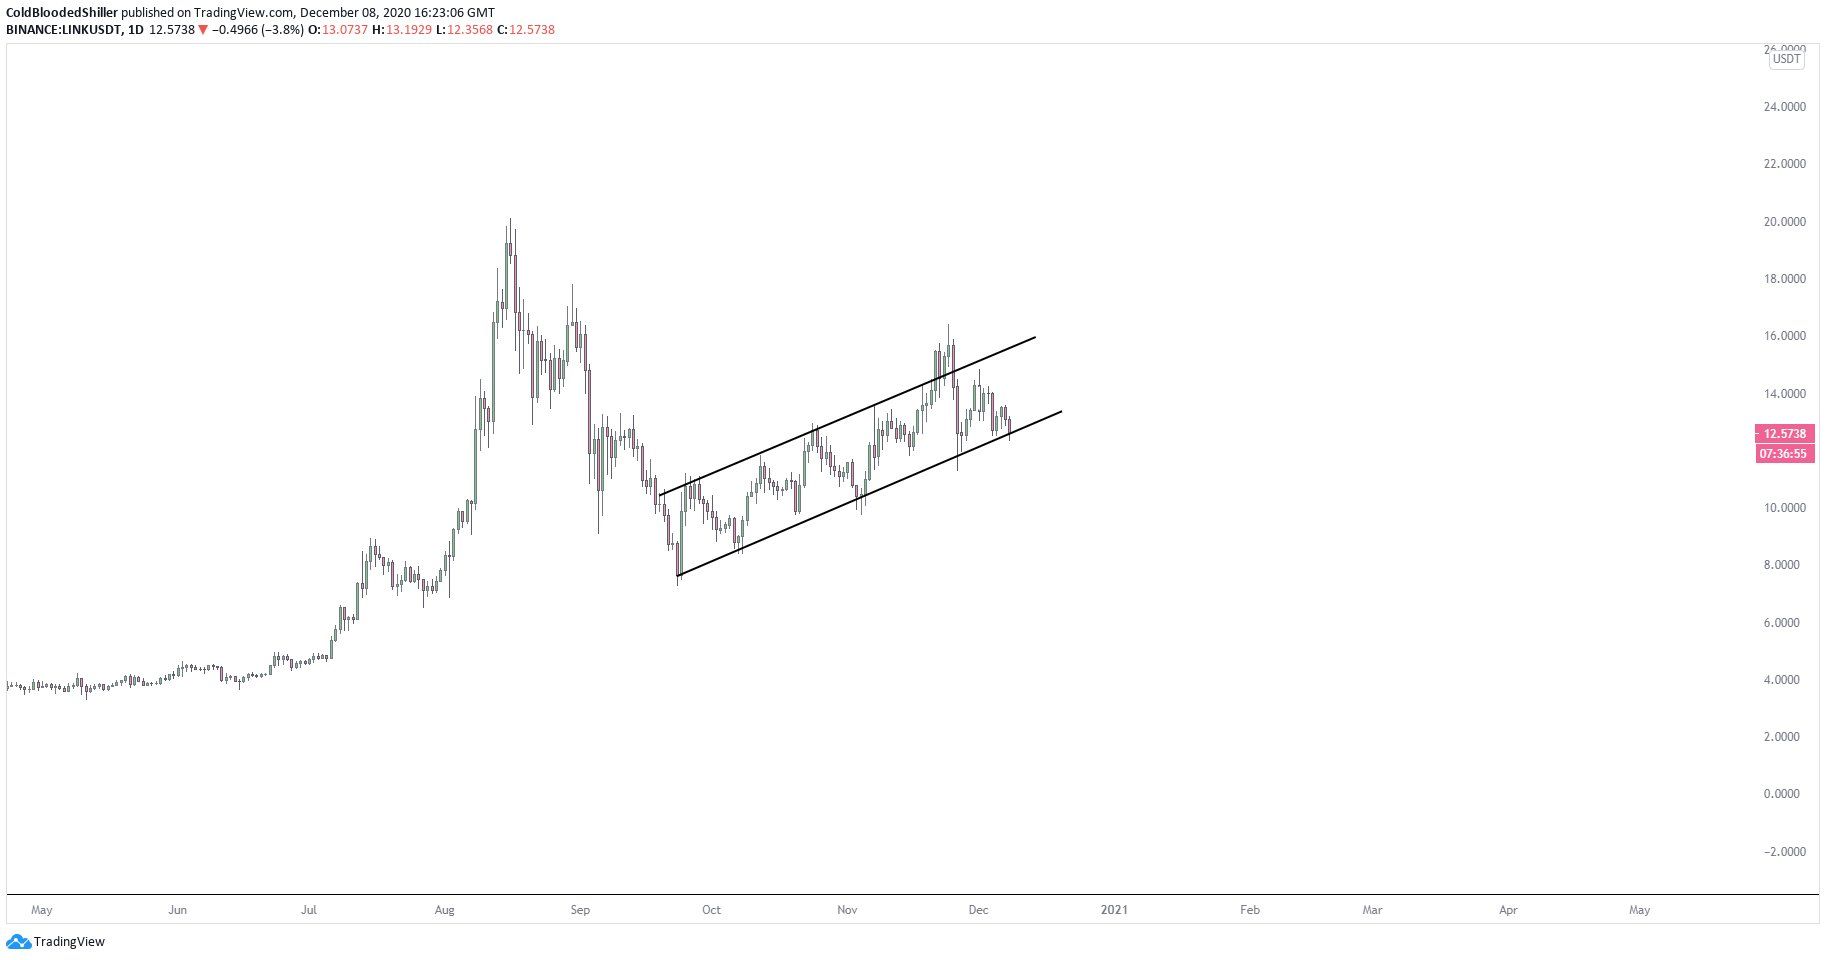
Cryptocurrency trader @ColdBloodShill outlined a LINK Chart which shows the same parallel ascending channel and stated that if the price breaks down from it, it would likely invalidate the possibility of it going higher this time around.
Technical Signals
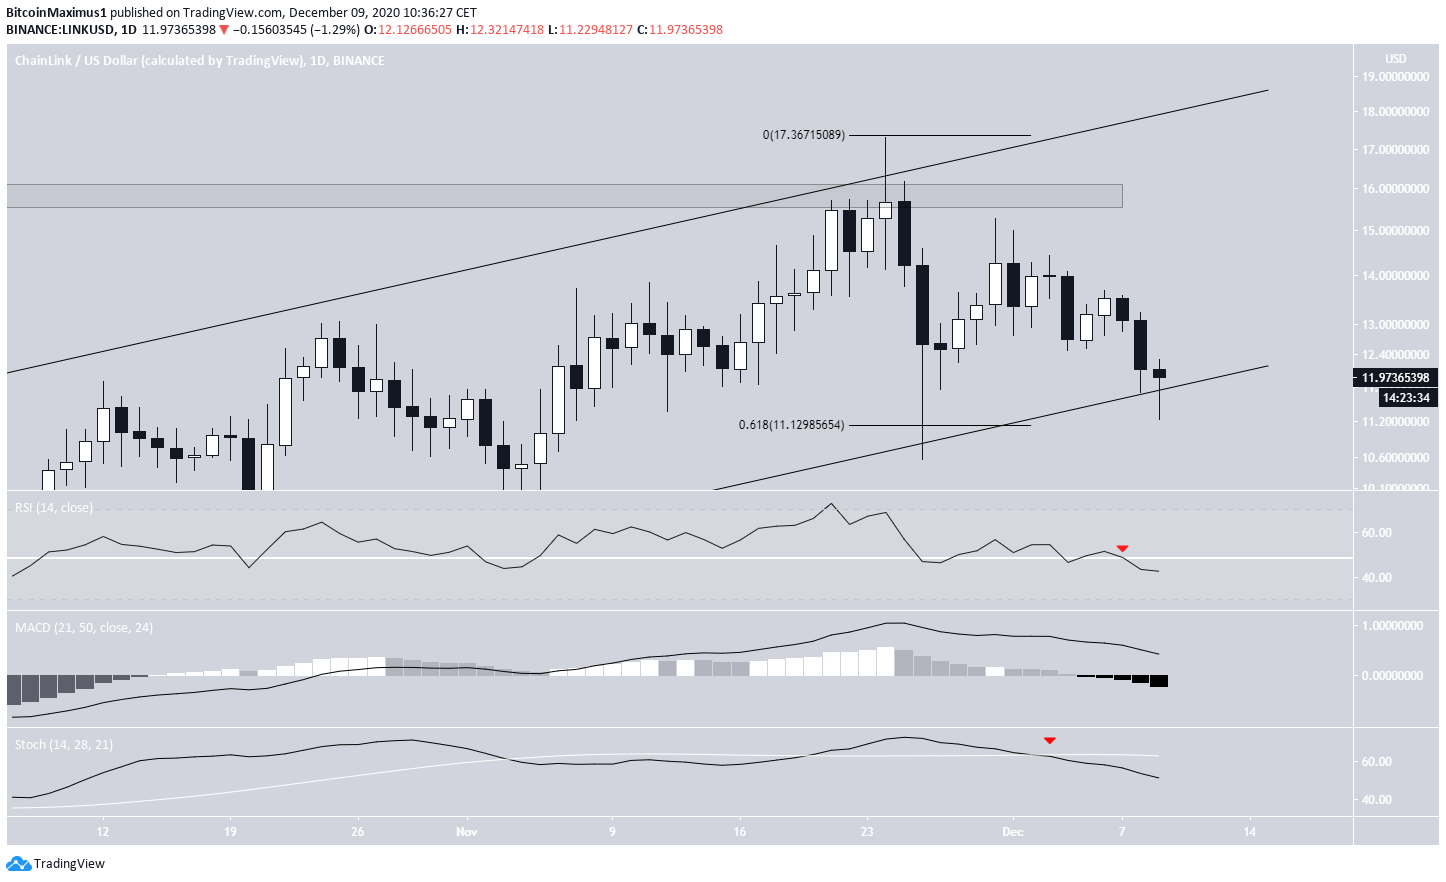
Technical indicators in the daily time-frame are bearish. The RSI has crossed below 50, the Stochastic oscillator has made a bearish cross, and the MACD is decreasing and has nearly crossed into negative territory.
Therefore, the daily time-frame suggests that LINK is expected to break down from the channel and move towards support.
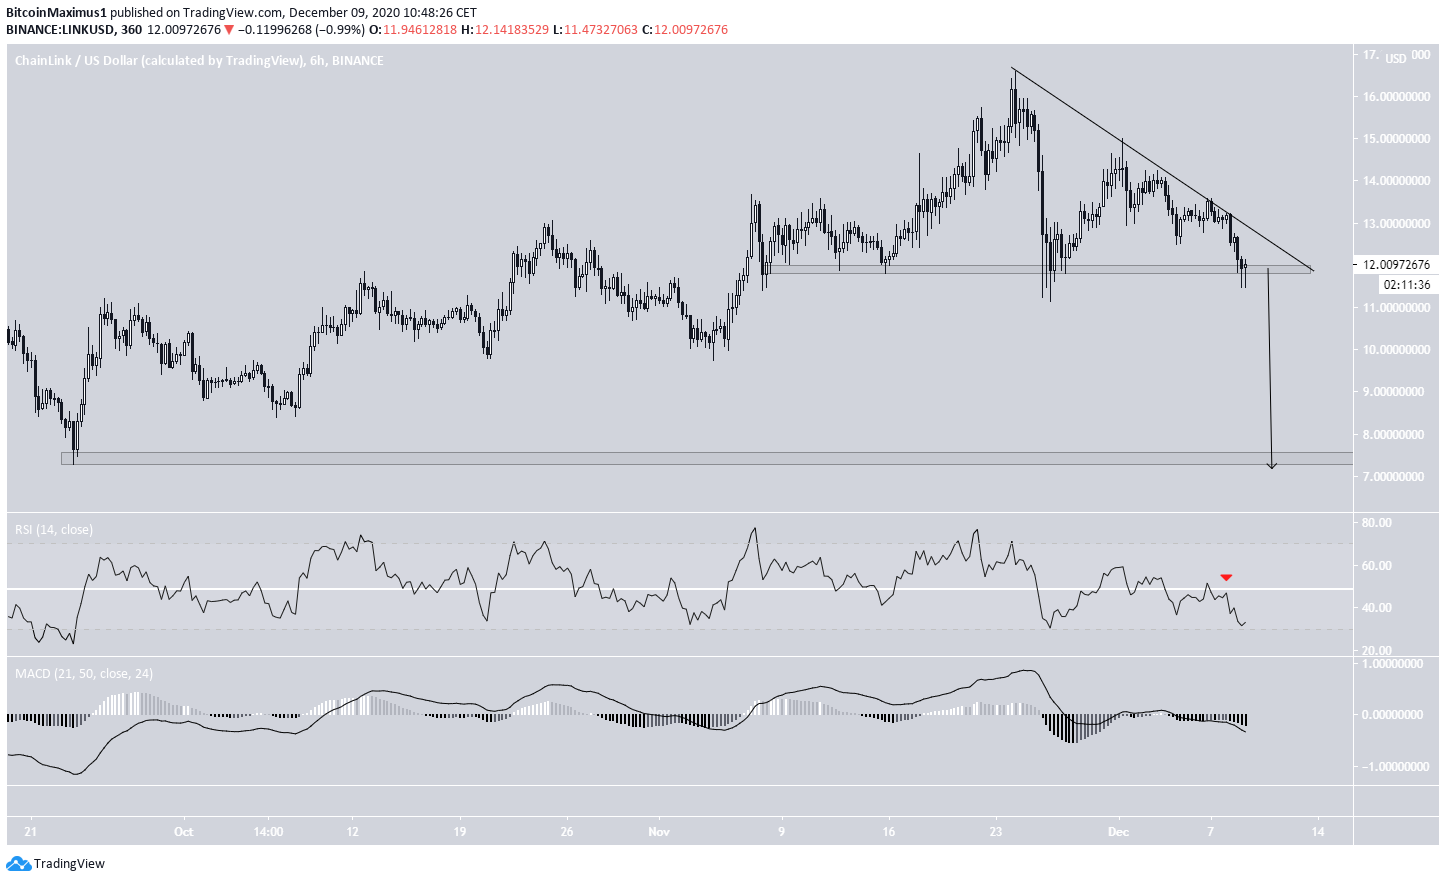
Furthermore, the six-hour time-frame shows that the price is following a descending resistance line, which when combined with the current support area, creates what resembles a descending triangle.
LINK is currently trading just above this support line. A break below this level could trigger a sharp drop.
A decrease that travels the entire height of the pattern could take the price back to the September lows at $7.40.
Both the RSI & MACD are in alignment, supporting the possibility of a breakdown.
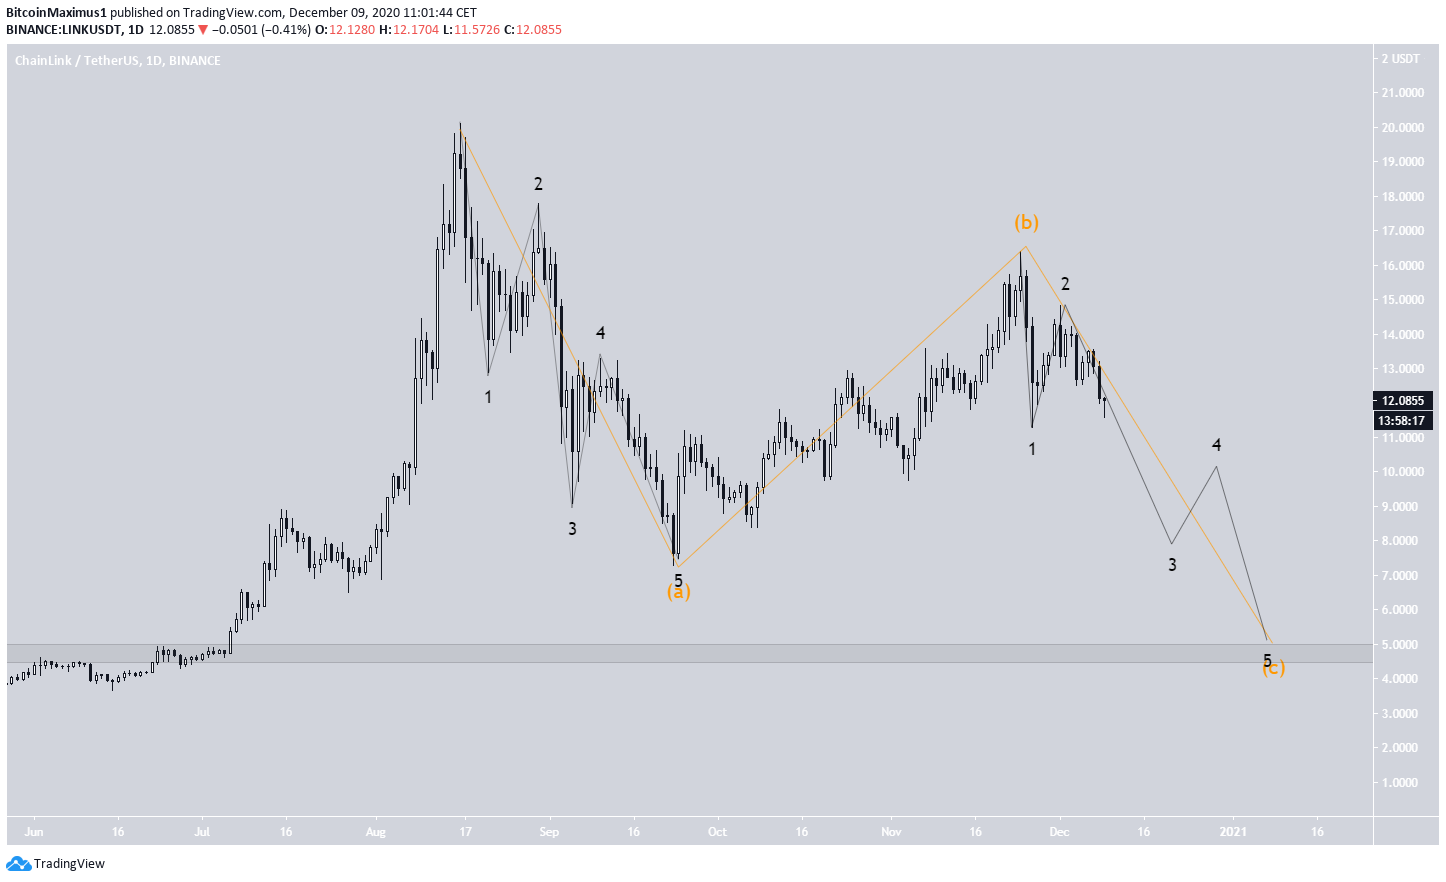
Wave Count
The wave count that we have been following suggests that is trading in the C wave of an A-B-C corrective structure (shown in orange below), measuring from the Aug. 16 high.
The sub-wave count is shown in black, and the price looks to be in sub-wave 3.
If the count is accurate, the entire downward move could take LINK down to $5.
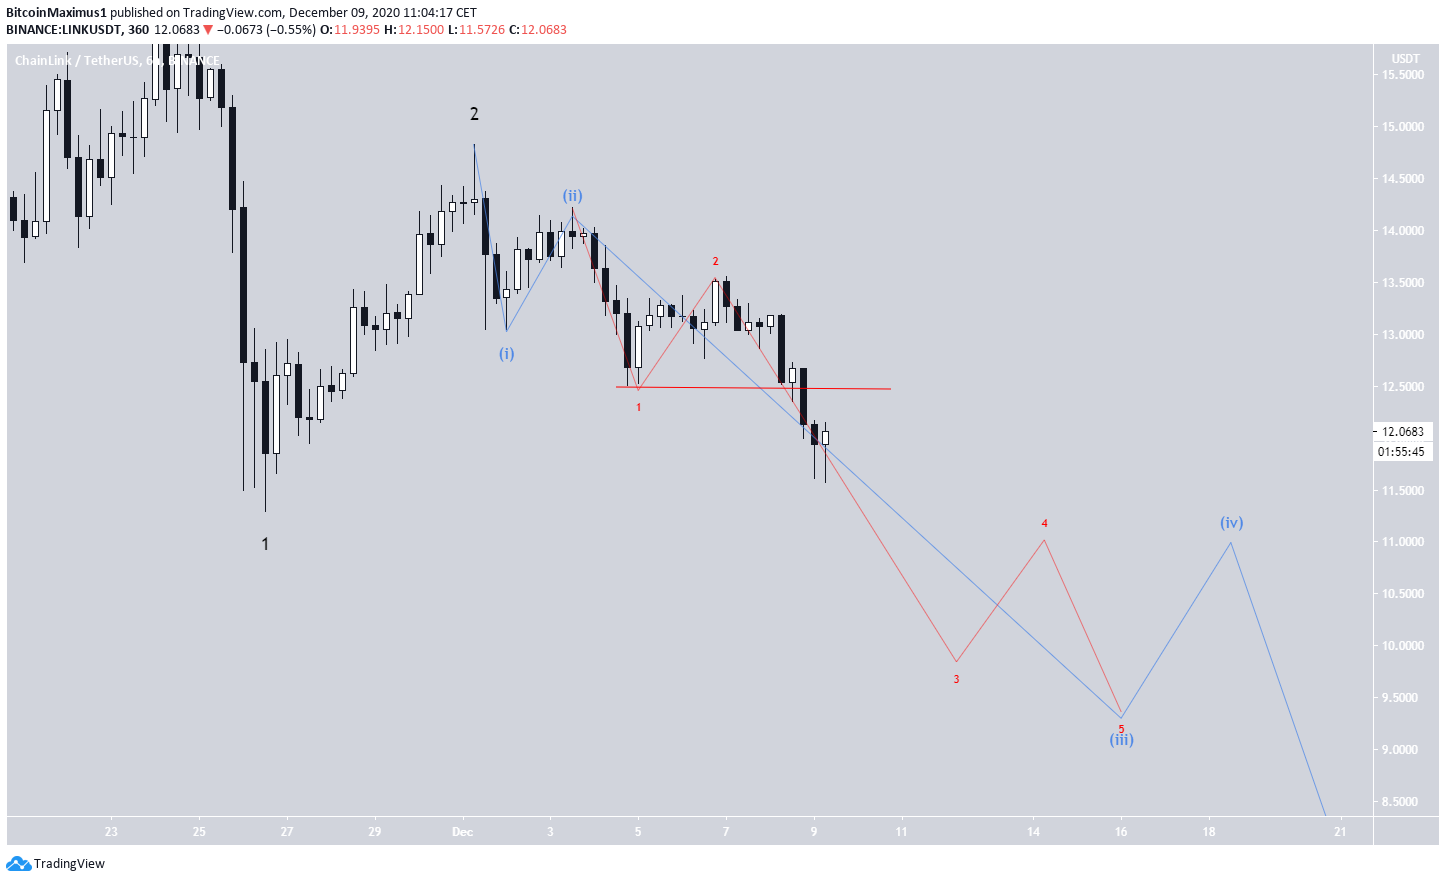
In the shorter-term, the only way for this count to be accurate would be if the current decrease is a 1-2/1-2 wave formation.
The invalidation level for this formation is relatively close, at $12.48 (red line). Therefore, if the price manages to reach $12.48, it would be more likely that the current decrease is corrective, and would likely reach a low near $9.40.
If not, the original count stands, and LINK would be expected to continue decreasing.
Conclusion
LINK is expected to break down from its parallel channel and reach a low of at least $9.45.
Whether or not the price reaches $12.48 in the short-term will help determine if LINK is in an extended downward move or a shorter-term corrective structure.
For BeInCrypto’s previous LINK analysis, click here!
Disclaimer: Cryptocurrency trading carries a high level of risk and may not be suitable for all investors. The views expressed in this article do not reflect those of BeInCrypto.
Disclaimer
In line with the Trust Project guidelines, this price analysis article is for informational purposes only and should not be considered financial or investment advice. BeInCrypto is committed to accurate, unbiased reporting, but market conditions are subject to change without notice. Always conduct your own research and consult with a professional before making any financial decisions. Please note that our Terms and Conditions, Privacy Policy, and Disclaimers have been updated.
