
Chainlink (LINK) has been consolidating within a horizontal channel over the past few weeks, with resistance at $10.78 and support at $10.06.
Currently, the altcoin is trading close to its support level, hovering around $10.14.
Chainlink Trends Sideways, but Opportunity Lies Within
LINK has traded within a horizontal channel since August 6. This channel is formed when an asset’s price moves within a range for some time. The upper line of this channel forms resistance, while the lower line forms support.
This sideways movement happens when there is a relative balance between buying and selling pressures, preventing its price from trending strongly in either direction.
This can be gleaned from LINK’s flat Relative Strength Index (RSI). As of this writing, LINK’s RSI is 40.83 and has remained flat since August 6.
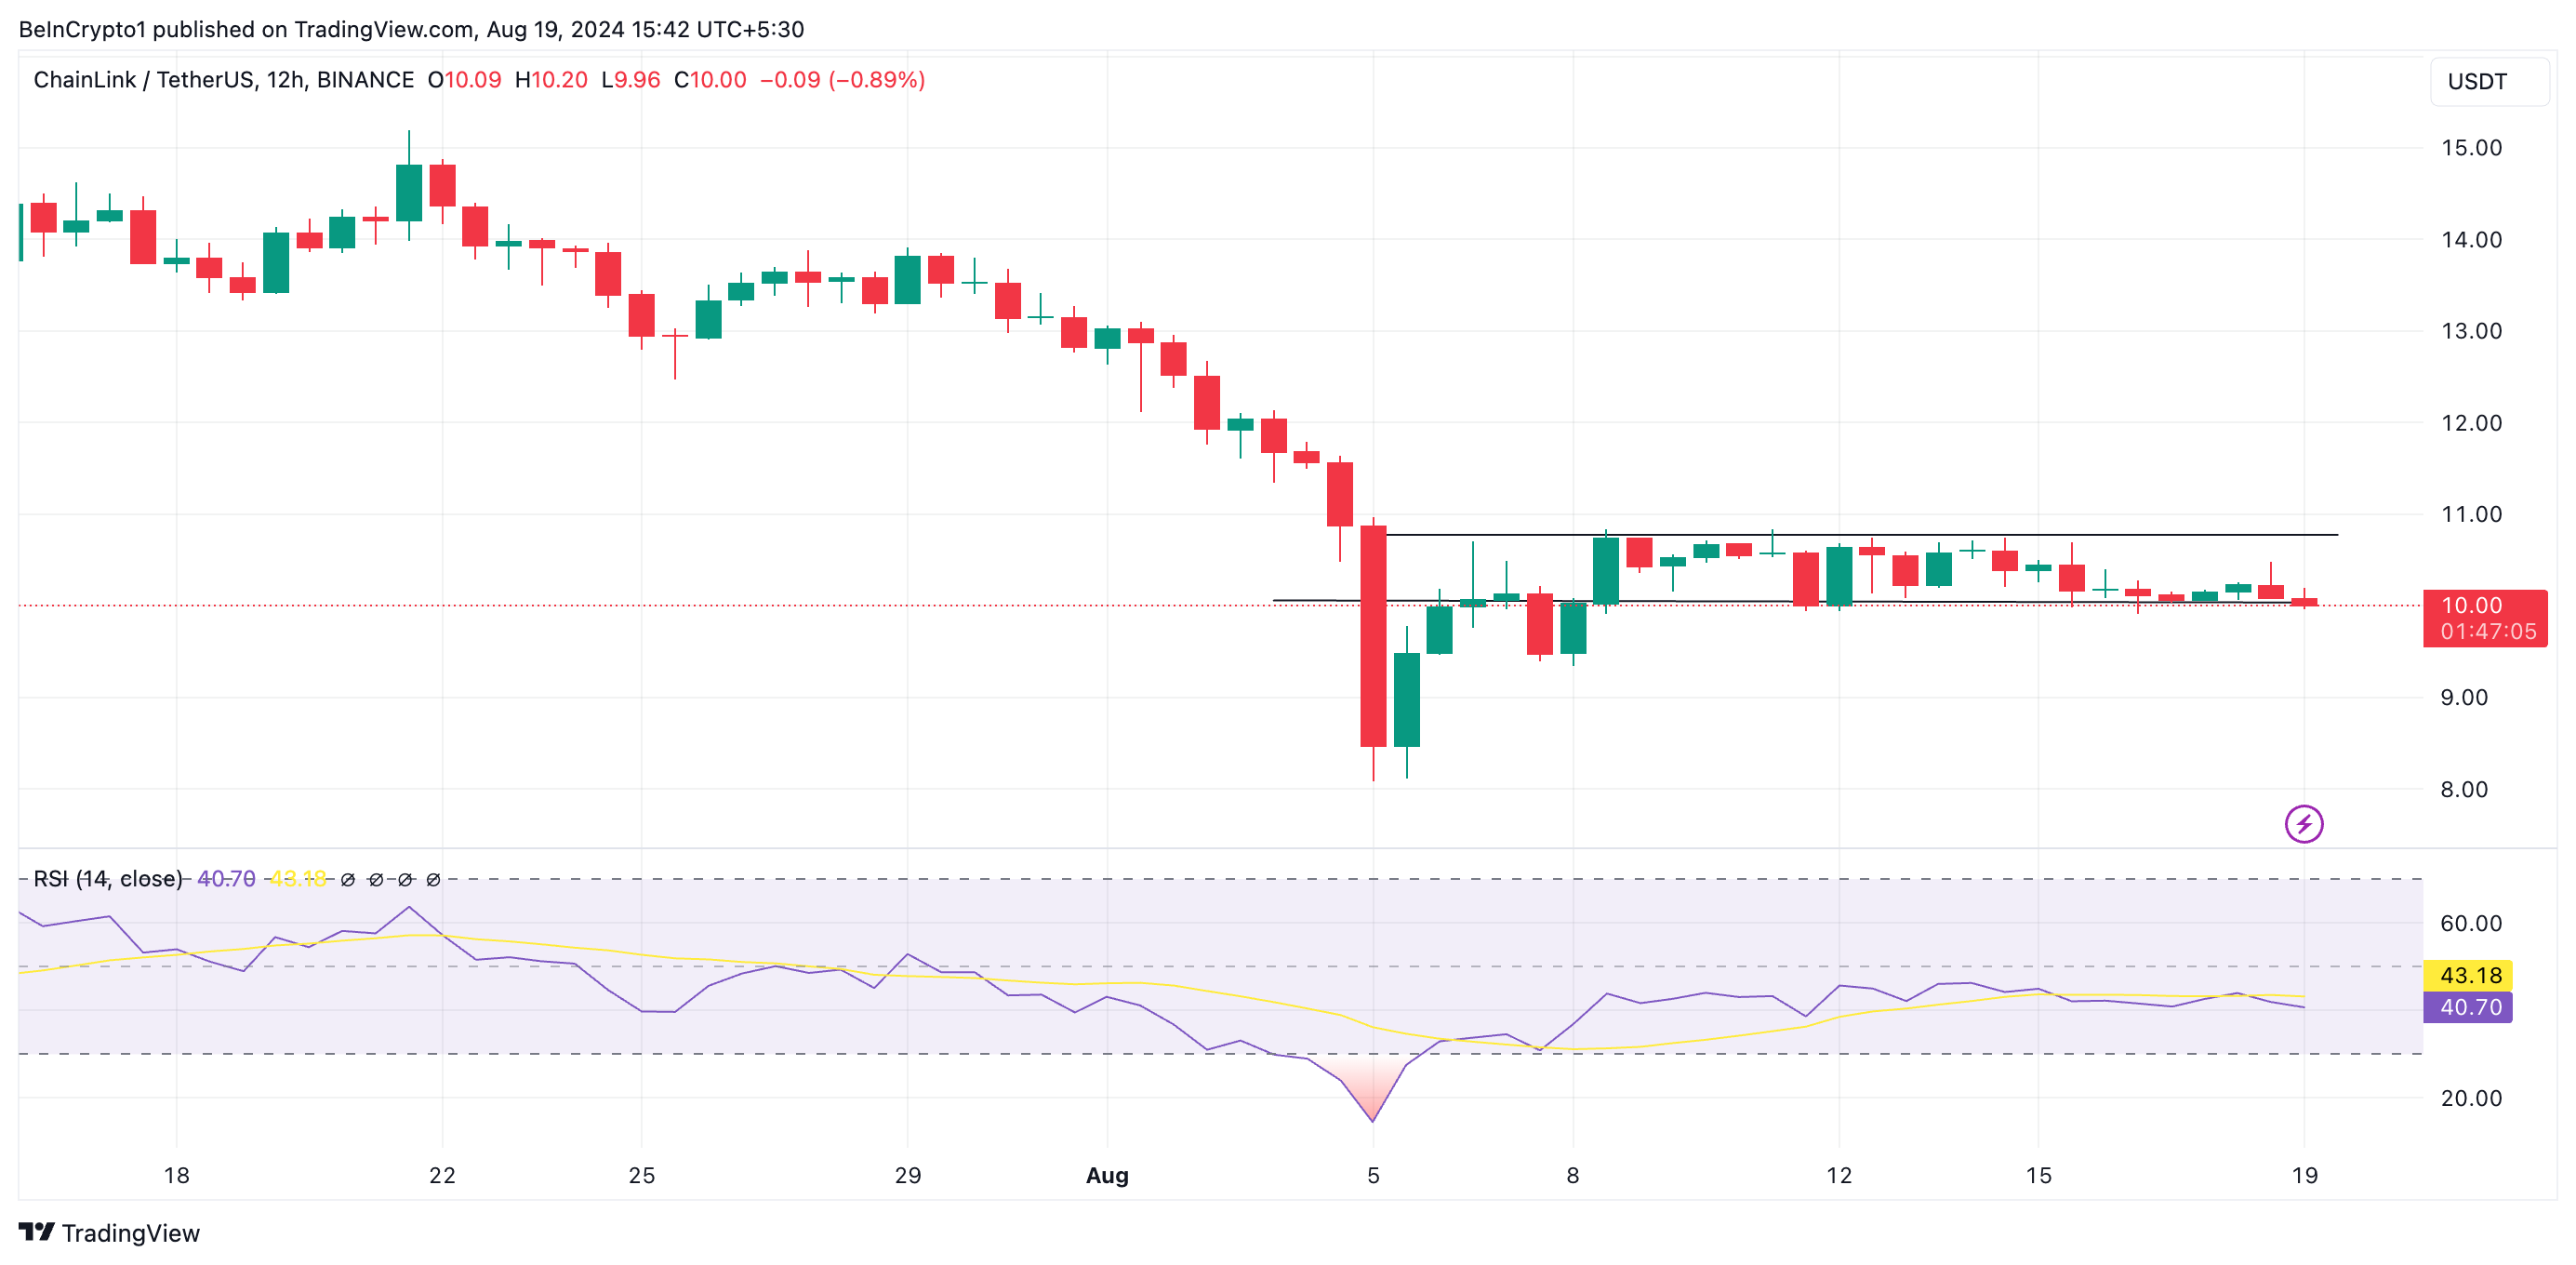
When an asset’s RSI is flat, it indicates market indecision or consolidation, with neither strong buying nor selling momentum. In LINK’s case, sellers are hesitant to offload due to most transactions ending in losses rather than profits.
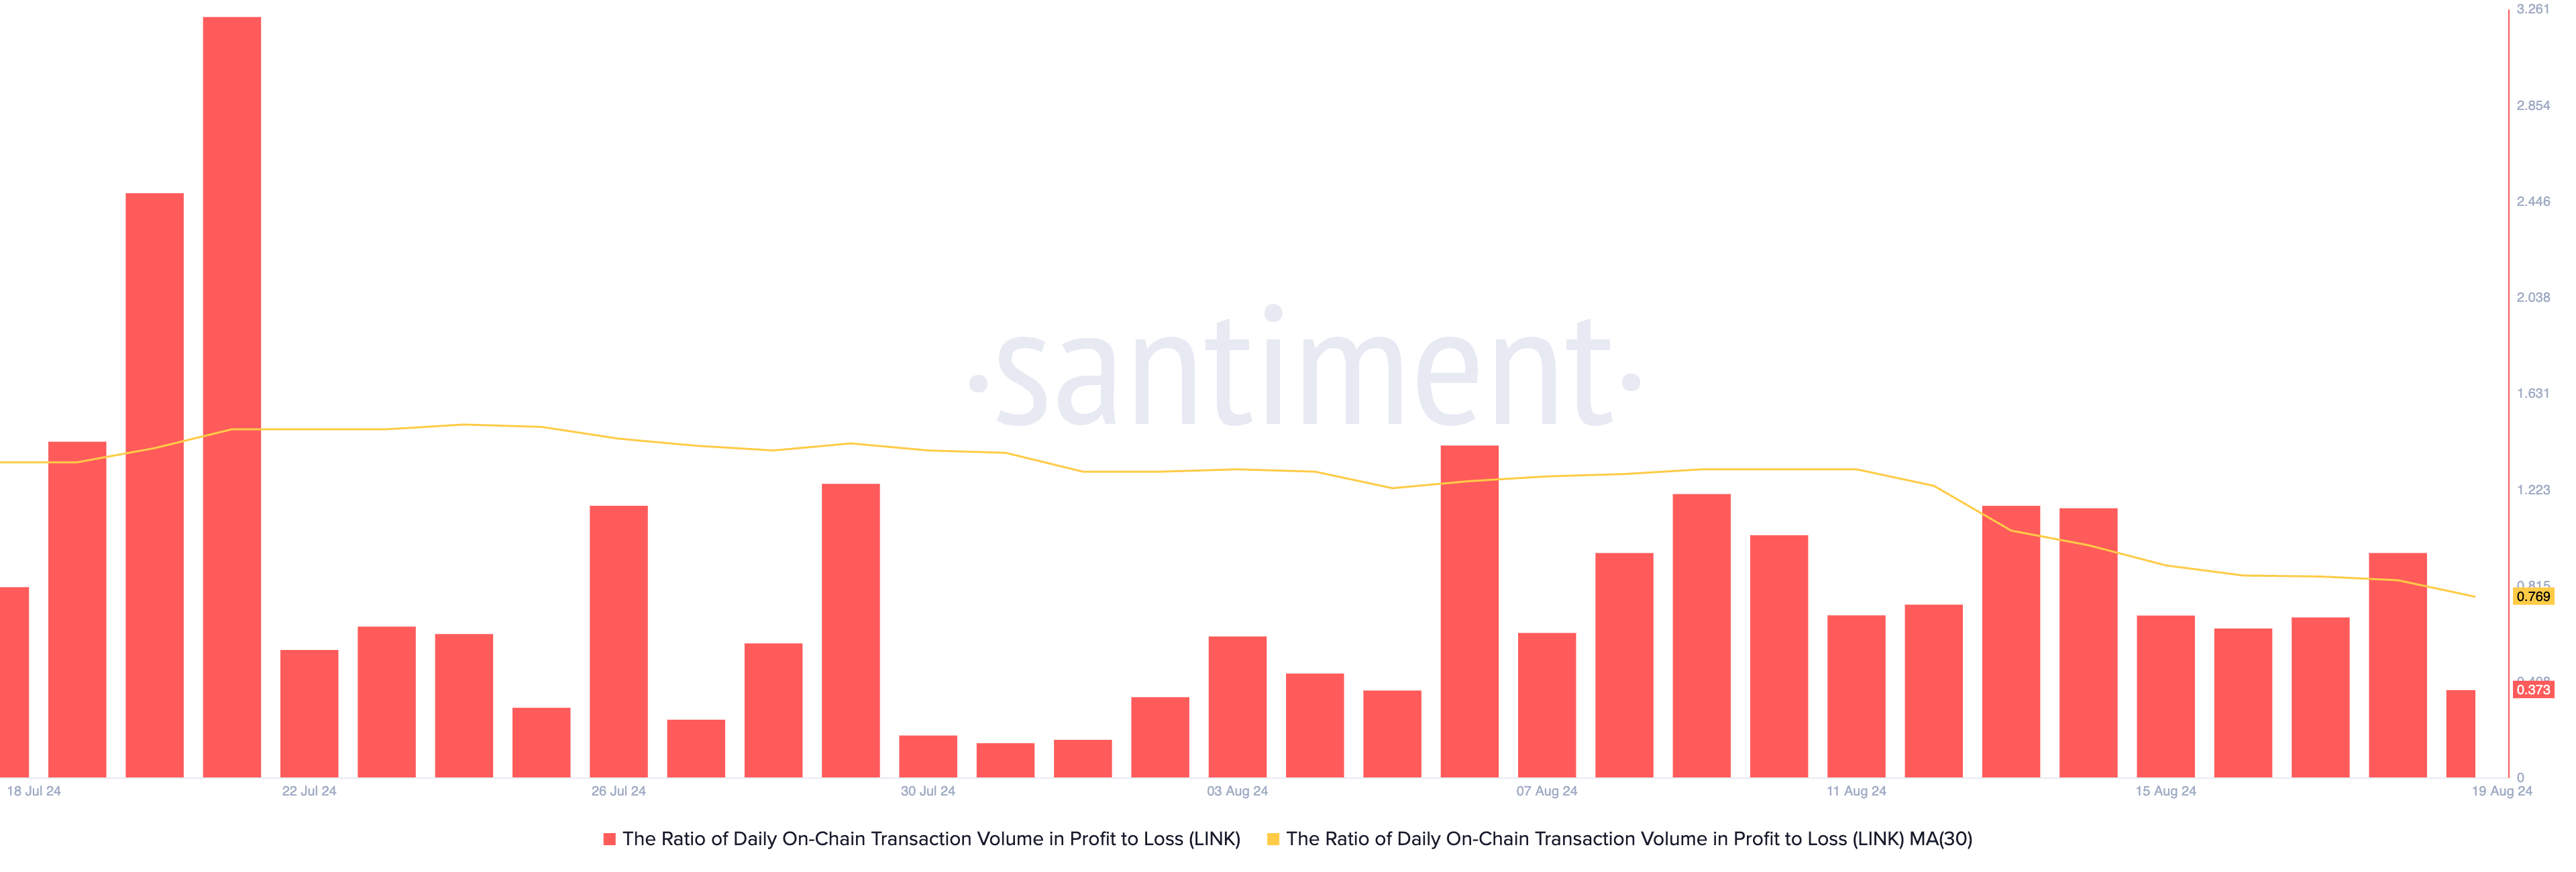
On-chain data from Santiment shows the daily transaction volume in profit is lower than in loss, with a ratio of 0.76 based on a 30-day moving average. This means that for every transaction resulting in a loss, only 0.76 transactions yield a profit.
However, for LINK buyers looking to trade against the market, the ongoing price consolidation has presented a buying opportunity.
LINK’s market value to realized value (MVRV) ratios assessed over different moving averages have flashed buy signals. At press time, the token’s 30-day and 90-day MVRV ratios are -10.39 and -22.73, respectively.
This metric measures the ratio between an asset’s current market price and the average price of its coins or tokens in circulation.
Read more: Chainlink (LINK) Price Prediction 2024/2025/2030
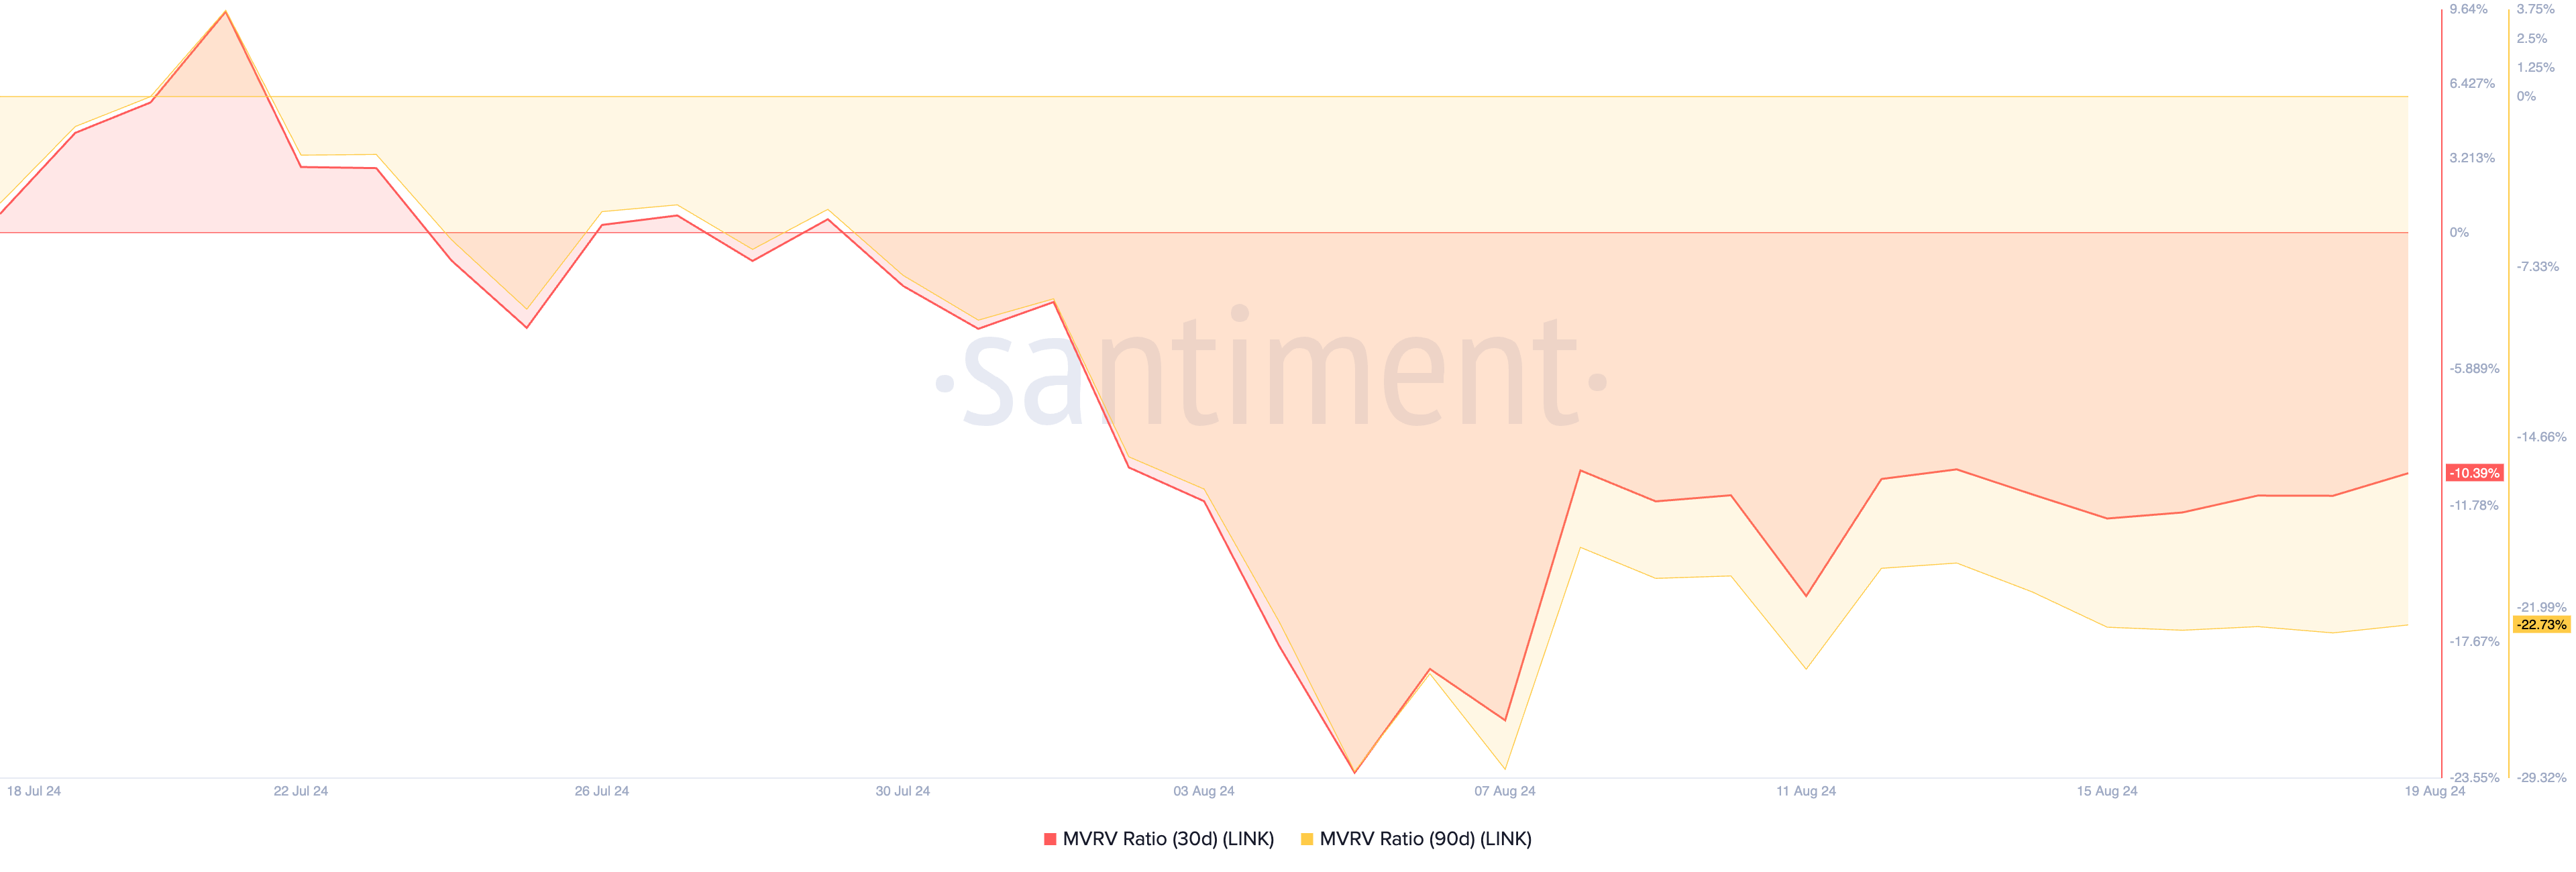
When an asset’s MVRV ratio is below zero, it is undervalued. Its current price is lower than the average price of all its tokens in circulation, presenting an opportunity for those looking to “buy the dip.”
LINK Price Prediction: This Support Level Is Critical
As mentioned, LINK is trading near the lower line of its horizontal channel, which forms key support. If bulls fail to hold this level, it would suggest that selling pressure is surpassing buying activity, indicating a potential further decline.
In this scenario, LINK’s price could drop below $10 and head toward $8.17.
Read more: Chainlink ETF Explained: What It Is and How It Works
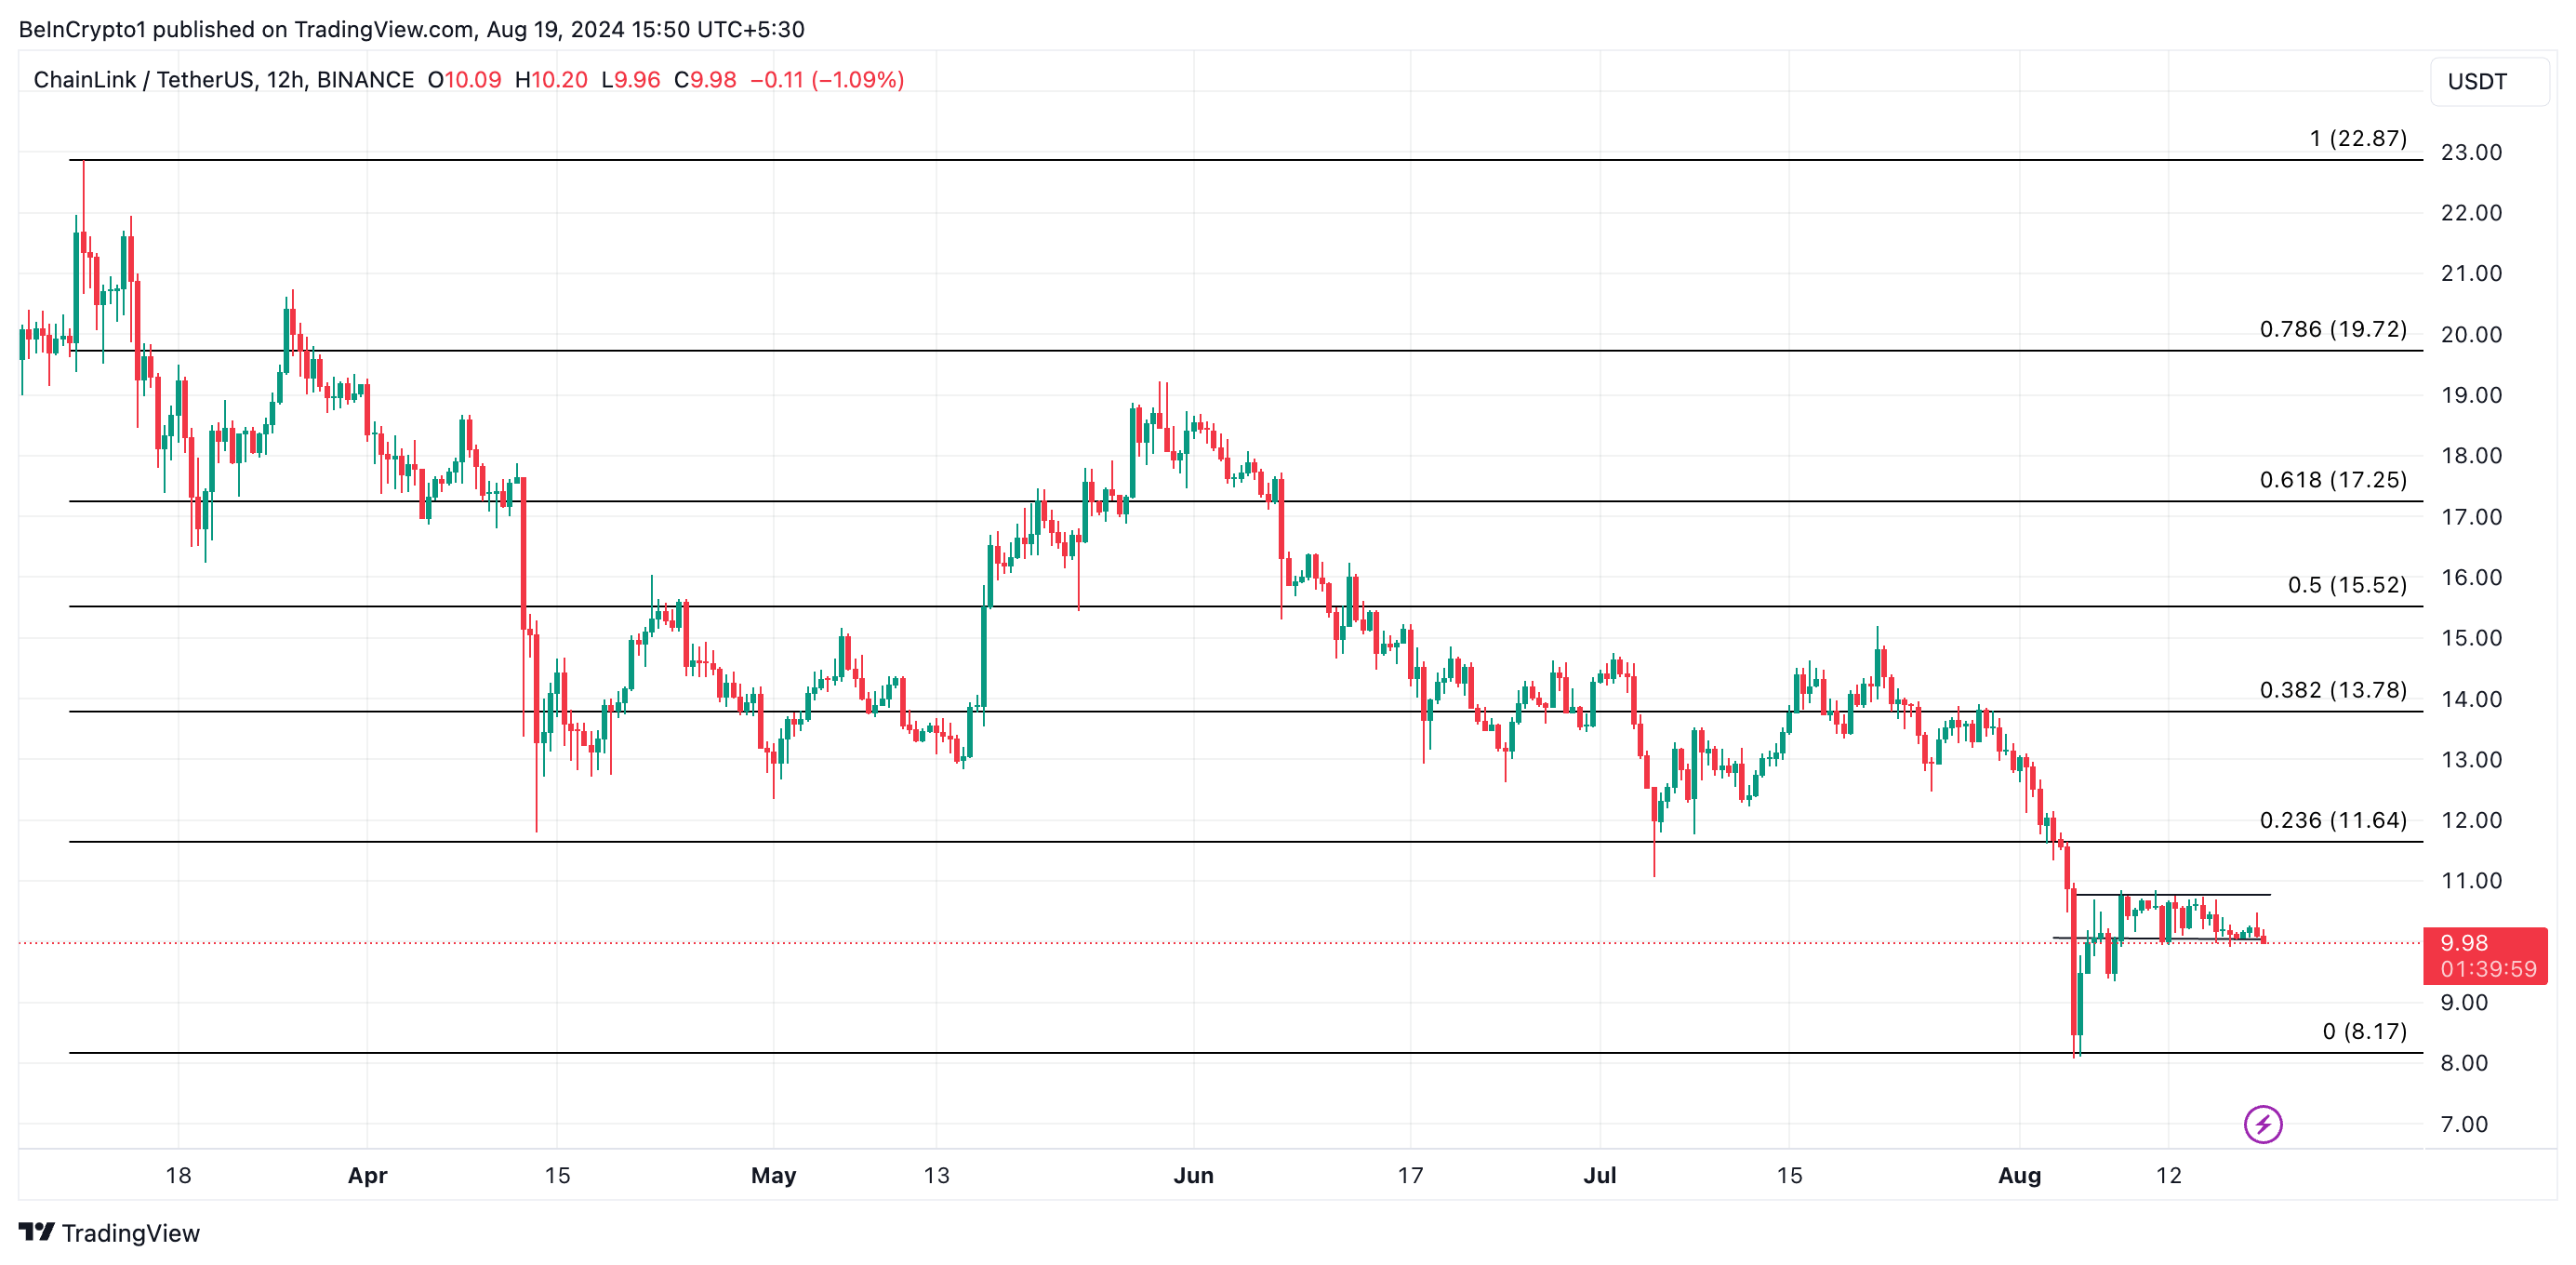
However, if the demand for LINK surges and it breaks above resistance, the bearish projection is invalidated, and the token’s price will climb to $11.64.
