

On Oct 8, the ChainLink (LINK) price broke out from a descending resistance line that had been in place for 52 days.
While a short-term decline could occur, the price should resume its upward move afterward.
LINK Breaks Out From Resistance
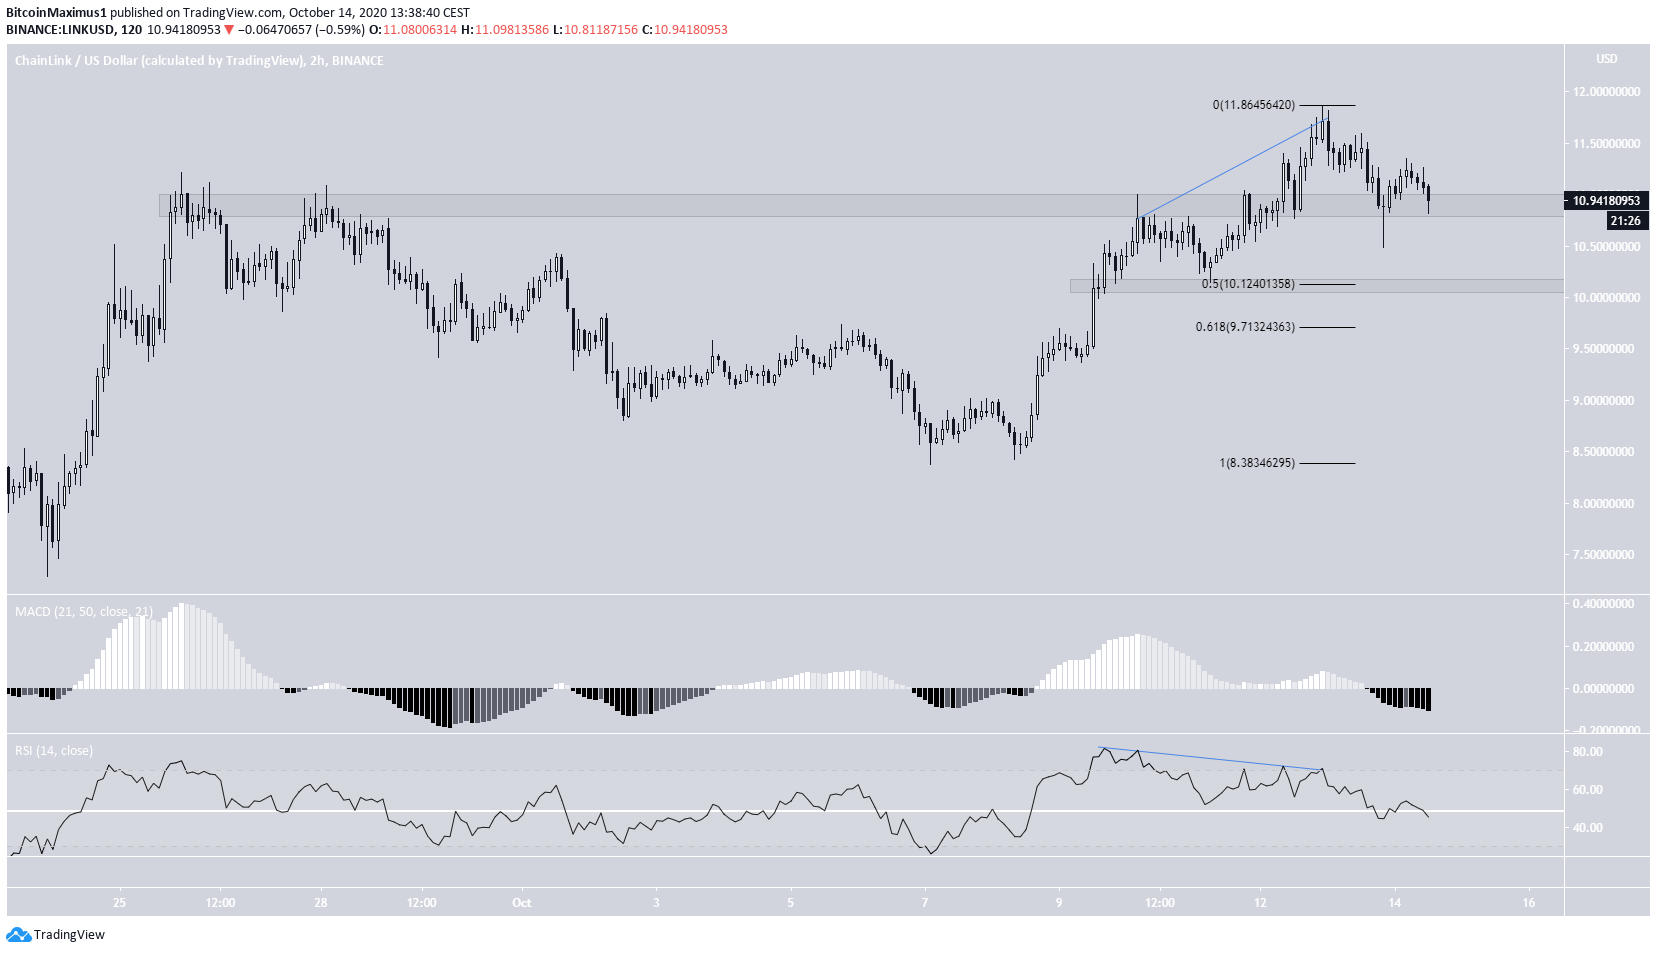
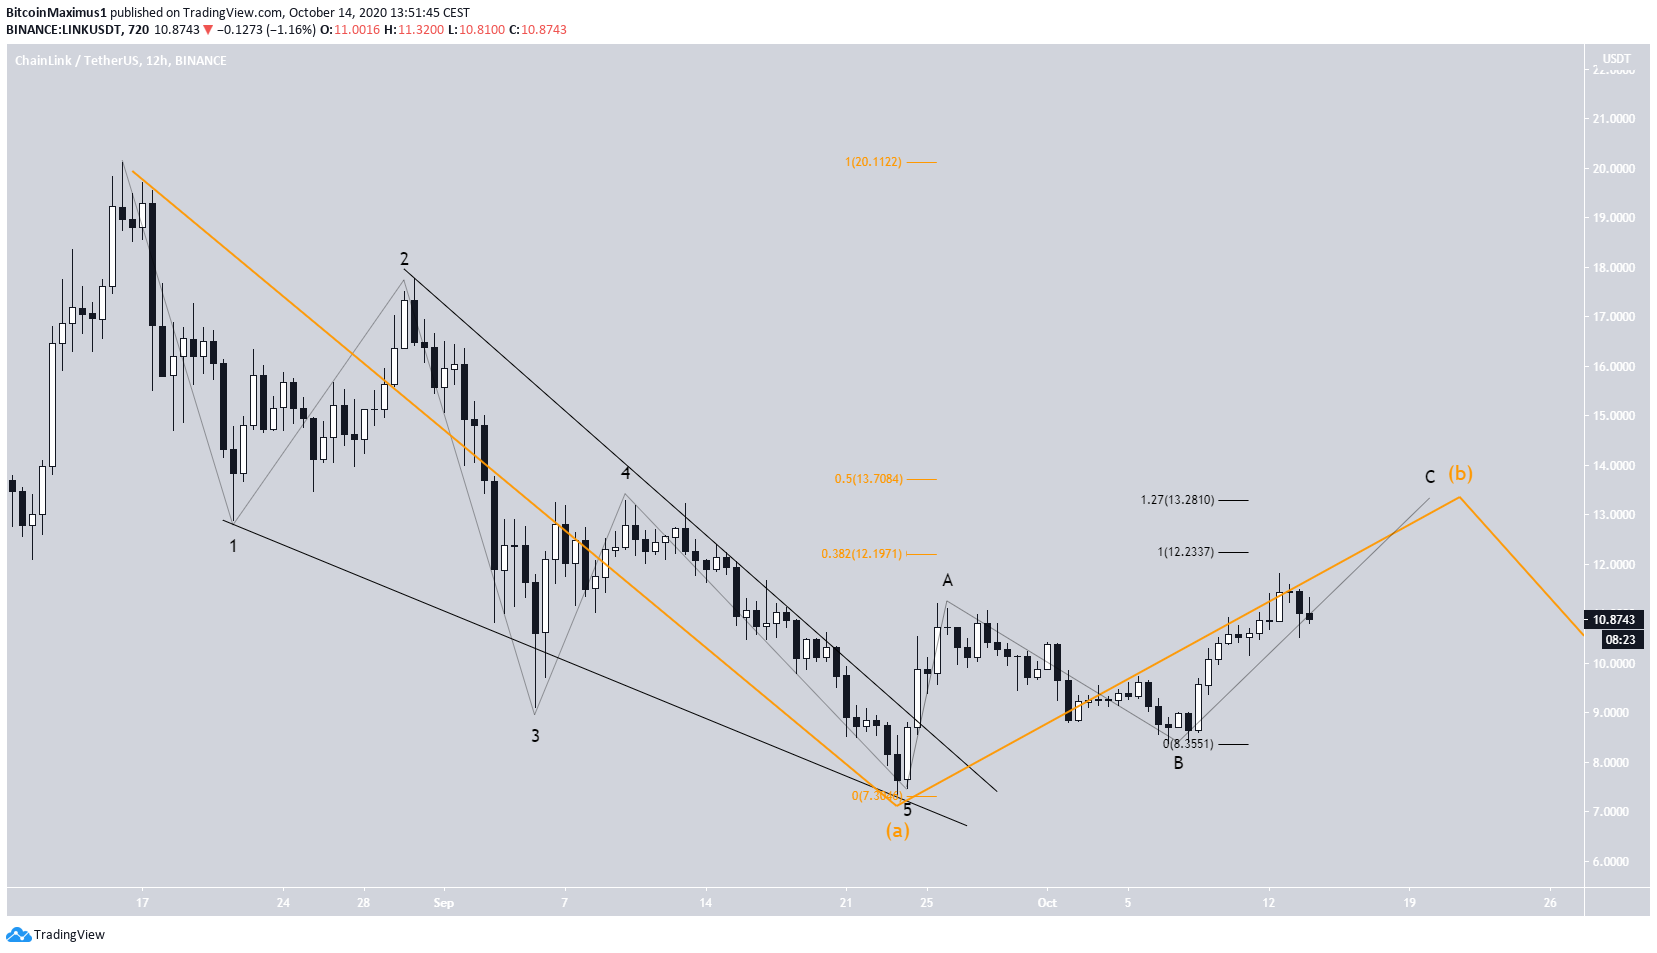
The LINK price has been moving downwards since it reached a high of $20.71 on Aug 17. The fall followed a descending resistance line and continued until the price reached a low of $7.28 on Sept 23. LINK has been increasing since. On Oct 9, the price broke out from this resistance line and continued moving upwards until it broke out above the $9.80 resistance area a few days later. Currently, it is in the process of validating this area as support. If the price continues to climb, the next resistance area would be found at $13.20. Conversely, a breakdown could take the price all the way down to $7.30.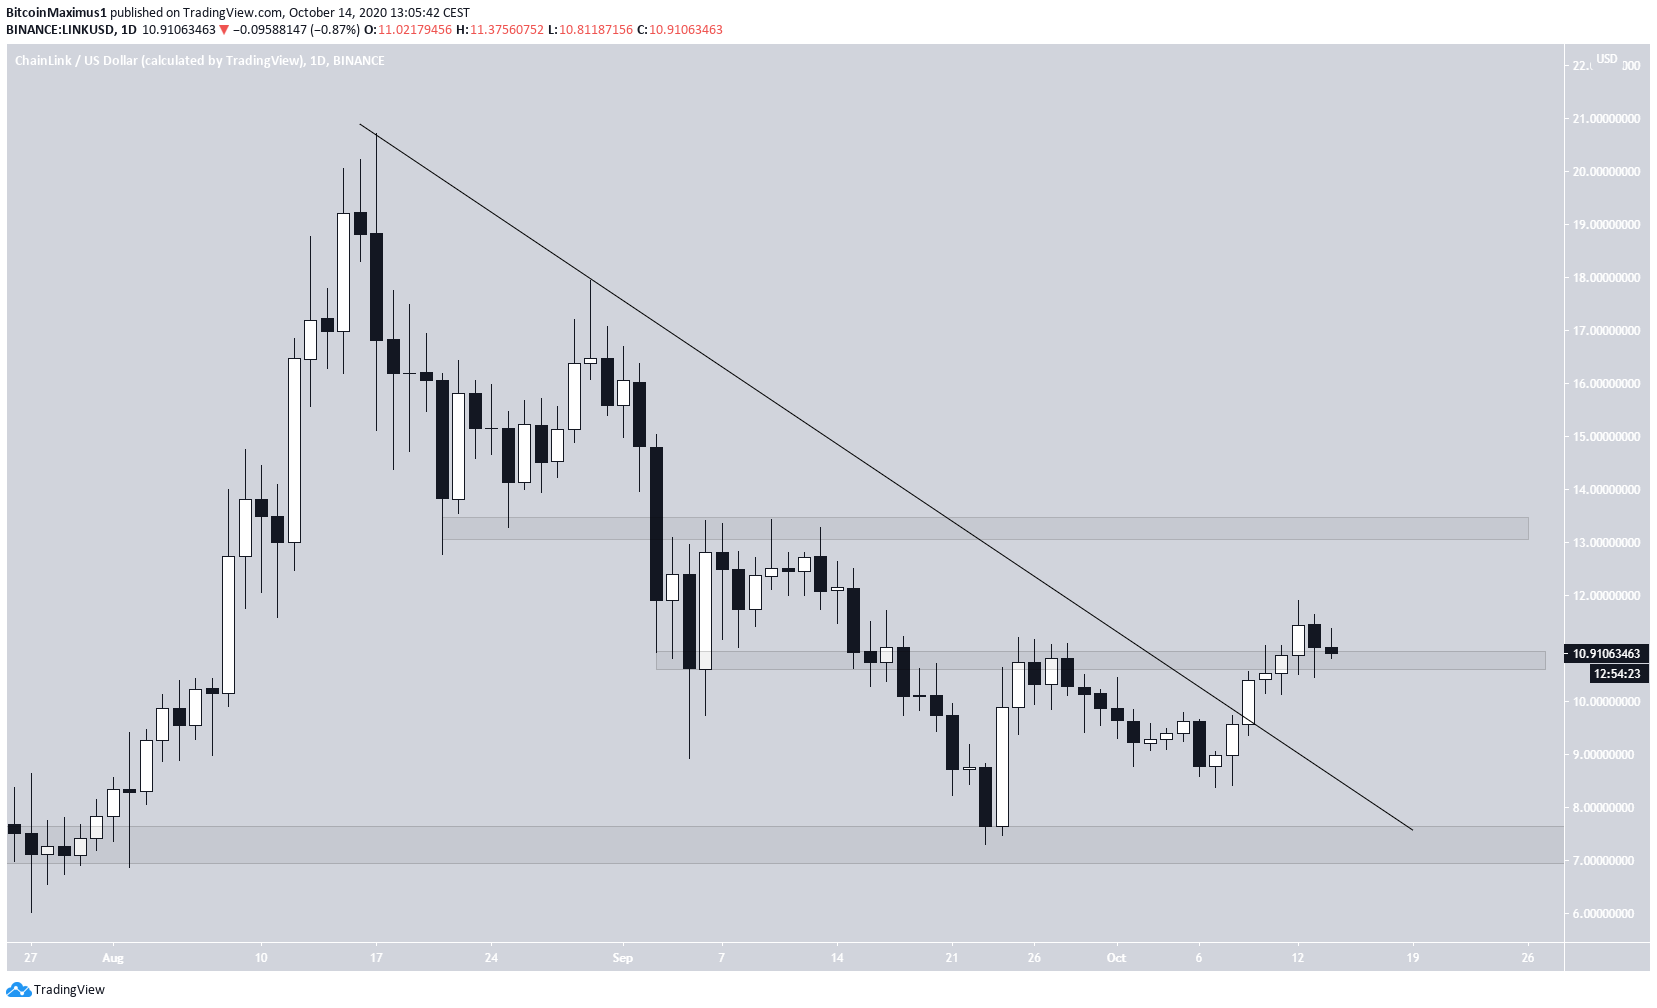
Bullish Indicators
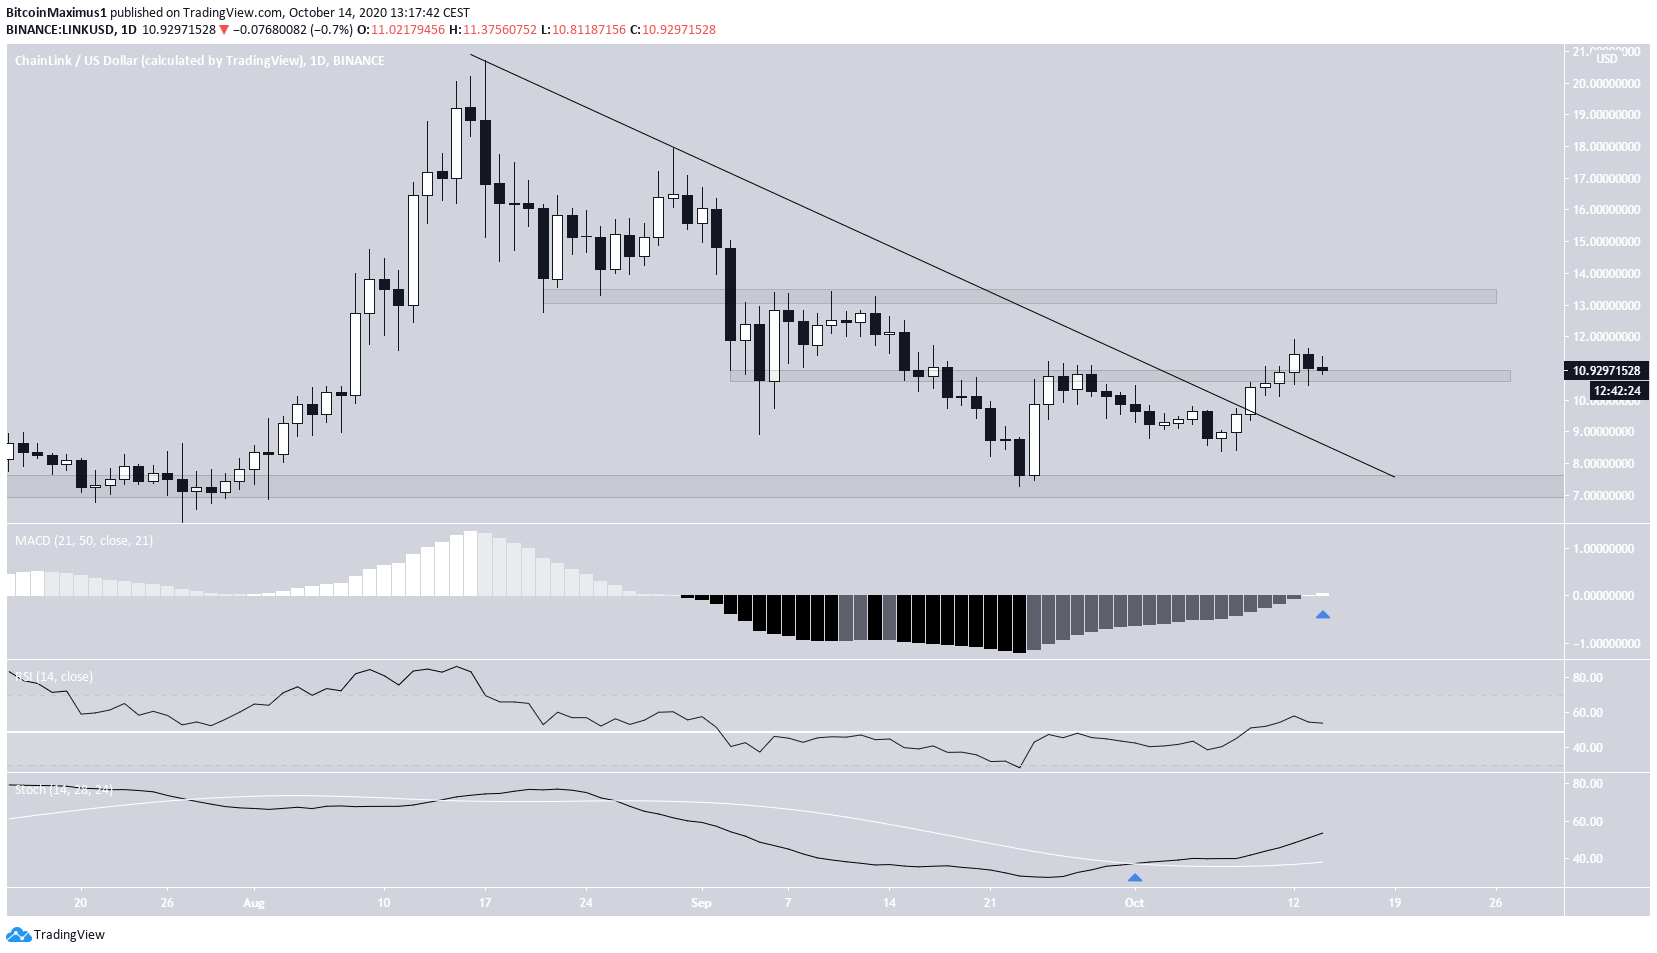
Technical indicators are bullish and support the previous rally towards resistance.- The MACD has just crossed into positive territory.
- The RSI has crossed above 50.
- The Stochastic Oscillator has made a bullish cross.
Wave Count
Cryptocurrency trader @TheEWguy outlined a LINK chart, in which he shows a completed bullish impulse and expects a pullback towards $9.50.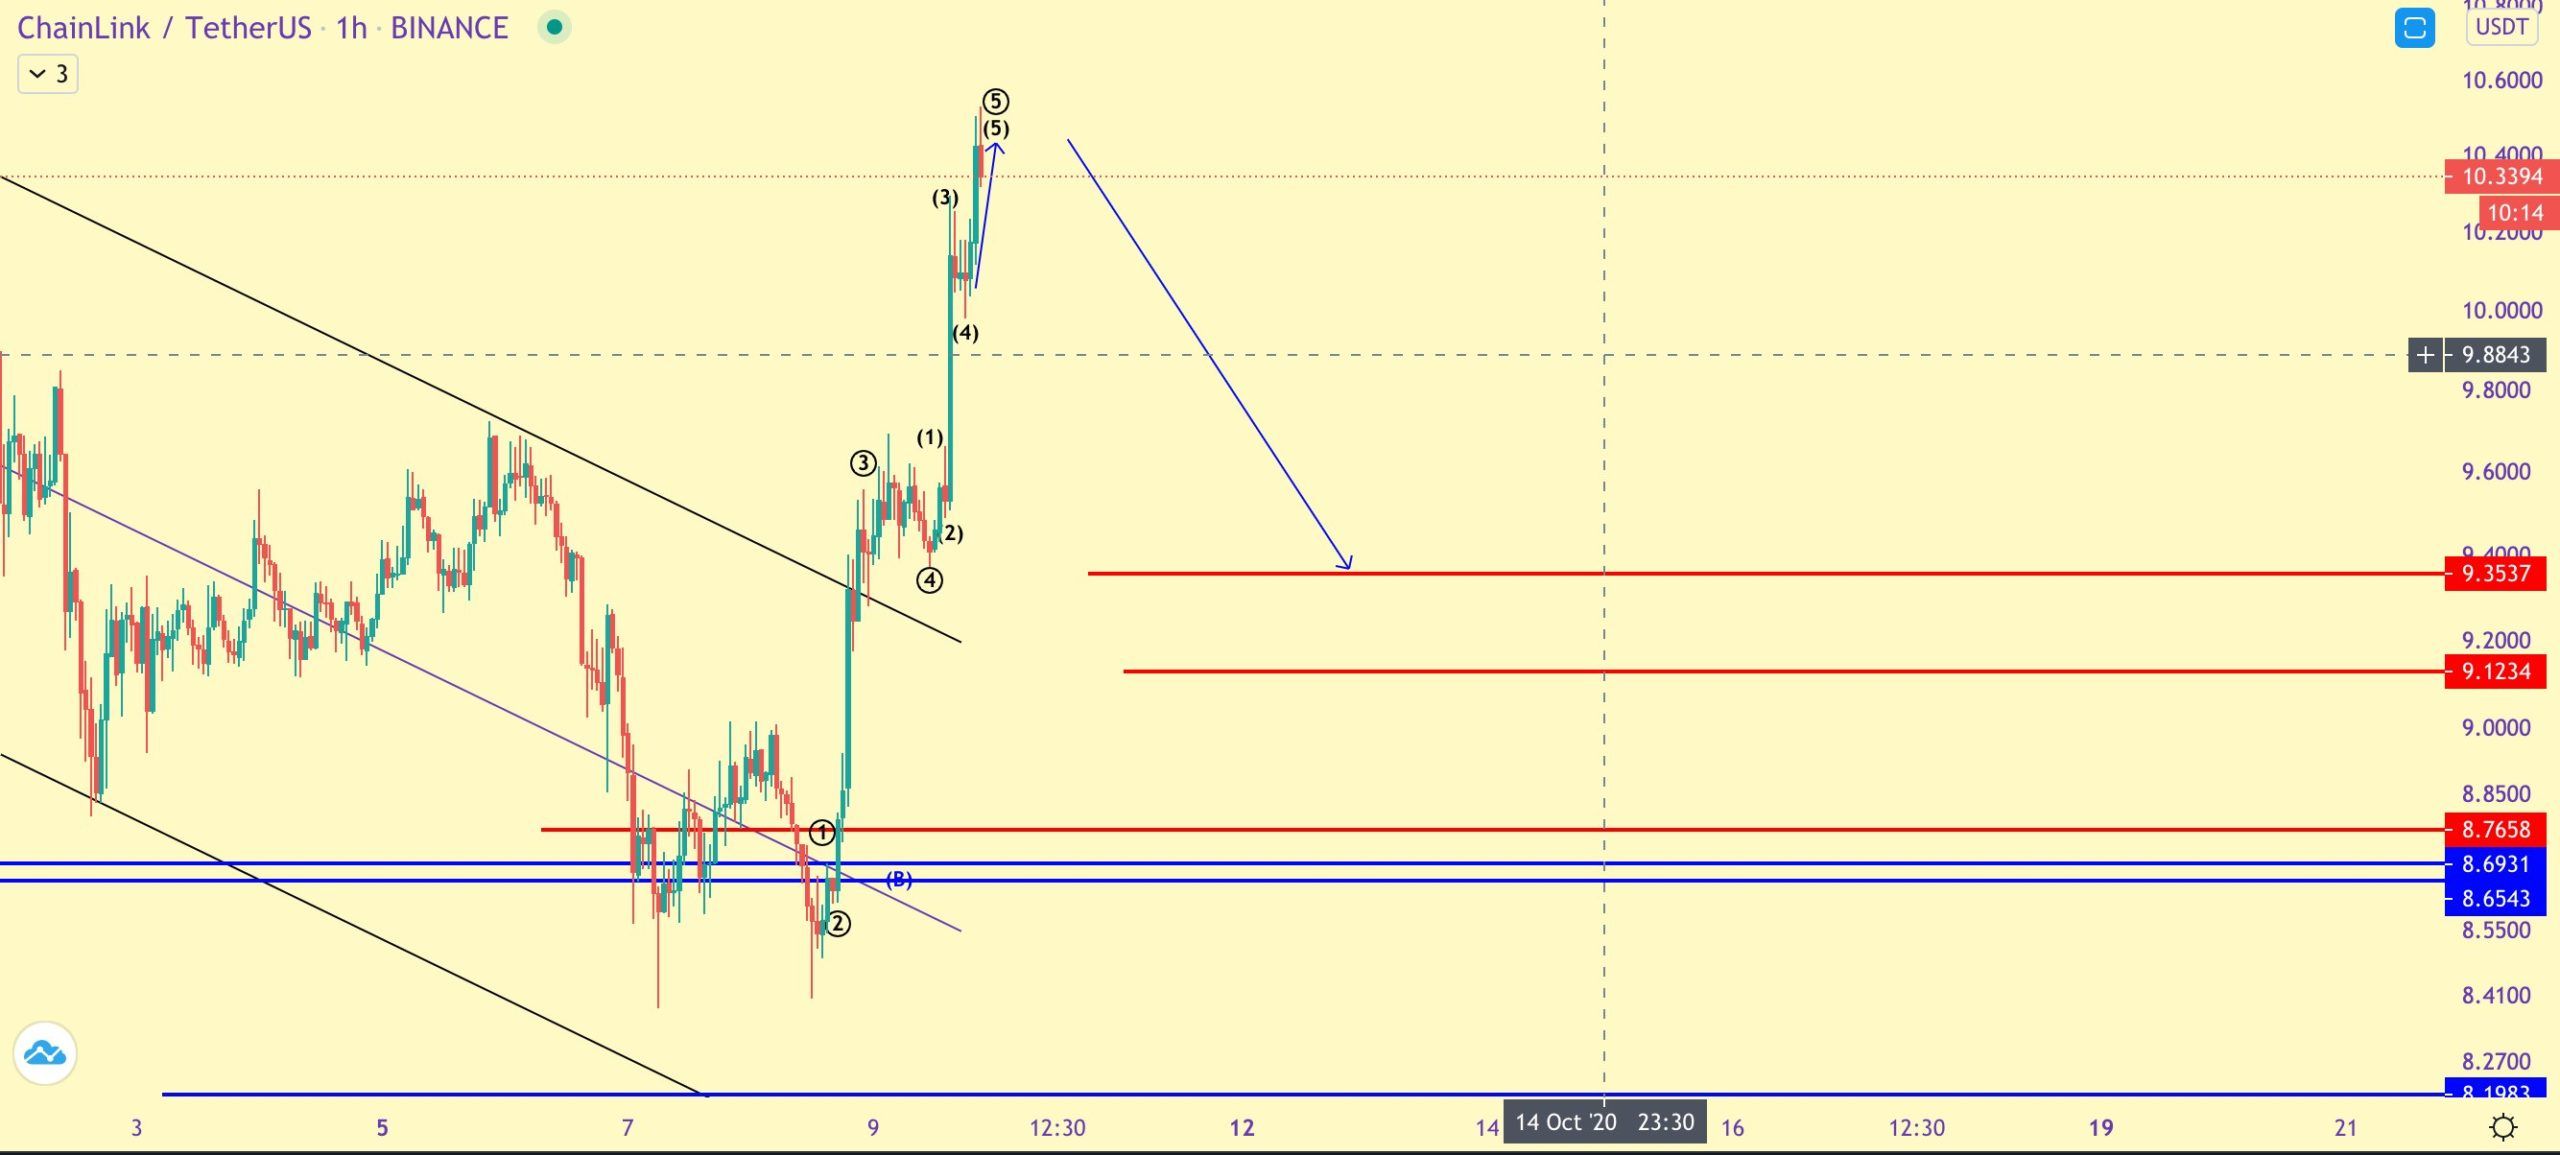

Top crypto platforms in the US
Disclaimer
In line with the Trust Project guidelines, this price analysis article is for informational purposes only and should not be considered financial or investment advice. BeInCrypto is committed to accurate, unbiased reporting, but market conditions are subject to change without notice. Always conduct your own research and consult with a professional before making any financial decisions. Please note that our Terms and Conditions, Privacy Policy, and Disclaimers have been updated.

Valdrin Tahiri
Valdrin discovered cryptocurrencies while he was getting his MSc in Financial Markets from the Barcelona School of Economics. Shortly after graduating, he began writing for several different cryptocurrency related websites as a freelancer before eventually taking on the role of BeInCrypto's Senior Analyst.
(I do not have a discord and will not contact you first there. Beware of scammers)
READ FULL BIO
Sponsored
Sponsored