
BeInCrypto takes a look at Bitcoin (BTC) on-chain indicators that relate to lifespan, such as spent volume age bands and Coin Days Destroyed (CDD).
What is CDD?
CDD is a lifespan indicator that shows if spent BTC was previously unspent for a long-time. Every day that a coin remains dormant, it creates a “coin day”. Afterward, these days are destroyed once the coin is spent.
To sum up, high readings suggest that the coins that are currently spent have been held for a long-time.
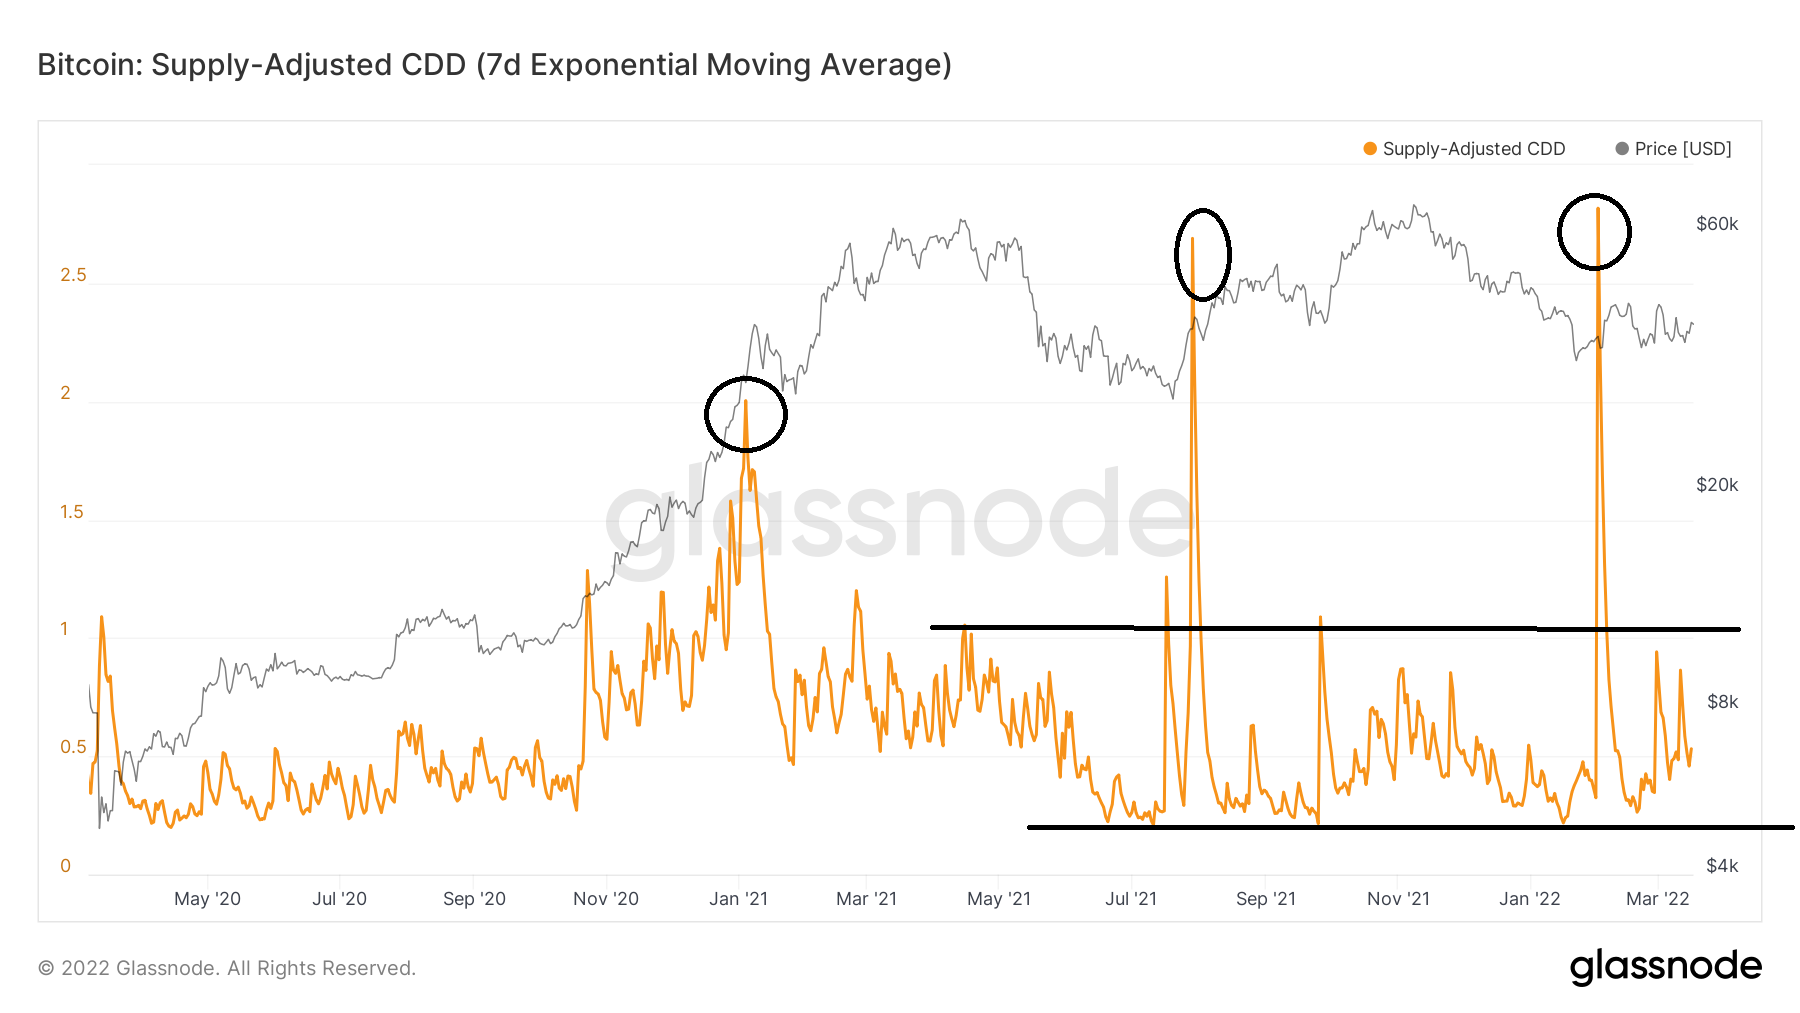
The supply-adjusted CDD divides the value by the circulating supply. In the current bull-run, CDD has spiked three times (black circles):
- Jan 4, 2021 – CDD reading of 2
- July 29, 2022 – CDD reading of 2.29
- Feb 1 2022, CDD reading of 2.81
Besides those three dates, CDD has hovered in a range between 0.25 – 1. Currently, it is showing a reading of 0.53. Relative to its range, it means that the coins that are currently being transacted are mostly short-term coins.
Binary and long-term CDD
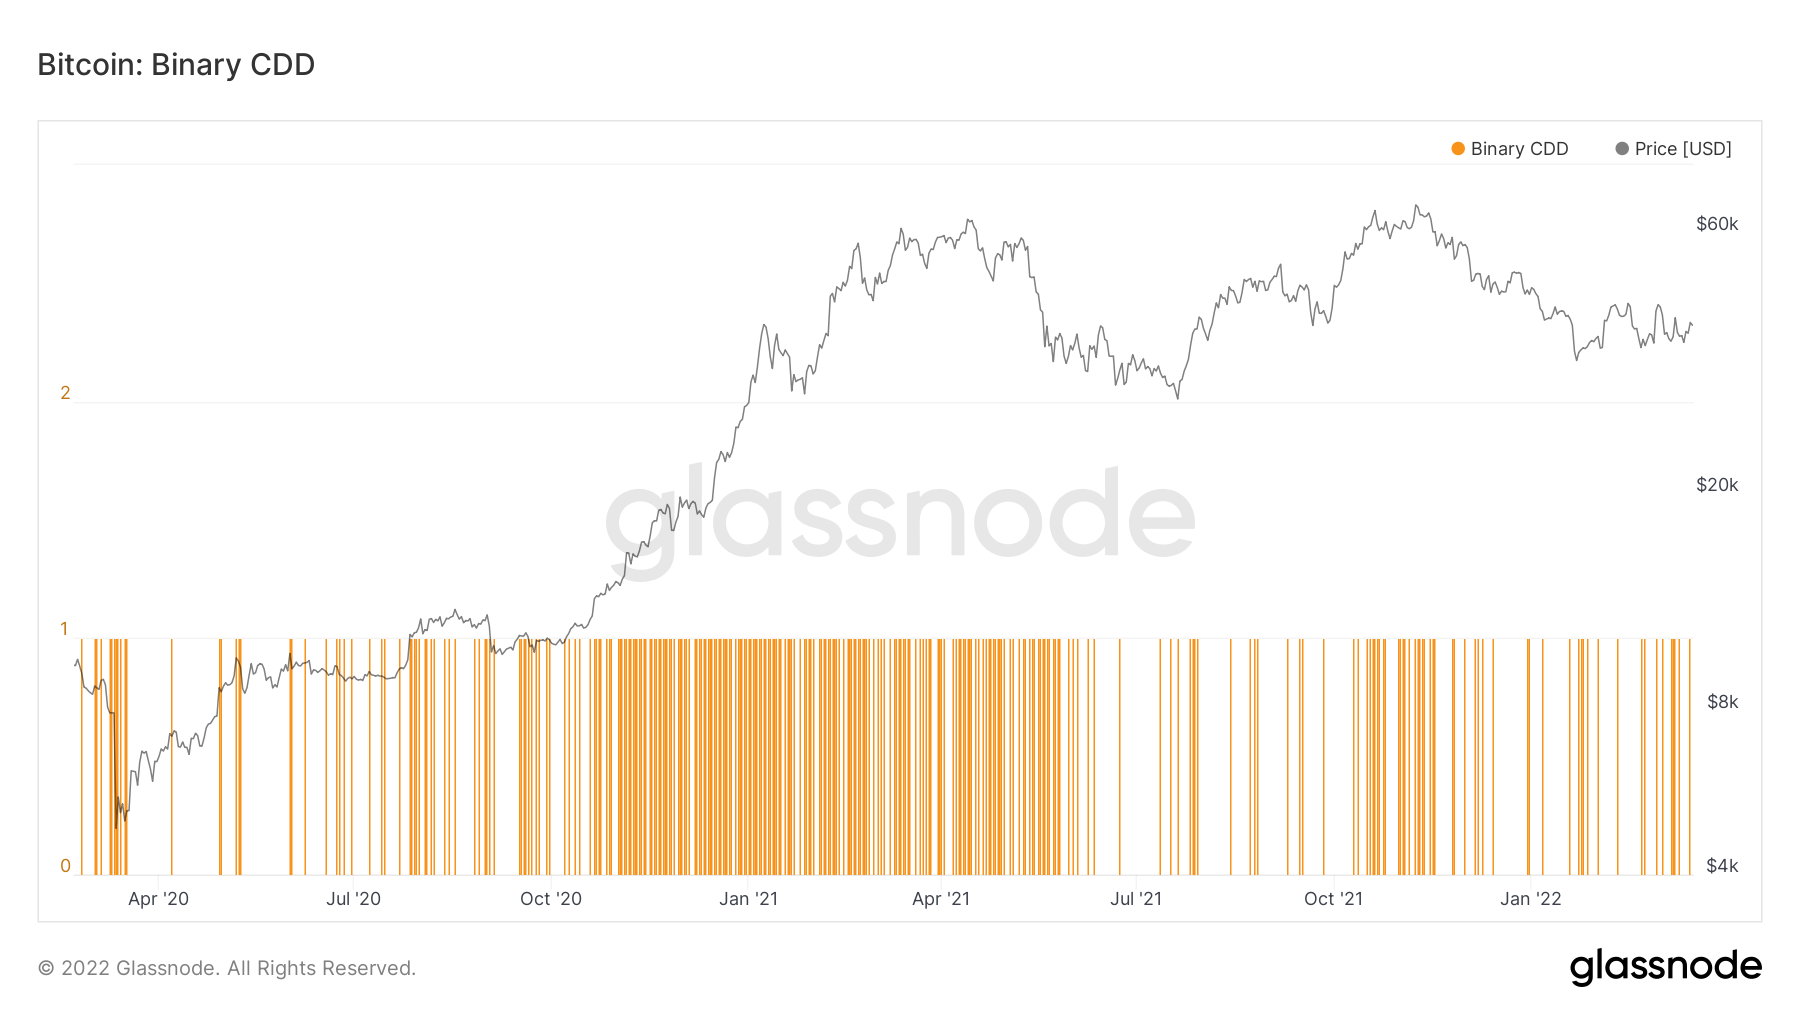
Binary CDD is a variation of the regular CDD. It gives a reading of one if CDD is higher than average, while a reading of 0 if it is not.
In the current bull run, CDD was giving higher than average readings in the period between Nov 2020 – May 2021.
However, since July 2021, the majority of days have had less than average CDD. This trend has continued in 2022.
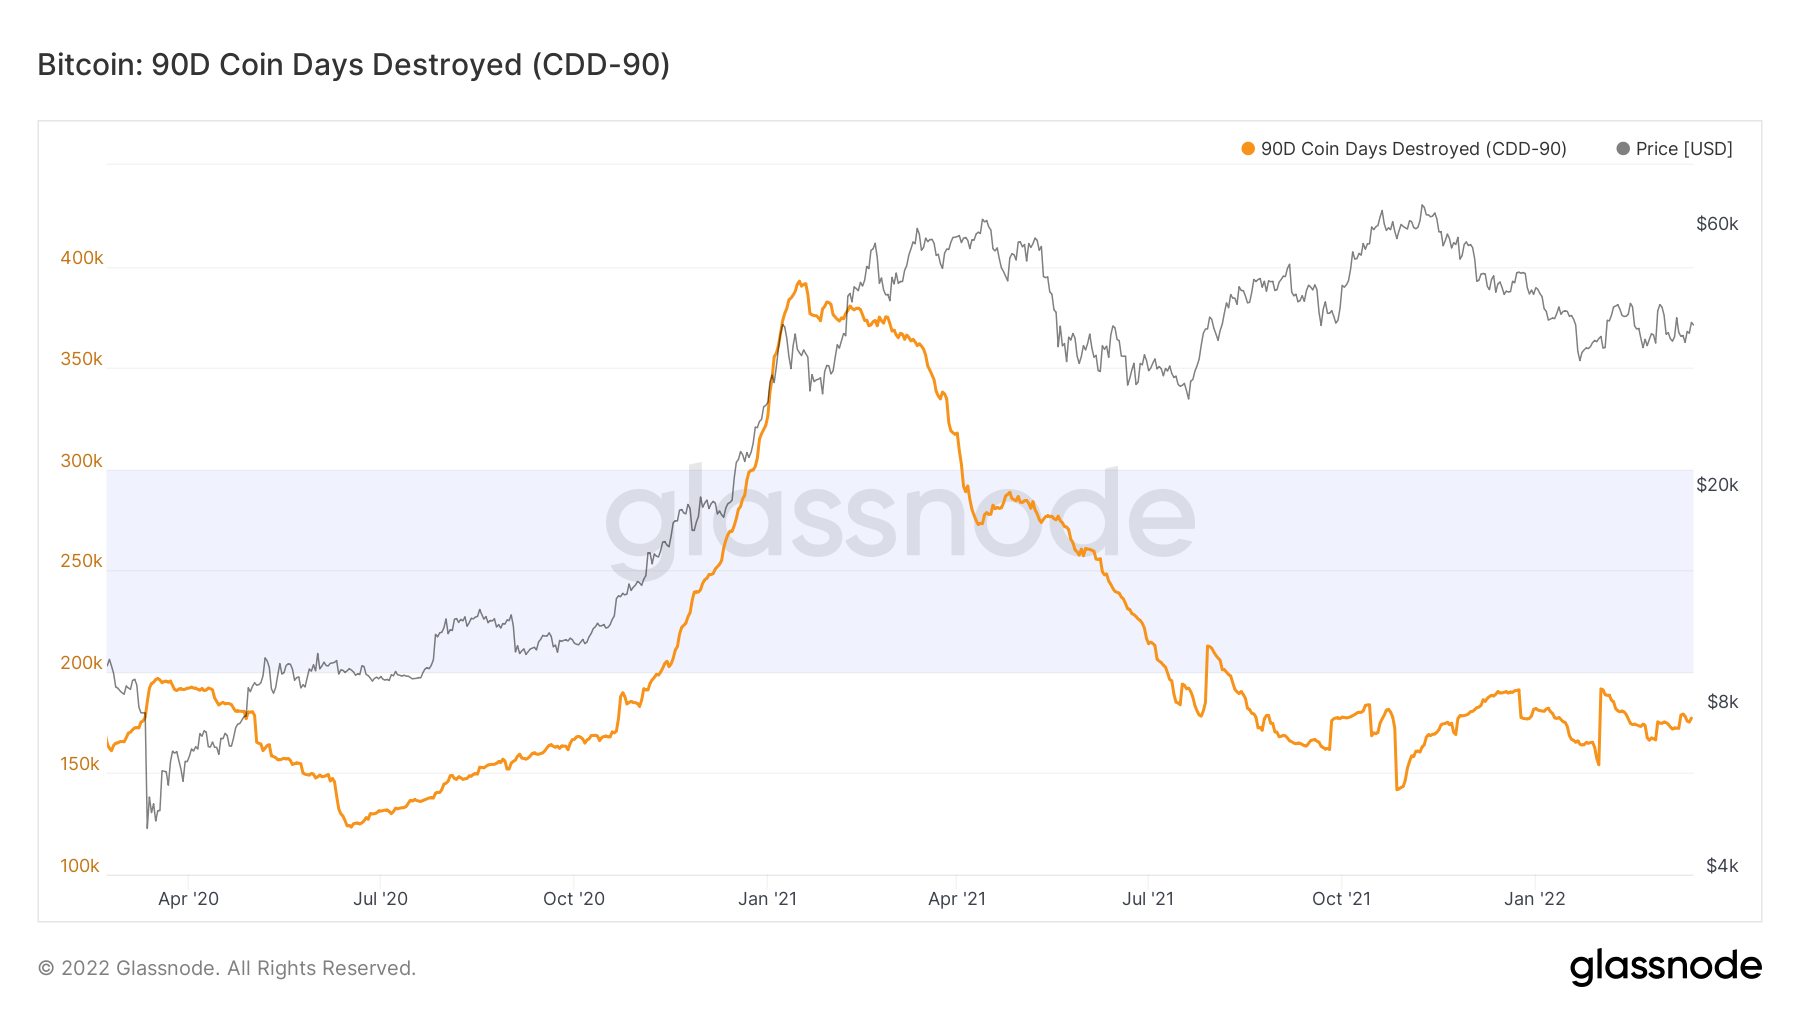
The 90-day CDD is the 90-day rolling sum of Coin Days Destroyed (CDD). Historically, values below 200 have been associated with bottoms.
The indicators increased considerably at the beginning of 2021, culminating with a high 391,149 on Jan 2021. However, it has been falling since and reached a low of 141,830 on Oct 27.
90-day CDD has been below 200 since, which is considered an oversold region.
Spent volume age bands
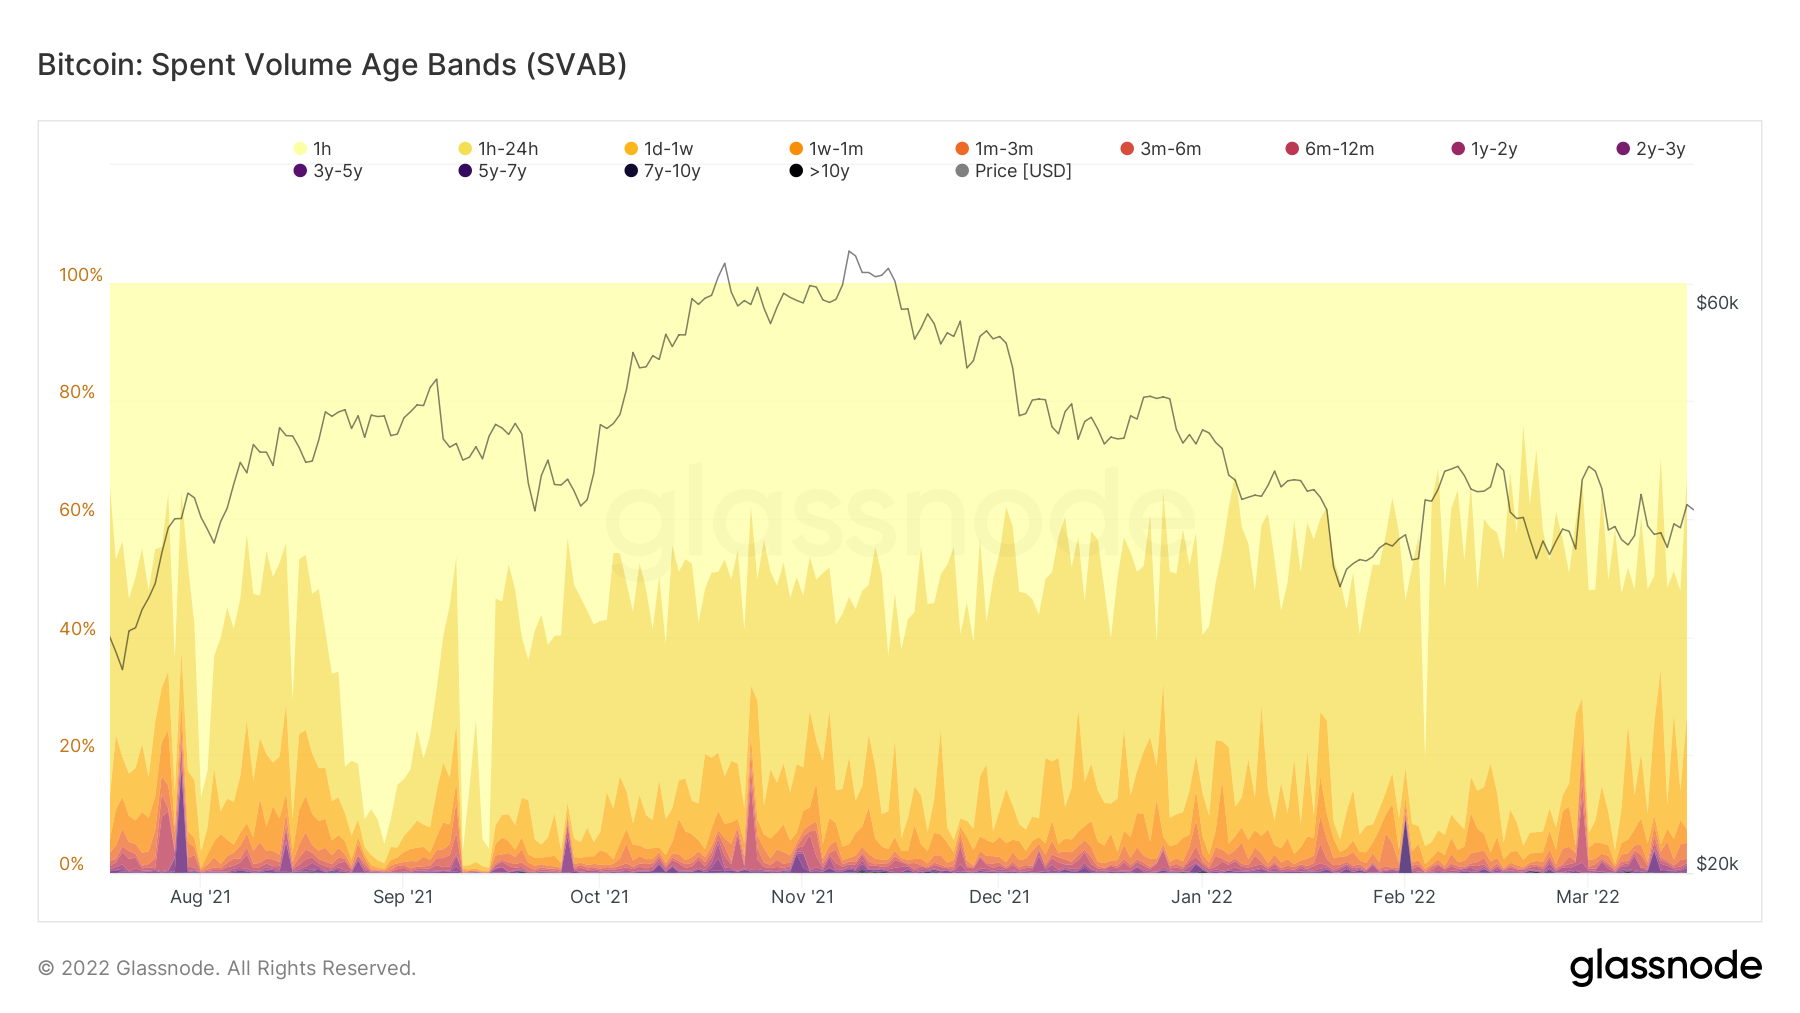
Spent Volume Age Bands (SVAB) show the on-chain volume based on the age of each coin. The bands represent the percentage of volume that has moved in the specified time frame.
They are similar to Spent Output Age Bands, however, they measure the volume instead of the total output.
The indicator shows that over 90% of volume has occurred inside the bands of 1 hour – 1 week (yellow, light orange, dark orange).
Therefore, this echoes the readings from CDD which indicate that the vast majority of coins being spent are from short-term holders.
For BeInCrypto’s latest Bitcoin (BTC) analysis, click here
