Throughout this piece, we will cover Storj fundamentals, tokenomics, competitor strength, on-chain metrics, social activity, and technical analysis. While we aim to be as descriptive as possible, ensure you research extensively and independently before making an investment decision.
If you have unused space on your computer, you could be in the money. How? By using Storj, a decentralized cloud storage ecosystem. With the likes of Filecoin, Sia, and now Storj moving up the ranks, the future of open-source and decentralized storage is promising. Storj even has a participant incentivizing option, thanks to the native STORJ token. So, is buying STORJ a good option? Read through this STORJ price prediction piece for a detailed answer.
- STORJ price prediction and the role of fundamental analysis
- Storj token economics and price forecast
- Should you invest in STORJ? A look at on-chain metrics
- STORJ was volatile: market cap and trading volume suggest
- STORJ price forecast based on performance analysis
- Storj social activity and price forecast
- STORJ price prediction using technical analysis
- Storj (STORJ) price prediction 2023
- Storj (STORJ) price prediction 2024
- Storj (STORJ) price prediction 2025
- Storj (STORJ) price prediction 2030
- Storj (STORJ’s) long-term price prediction until 2035
- How accurate is the STORJ price prediction?
- Frequently asked questions
STORJ price prediction and the role of fundamental analysis
This project makes distributed storage safe, easy, and efficient — while keeping participants happy with STORJ tokens. Storj Labs manages the development of the Storj ecosystem.
Here are the fundamental aspects that you should know:
Did you know? Storj boasts the Tardigrade — a tool that aims to compete with the likes of S3, Google, and other cloud storage providers.
- Payment using STORJ tokens instead of fiat attracts a bonus. This might increase adoption over time.
- Allows users to transact using credit cards, as per the 2019 roadmap upgrade.
- Bugs and issues concerning memory leaks have been taken care of.
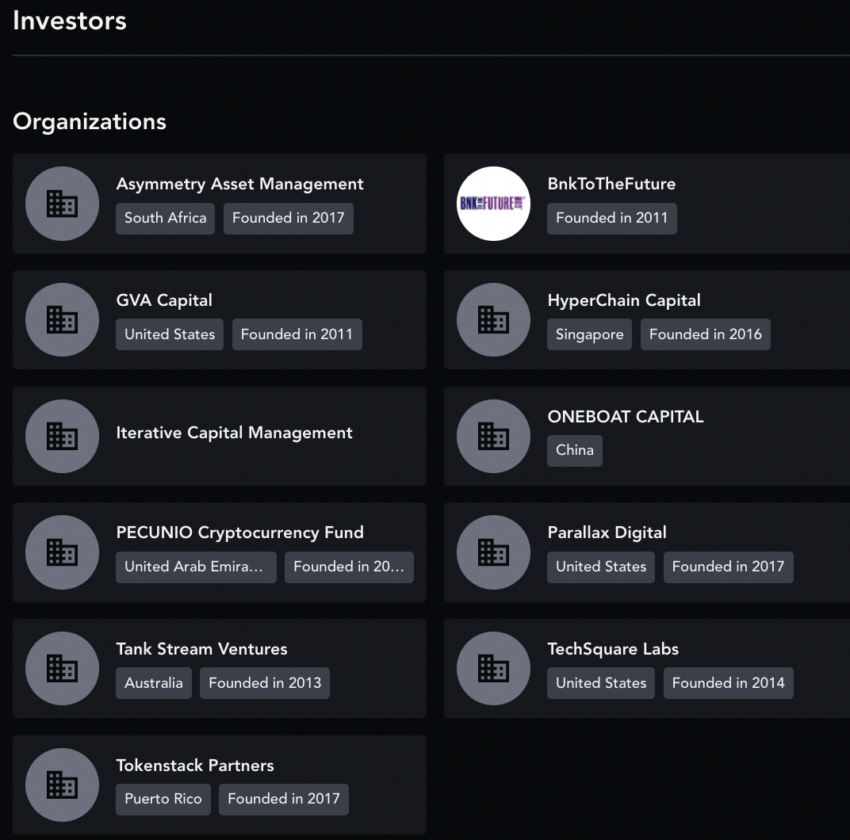
- A celebrated lineup of investors backs Storj.
The smart contract-focused technology makes Storj a project worth considering. The concept is simple: using computer storage in return for payment. The simple use case can drive adoption going forward.
Storj token economics and price forecast
The inaugural mint saw 500 million STORJ on the Ethereum blockchain. Initially, 85.59% of the tokens moved to the projects and founders following the crowd sale. Only 14.41% went to retail investors.
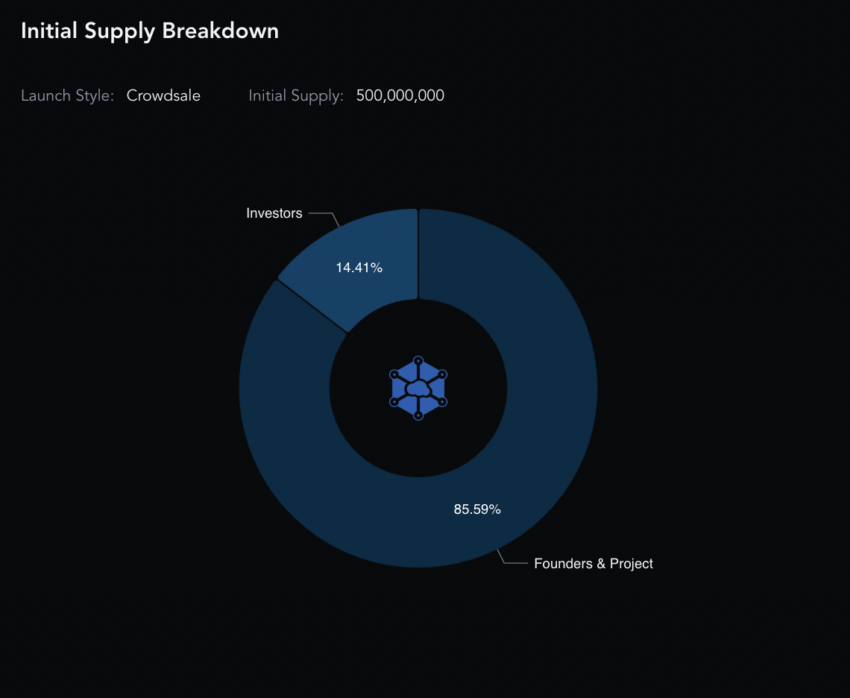
72 million STORJ tokens went to retail investors, helping Storj raise $30 million. Also, Storj burned 75 million tokens, putting the total supply at 425 million. In 2022, 415 million STORJ tokens were already in circulation. However, the number seems to have dropped to $408 million in 2024, showing that deflationary forces are in play.
As per the supply breakdown, the maximum supply can reach by 2027 (or earlier), after which STORJ might become deflationary. Also, over 57% is expected to be in Storj’s reserves, which might not go down well with decentralization advocates.
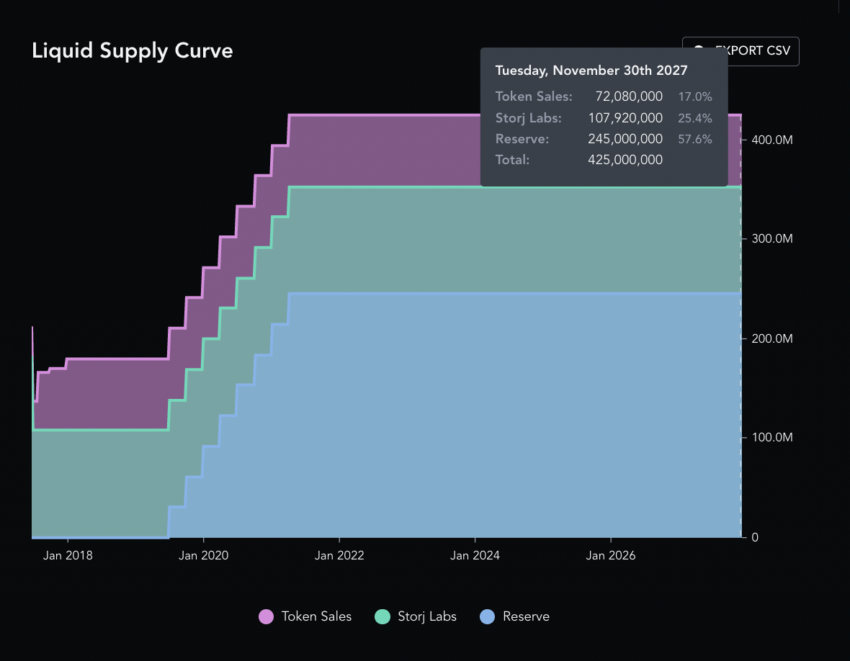
Overall, the token supply gives mixed signals.
Should you invest in STORJ? A look at on-chain metrics
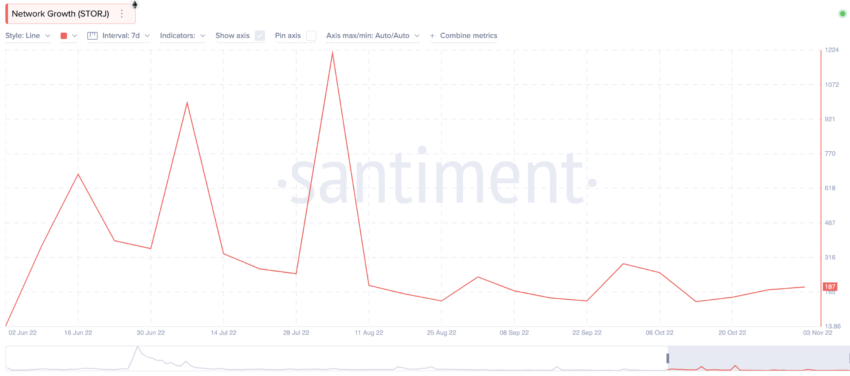
Network growth has dropped from August 2022 till December 2022, which wasn’t promising from an ecosystem perspective. However, the network activity grew in 2023, making STORJ cross the $1 mark.
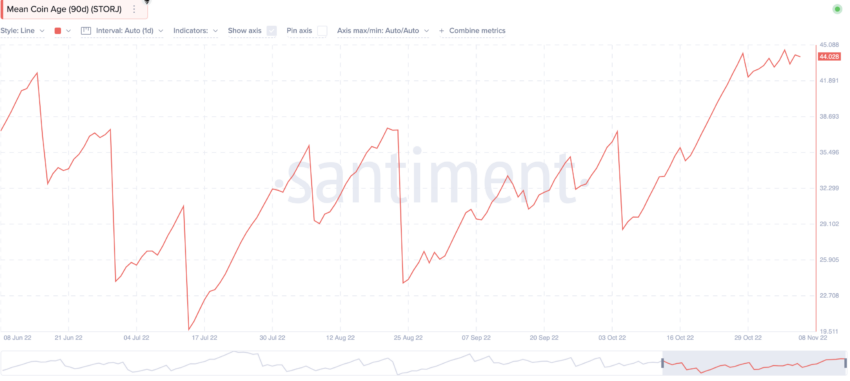
The yearly mean coin age was on the way up in 2022, showing that STORJ holders weren’t simply selling in this bear market. Hence, the outlook is positive. This metric came out to be right as the prices increased.
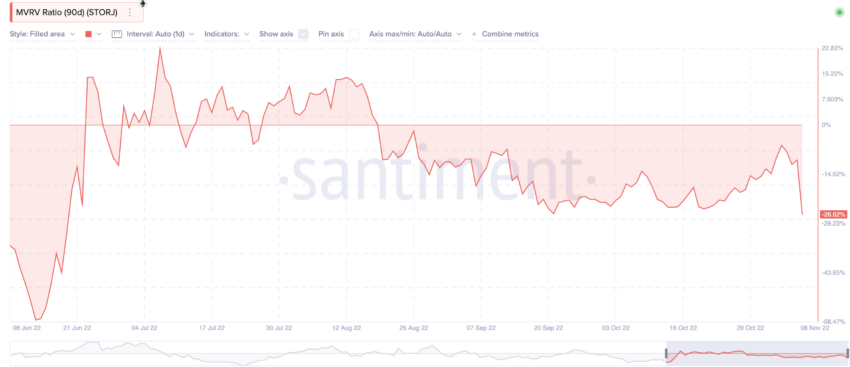
From an investor perspective, here is the 90-day MVRV (Market Value to Realized Value) ratio. As of November 2022, the MVRV ratio is negative, signifying that STORJ is undervalued. People are willing to hold and not sell, a positive sign in the short term.
Last but not least, the daily active address count has started to look up, hinting at STORJ accumulation.
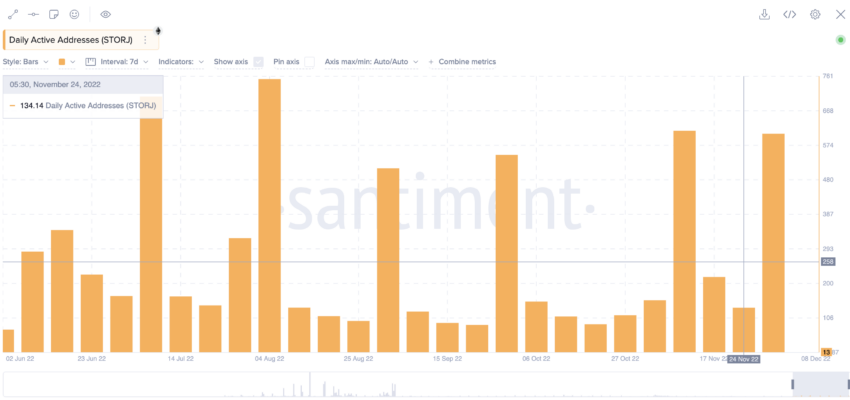
Apart from the network growth metric, STORJ looks good in the short to mid-term. Especially with it being undervalued and tokens being accumulated.
STORJ was volatile: market cap and trading volume suggest
STORJ had the highest market cap on Nov. 29, 2021, when it reached $983.31 million, with a daily trading volume of $488.71 million.
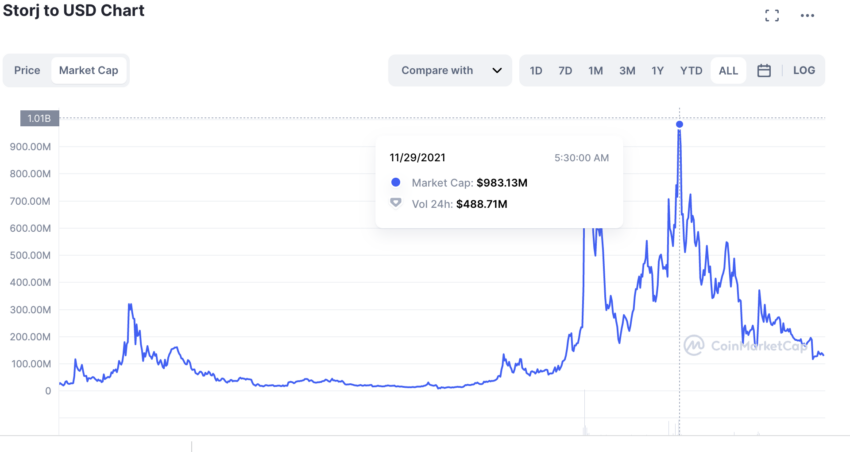
Now, let us take the ratio of the trading volume to market cap at the peak. It is also termed the turnover ratio. The higher it is, the more liquid and less volatile the asset.
It comes out to be 0.497.
Now, let’s take the turnover from 2022. With a market cap of $129.16 million and a volume of $8.05 million, the ratio reached 0.062.
The ratio was very low, which indicates that immediate volatility was very high. However, this helped the prices go up due to soaring trading volumes.
STORJ price forecast based on performance analysis
STORJ is a part of the bigger web3 infrastructure sector. The focus is on building, storing, and distributing data in a decentralized manner.
Despite the web3 infrastructure sector dropping 67% of its Q2, 2022 revenue in Q3, 2022, Storj managed a 175% growth QoQ.

Coming to the growth of the storage-as-as-service sector, Storj has 18% of the market share as of 2022, behind only Filecoin.
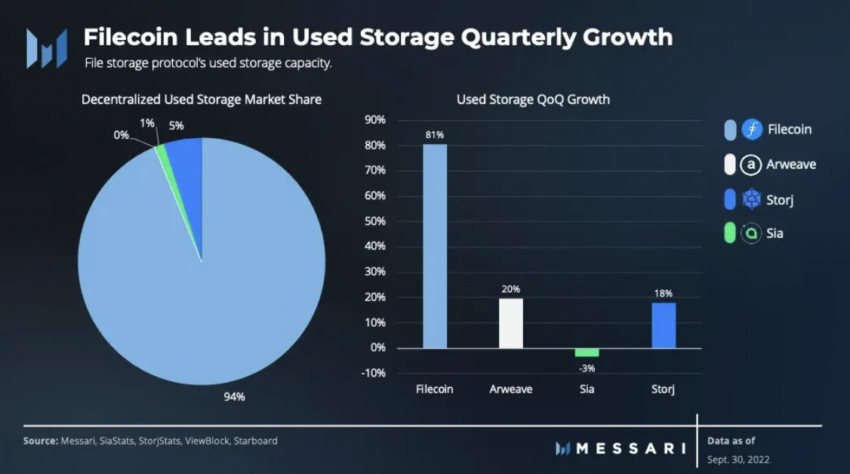
More money is coming into the Storj ecosystem courtesy of a robust and simplistic offering. If Q4 remains as strong, we can see a positive impact on prices.
Storj social activity and price forecast
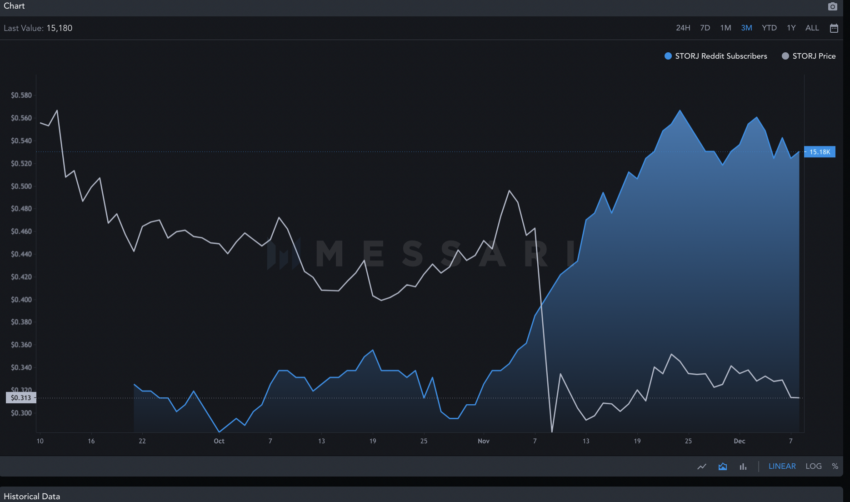
Storj has seen a surge in the number of Reddit subscribers in Q4 2022. This is despite a cataclysmic price drop in early November.
Also, social mentions peaked on Nov. 22, 2022, when STORJ saw some positive price action. Its social mentions are up 33%, QoQ.
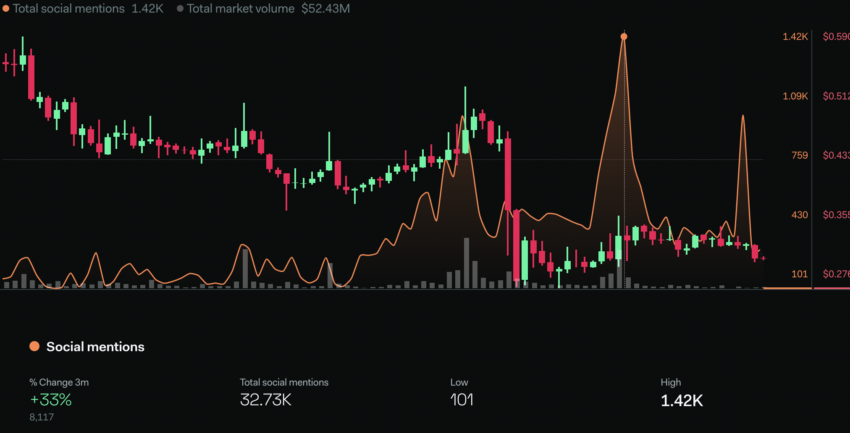
High network activity will add to the social presence. Every time the social activity shoots up, Storj shows a price move and a volume surge. Hence, long-term price action relevant to the token remains dependent on social activity.
STORJ price prediction using technical analysis
Now, before we move deep into the technical analysis of the STORJ coin, let us jot down the things we know:
- The highest price of STORJ is $3.91, which it reached on March 28, 2021.
- The lowest price of STORJ is $0.04835, which it attained on March 13, 2020.
- STORJ enjoys a global rank of 156 as of Dec. 8, 2022.
Here is the daily price chart of STORJ, as of December 2022, with a clear pattern (the theory our price prediction is based on)
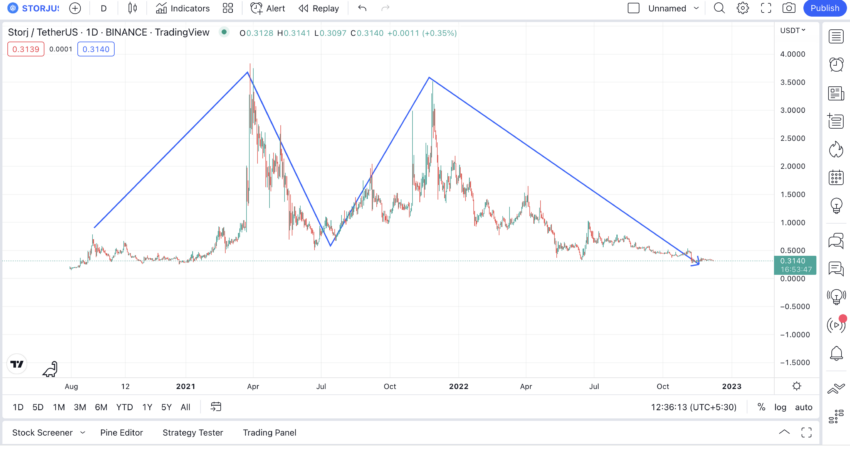
STORJ slowly peaks drops to a significant low, and again peaks to a lower high. Eventually, it then moves to a lower low.
So, the broader lower high and lower low pattern looks clear, indicating a downtrend. Let’s assume STORJ has already reached its low for this cycle, at $0.2743. Courtesy of a rounded bottom formation, we can now start plotting points for the next high and the next low.
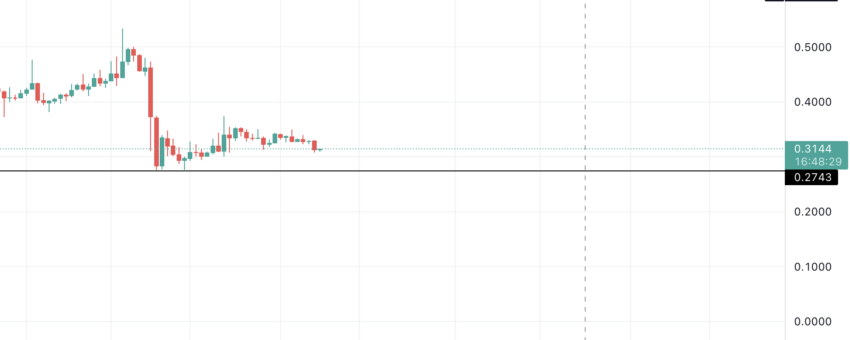
Price changes from lows to highs
Outlook: Bullish
Now, we will determine the price change from the first low to the first high and the second low to the second high. With this, we can see where the third high could show up.
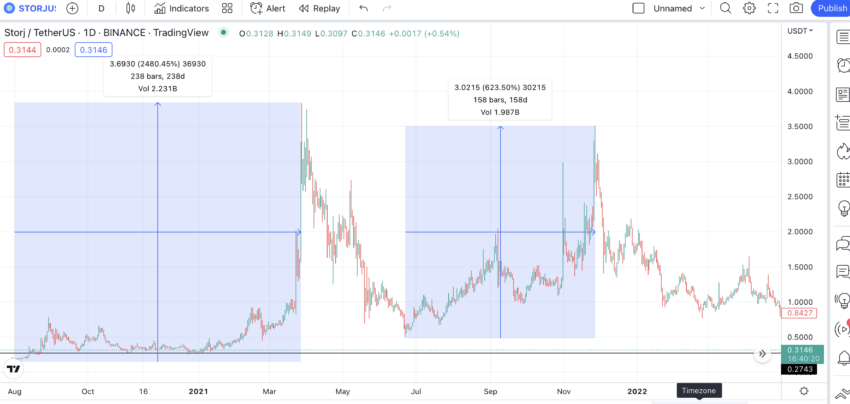
First low to first high = 238 days and 2480.45% growth
Second low to second high = 158 days and 623.50%
So the distance and growth percentage from the third low to the third high should also be reduced similarly.
Distance drops 34% for the next swing, and percentage growth drops 75% for the next swing.
The next high should be at 104 days from the last low of $0.2743 and at a high of 155.87%.
Storj (STORJ) price prediction 2023
STORJ exceeded out price prediction expectations for 2023, reaching close to $1. Here is how we predicted things:
Now, if we plot the points mentioned above from Nov. 14, 2022, we get the following extrapolation.
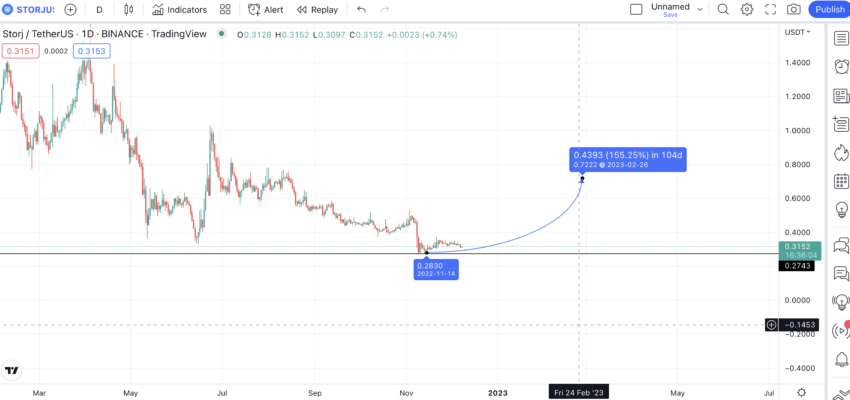
The next high for STORJ should be at $0.7222 on Feb. 26, 2023.
But we still have to find the next low. We will revisit the pattern and note the distance between the first high and second low and the second high and third low. This will help us find the fourth low as per the pattern.
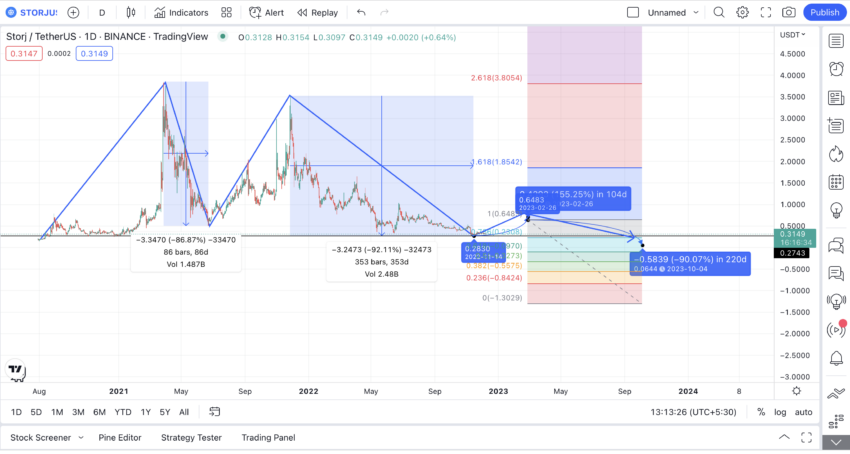
First high to second low = 86 days and -86.87% drop
Second high to third low = 353 days and -92.11% drop
Now one pointer (price drop) remains relatively similar; we can calculate a ratio but take an average of these entities.
So the time taken for the next low is 220 days.
And the percentage drop is 89.49%.
Hence, the estimated drop (as per the lower-high and lower-low) pattern is $0.0644 by Oct. 4, 2023. But there is a catch!
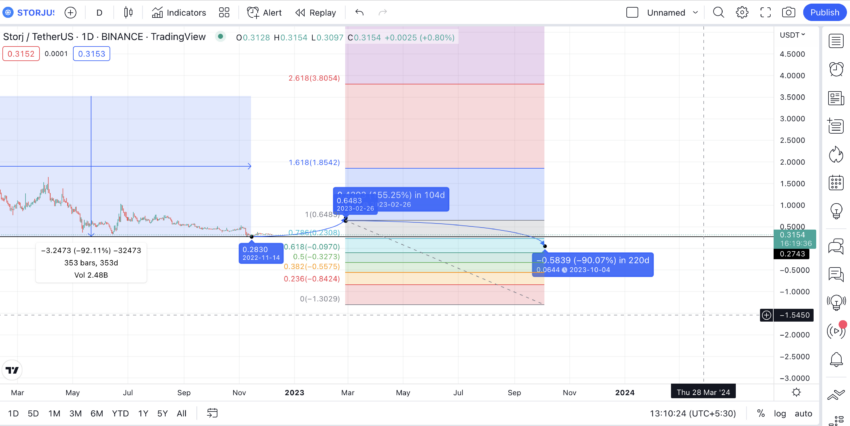
If the bear market gives way, the next possible low could be at $0.2308, as per Fibonacci retracement levels. Therefore, STORJ might not break out of the lower low, lower high pattern in 2023. The pattern continues.
In the short-term, STORJ forms a descending triangle pattern. This is bearish and might lead to some immediate near-term corrections. Hence, we have given realistic STORJ price prediction targets for 2023.

Storj (STORJ) price prediction 2024
Outlook: Bullish
If STORJ follows the same path, it should reach $0.974 in 2024, breaching the 78.6% on the Fib indicator. This is considering there would be some correction, and it would take time to reach $1 again. The timeline could now be the average of the days taken: between the first low and the first high and the second low to the second high. This collectively comes out to be 198 days.
Project ROI from the current level: 34%
Storj (STORJ) price prediction 2025
Outlook: Bullish
For mid-term STORJ price prediction, we go to the weekly chart. Here, we can plot the high and low of the next circle to check for patterns.
Let’s assume we will come out of the bear market by 2025. So, we can superimpose a Fib indicator on top of the last low to help identify price levels until then.
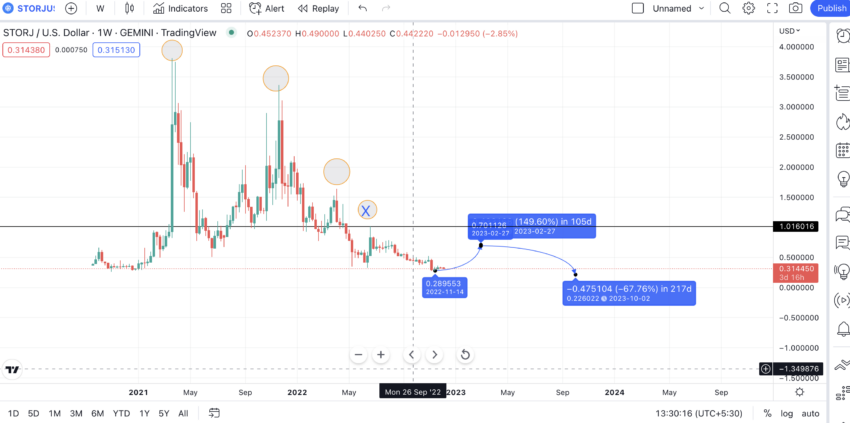
The weekly pattern is also a lower-high pattern. To break above the same, STORJ would need first to break the $1.016 mark and the second last high. An X marks it on the chart.
If we go by this pace and extrapolation intensity, STORJ might reach $1.873 by early 2025.
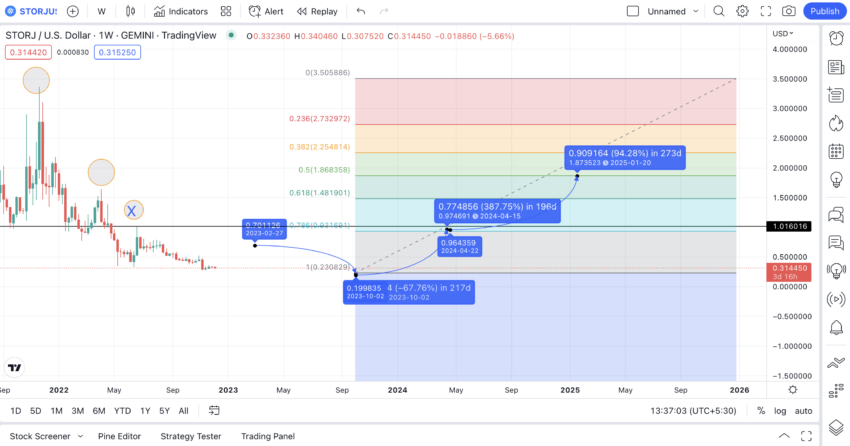
Once STORJ breaches the $1.87 mark, it might break the overall pattern and shoot through rather aggressively.
Project ROI from the current level: 157%
Storj (STORJ) price prediction 2030
Outlook: Very Bullish
For the long-term STORJ price prediction, we need to extrapolate further. If we follow the path and check for the STORJ price prediction 2026 result, we can expect a price point of $1.91 as the high. For the STORJ price prediction for 2028, the high might be $2.28, which also coincides with the 78.6% level on the Fib indicator.
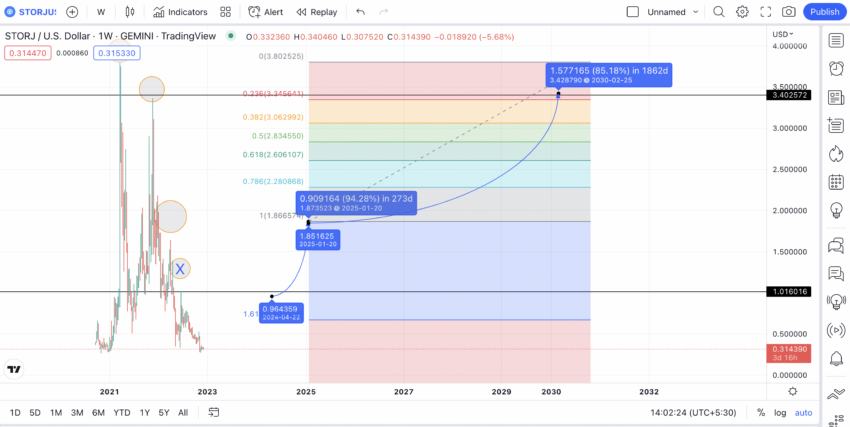
STORJ’s price prediction for 2030 puts its value at almost $3.40, which is still away from its all-time high price.
Project ROI from the current level: 368%
Storj (STORJ’s) long-term price prediction until 2035
You can easily convert your LTC to USD
We have clarity regarding STORJ prices by 2030. Now we can look at the likely percentage changes each year and plot the price forecast until 2035. Here is what this looks like:
| Year | | Maximum price of STORJ | | Minimum price of STORJ |
| 2024 | $0.974 | $0.6280 |
| 2025 | $1.873 | $1.373 |
| 2026 | $1.91 | $1.55 |
| 2027 | $2.06 | $1.60 |
| 2028 | $2.28 | $1.75 |
| 2029 | $2.78 | $2.19 |
| 2030 | $3.42 | $2.25 |
| 2031 | $3.93 | $3.088 |
| 2032 | $4.71 | $3.33 |
| 2033 | $5.90 | $3.64 |
| 2034 | $7.375 | $5.79 |
| 2035 | $8.11 | $6.32 |
STORJ price prediction models might not move linearly due to constantly changing ecosystem growth. Also, the average price of STORJ for any year should move between the lows and highs for the same year. However, considering the space’s volatility, the standard “divided by 2” average price determination is incorrect.
How accurate is the STORJ price prediction?
This STORJ price prediction piece aims to come as close as possible to actual price action, using prudent projections and mindful extrapolations. With the network growth and the short-term price chart giving out bearish vibes, we haven’t claimed that STORJ can rapidly reach an all-time high.
Instead, we have considered multiple aspects of the Storj ecosystem for painting a long-term picture. We shall update as and when new details concerning Storj and its native STORJ coin emerge.
Frequently asked questions
Is STORJ a good investment?
What will STORJ be worth in 2030?
Can STORJ reach 1000?
Will STORJ rise again?
What will STORJ go to 2025?
Disclaimer
In line with the Trust Project guidelines, the educational content on this website is offered in good faith and for general information purposes only. BeInCrypto prioritizes providing high-quality information, taking the time to research and create informative content for readers. While partners may reward the company with commissions for placements in articles, these commissions do not influence the unbiased, honest, and helpful content creation process. Any action taken by the reader based on this information is strictly at their own risk. Please note that our Terms and Conditions, Privacy Policy, and Disclaimers have been updated.


