

Imagine you’re eying up a private equity fund. But buying in is too expensive, as there’s no fractionalized exposure on offer. The protagonist of this Polymath price prediction piece aims to solve that. Polymath — the decentralized solution to creating security tokens — can help build new-world financial products. It is one of the few blockchains to birth another institution-centric chain, the Polymesh. Thus, it helps blur the lines between the real world and blockchain technology.
Polymath’s native token, POLY, powers token creation, issuance, and more. Overall, POLY is the currency users need to interact with Polymath. While Polymath is currently in the Ethereum ecosystem, a mainnet will soon surface beside the existing permissioned Polymesh mainnet. We will consider the Polymesh mainnet rollout in this discussion, which began in October 2021 amid POLY price surges.
- Polymath price prediction and fundamental analysis
- Polymath (POLY) tokenomics and price prediction
- Polymath price forecast using market cap and trading volume
- POLY price prediction using on-chain metrics
- Polymath network price prediction using social growth
- Polymath price prediction using technical analysis
- Polymath (POLY) price prediction 2024
- Polymath (POLY) price prediction 2025
- Polymath (POLY) price prediction 2030
- Polymath (POLY’s) long-term price prediction until 2035
- How accurate is the Polymath price prediction?
- Frequently asked questions
Polymath price prediction and fundamental analysis
Simply put, the Polymath network is innovative and useful. It specializes in creating security tokens, while the blockchain opens doors for traditional fintech services. The aim is to allow fintechs to explore decentralization while keeping abiding by regulation.
Did you know? Polymath adheres to the ERC-1400 token standard. This offers ubiquitous guidelines for security tokens, like gatekeeping access, issuance control, and differentiated ownership. If more financial institutions plan to fractionalize their assets via security tokens, Polymath will grow.
It’s also wise to consider the growth of other platforms, such as Bitbond and Tokeny Solutions, which support asset tokenization. Their growth can help better trace the Polymath price prediction figures in the long term.
Here are some key insights about Polymath:
- It is an all-in-one platform to help you digitize world assets.
- Polymath products are open source.
- It offers end-to-end offerings for building.
- It is also termed the Ethereum of security tokens.
The possibilities involving the confluence of real and digital are endless, especially when it comes to finances. We expect Polymath to play a major role in that.
Polymath (POLY) tokenomics and price prediction
Before we delve into tokenomics, let’s first consider how we can use the POLY tokens. Any work done in the Polymath ecosystem, like issuing smart contracts and eventually issuing or managing tokens, can be paid for using POLY.
The total supply currently stands at 1 billion. Here is a breakdown of how they are distributed:
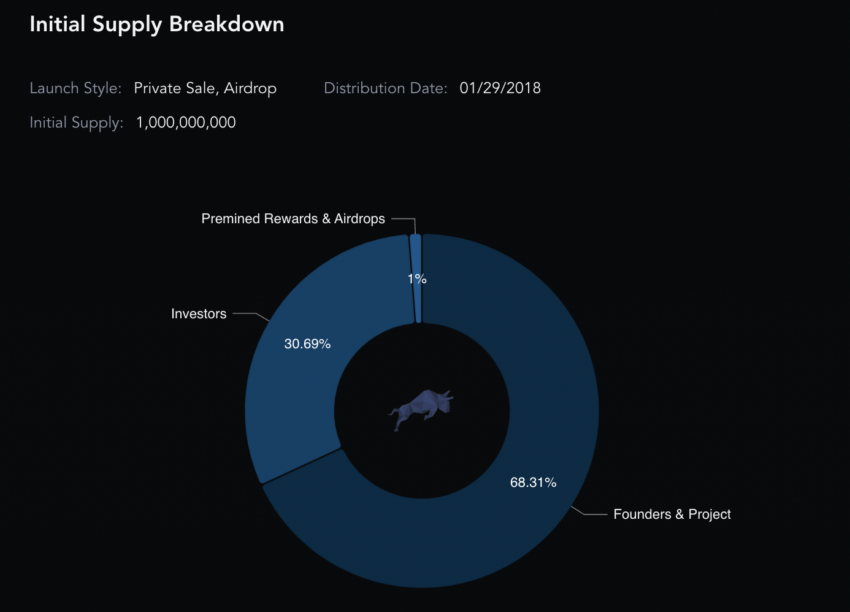
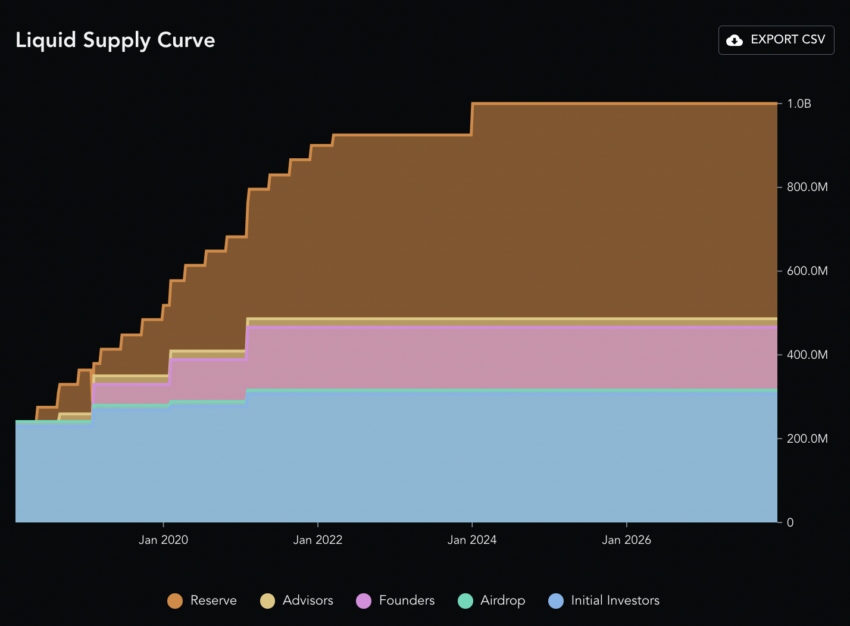
Do note that a large chunk is with the project founders, which can be disconcerting. If we now look at the liquid curve, most of the tokens belong to the reserve and are set aside for development.
Also, close to 93% of the capped supply is already in circulation. Therefore, if the Polymath network adoption increases, the movement of POLY might attract price surges. We expect scarcity to kick in once the circulating supply reaches 100%.
Polymath price forecast using market cap and trading volume
Let’s compare the market cap and trading volume of Polymath during the market capitalization peak with what it is today. This will help us compare the volatility at different points of the token’s journey. With this information, it becomes easier to plot POLY price prediction levels.
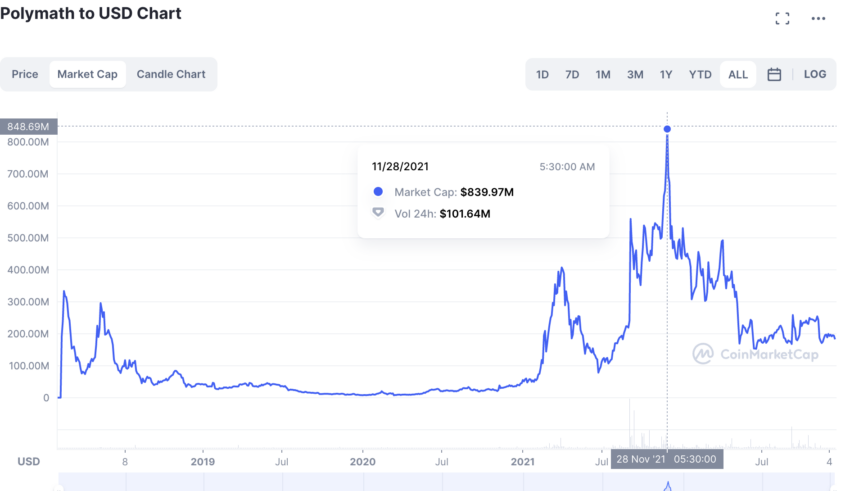
At the peak:
On Nov. 28, 2021, when the price of Polymath was still high, the market cap went up to $839.97 million. The trading volume at that time was $101.64 million. This puts the turn-over ratio (volume/ market cap) at 0.12.
At 2022 levels:
As of Dec. 16, 2022, Polymath’s market cap is $182.31 million. The trading volume is at $1.87 million.
Therefore, as of Dec. 16, 2022, the turnover ratio is 0.010.
Hence, Polymath was much more volatile in December 2022 compared to Nov. 28, 2022. Also, on-chain metrics suggest that the volatility levels are lower than the September 2022 levels.
In case the signals are bearish, a dip can be expected, which happened for POLY going into 2023.
POLY price prediction using on-chain metrics
On-chain development metrics can impact the price of POLY tokens. Here are a few metrics currently grabbing attention:
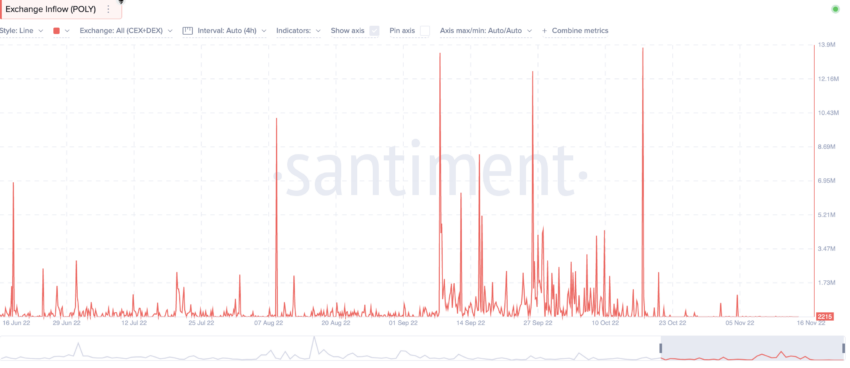
Even though selling pressure increased in October 2022, November 2022 saw a drop in POLY tokens being pushed into exchanges. If the trend persists, it can work in favor of the long-term Polymath future price prediction.
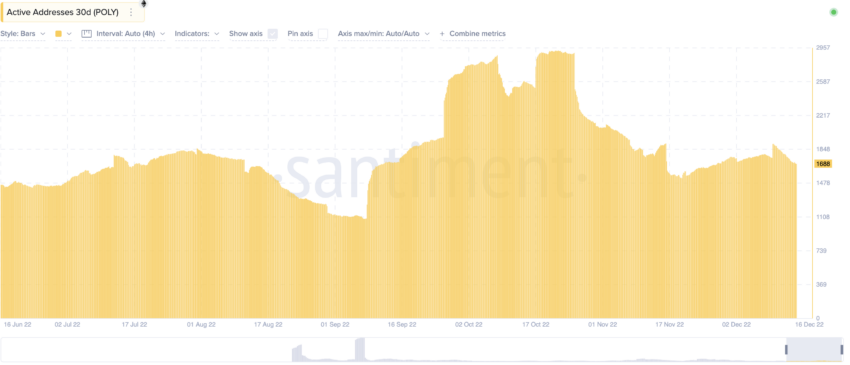
The graph above shows a surge in active addresses holding Polymath from August 2022 onwards. Even though we noticed a drop in December 2022, the average active growth has been steady.
The on-chain metrics hint at a possible strength at Polymath’s counter. Also, with the Polymesh mainnet (for institutional usage) growing in popularity, we might see an increase in development activity. This could lead to a more optimistic Polymath network price prediction, especially if the bull market comes to the fore in 2024.
Polymath network price prediction using social growth
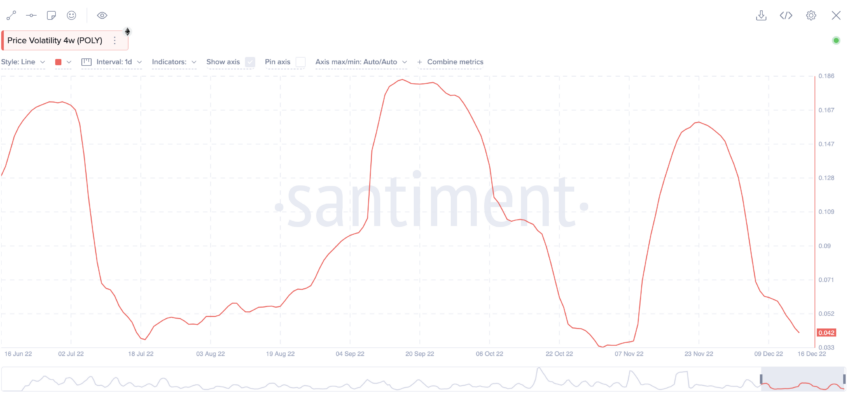
Polymath’s social growth hasn’t been overly impressive. However, this chart from Santiment in 2022 — an on-chain analytics platform — suggests POLY tokens experienced a price surge in mid-September 2022. This coincides with the peaking social volume and an increase in Twitter followers.
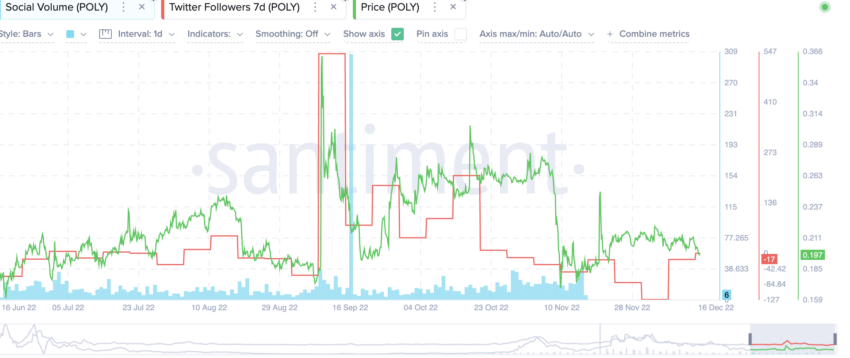
The Polymath network price prediction is directly related to the growing social activity.
Polymath price prediction using technical analysis
Before we move ahead with the price chart and technical analysis, here’s what you should know about the POLY price:
- The highest price of POLY is $1.66.
- The price of Polymath reached an all-time high in February 2018.
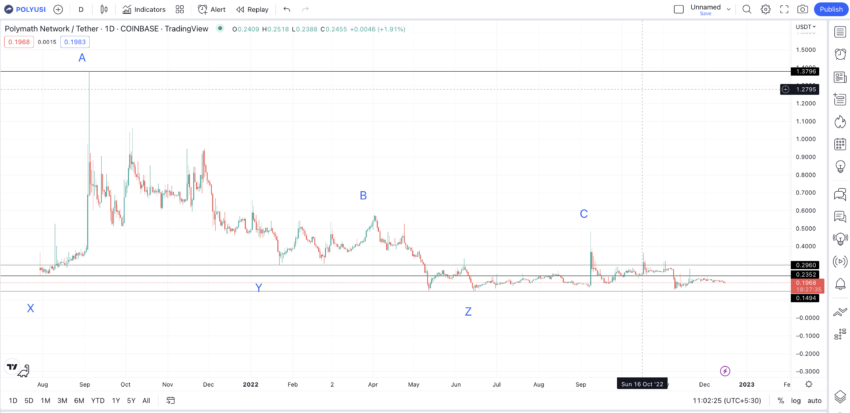
- As per our Coinbase chart, the highest price of POLY is $1.379, which it reached on Sept. 4, 2021.
- The lowest price of Polymath, per the chart, is $0.1494, which also acts as a strong support line.
- Here is the daily chart with all the key levels marked.
Weekly: All the highs and lows
Outlook: Bullish
We will first use the weekly chart to locate the trend. Once done, we will use the high-to-high and low-to-high points to chart a price prediction path for Polymath.
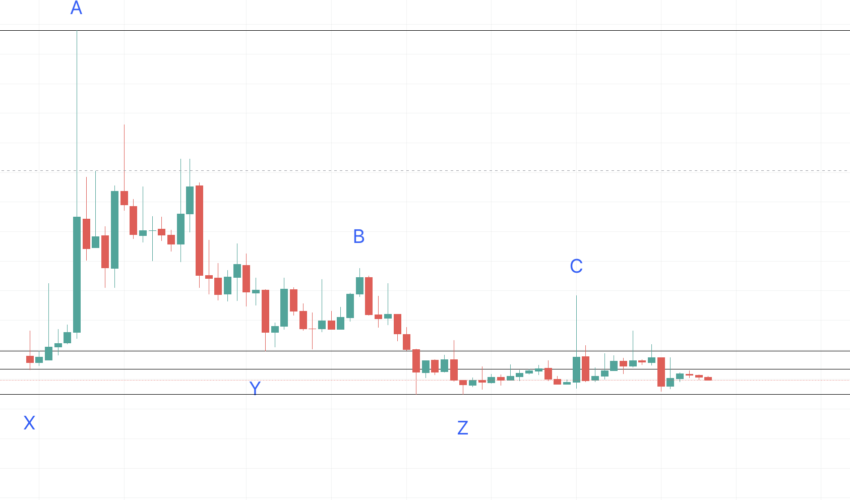
As of the time of writing, the weekly chart signals a continuing downtrend for Polymath since the September 2021 highs. We mark the highs as A, B, and C.
Also, from A to B and B to C, we encounter lows. We mark the first low before the peak as X and the remaining two low levels as Y and Z.
Our first task is to locate the next high after C, which we can mark D. It would be interesting to see if D closes above C, breaking the downtrend, or if it makes another lower high.
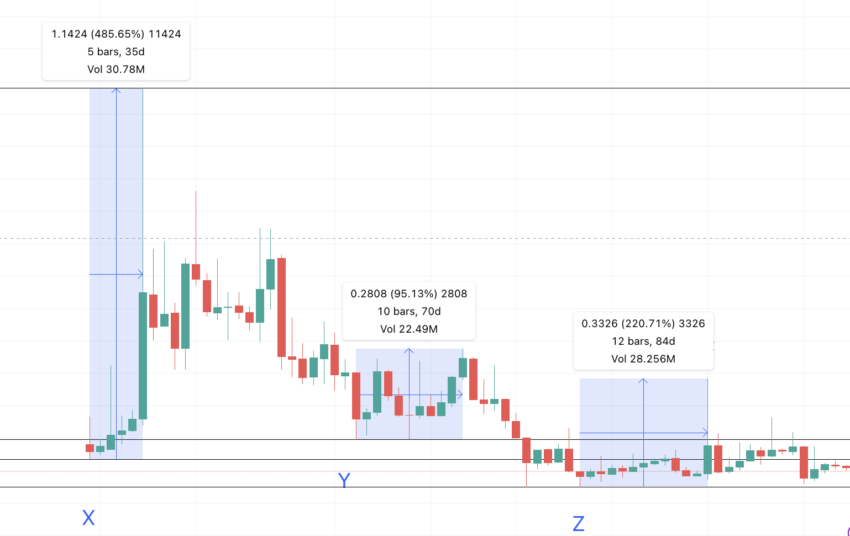
We can chart low to high levels with the following data: (data set 1)
X to A = 35 days and a 485.65% growth; Y to B = 70 days and 95.13% growth; Z to C = 84 days, and 220.71% growth
Calculations
If we take an average of these low to high levels, we get the next point in 63 days. This is at a 267.16% higher level than the next low, which we can mark as O.
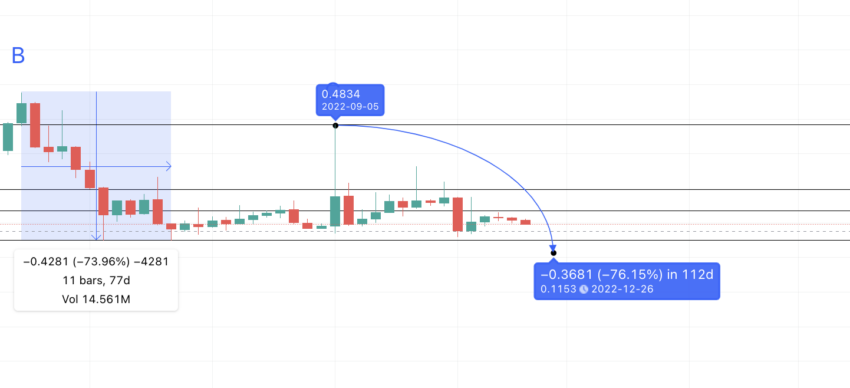
But how do we locate the next low? For that, we must plot A to Y and B to Z (forming data set 2)
A to Y = 140 days and a 78.42% drop; B to Z = 77 days and a 73.96% drop
So if C is the reference point, the next low O could be in 108.5 days and down by 76.19%.
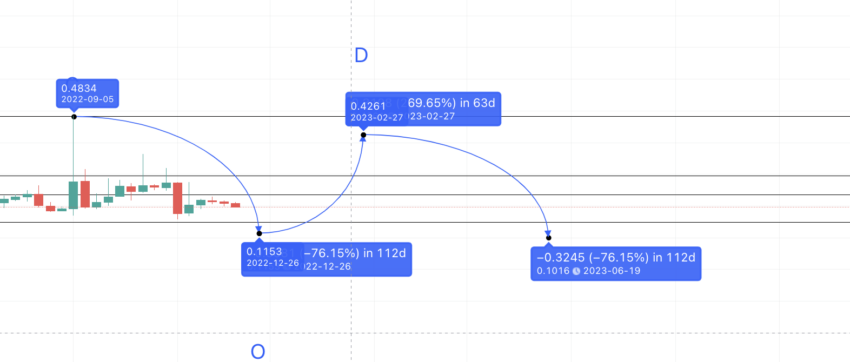
Here is where the O could lie:
Per the chart, POLY tokens can correct further by the year-end. The lowest level could be $0.1153.
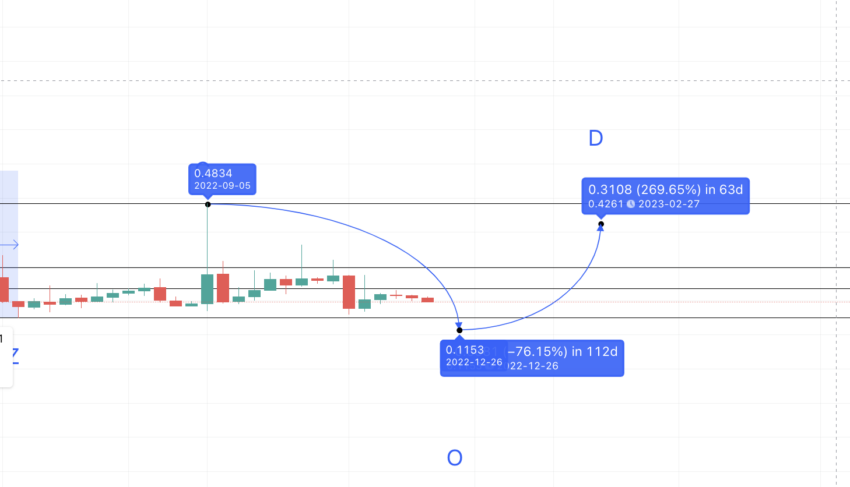
As per our previous calculation, O to the next high could be in 63 days and at 267.16%, a higher level than O. Chart plotting suggests that the price of Polymath can go as high as $0.4261 by the end of February. We can mark this point as D.
Polymath (POLY) price prediction 2024
Outlook: Bullish
We expected the price levels to reach as high as $0.4261 in 2023. However, the bull market didn’t materialize in 2023, and we expect the price levels to hold in 2024.
As mentioned above, the high could be at $0.4261. Using the previous high to calculations per Table 2, the next low could be around $0.1016.
The new 2024 low is supposed to be lower than the 2022 low of $0.1153. This would mean Polymath continues its downtrend. To see if this will continue or not, we must move to the daily chart.
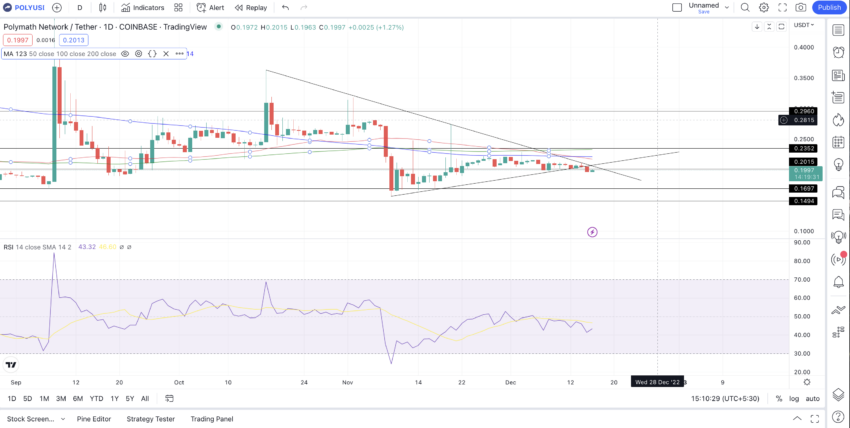
Here are some things to note. The 2024 low can settle at $0.149, coinciding with a strong support level.
In 2024, the $0.2015 can act as strong support, followed by $0.1697. The $0.1697 is a very strong support level with multiple touchpoints. If the Polymath network keeps doing well and the Polymesh mainnet grows, we can expect the low to settle at $0.1697 in 2024. That would defeat the lower-low trend.
Projected ROI from the current level: 136%
Short-term growth potential to evaluate 2023 levels and our theory
While the future looks good for Polymath, the short-term Polymath network price prediction paints an underwhelming picture. The daily chart suggests POLY is breaking out (in the downward direction) of the triangle or, rather, a pennant pattern. And its 20-day moving average line has crossed under the 200-day moving average line.
This “Death Crossover” pattern can result in a quick price dip in the short term. This aligns with our view of the 2022 low level of $0.1153 for the POLY tokens.
Polymath (POLY) price prediction 2025
Outlook: Bullish
Now we have established a trend reversal using the daily chart, we can move to the weekly chart.
As per the low to high average, we might expect POLY to increase by 267.16% within 63 days.
However, with competitors emerging and the market not as robust as in 2021, we can expect it to take some more time. For that, we can create another data set (data set 3) to find the distance between the highs.
A to B = 210 days; B to C = 161 days; C to D = 175 days
The average time between highs is 182 days. So, from the low after D, the next high could take 120 days and a 267.16% uptick. While the prediction for the next high is $0.6255, we can expect this in early 2024 or early 2025, depending on market conditions.
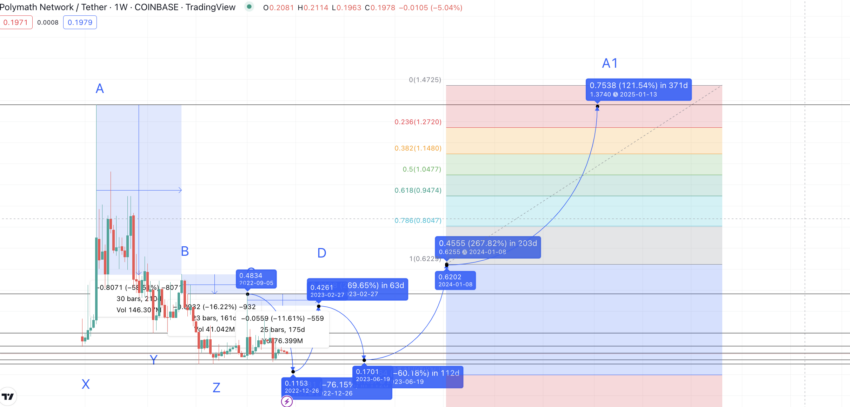
Hence, the POLY price prediction for 2024 places the prices of POLY tokens at $0.6255. The low could be at strong support of $0.2960.
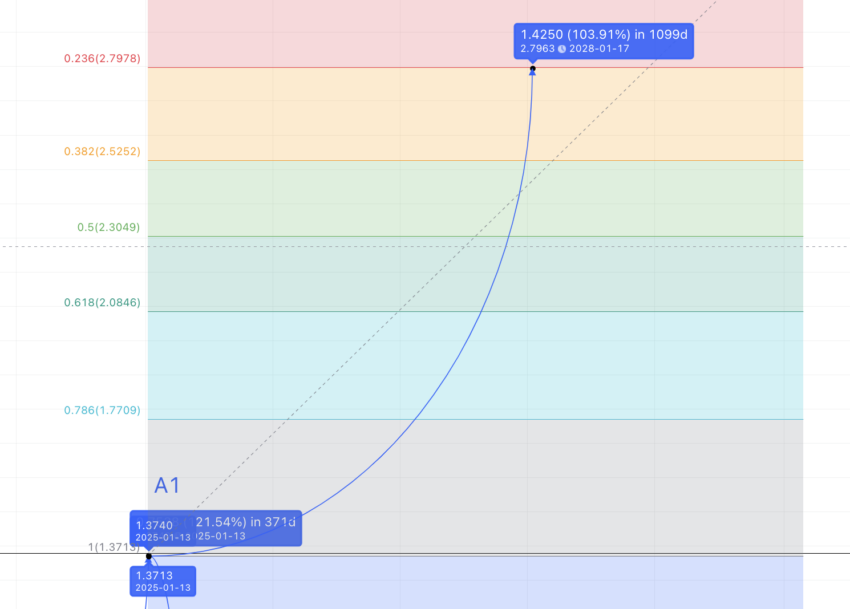
By 2024, POLY might go as high as $0.6255, breaking above B, the second-highest swing point as per the weekly chart. From here, we can expect the Polymath network price prediction results to improve. If we add a Fibonacci indicator to the 2024 high and trace the same path, expect POLY to reach $1.37 by early 2025.
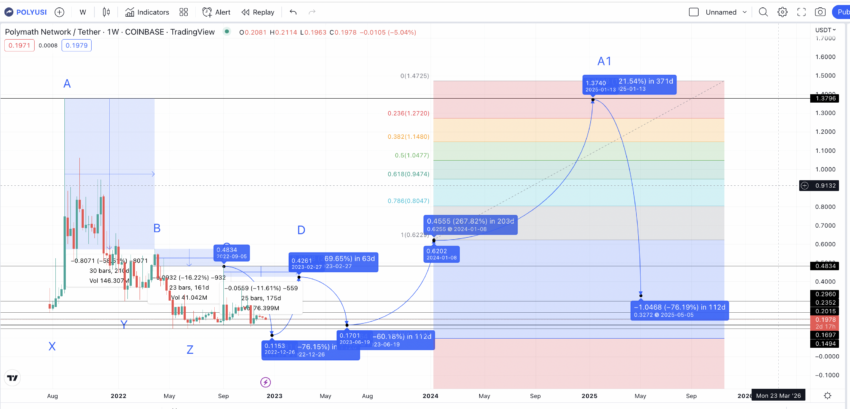
This coincides with the September 2021 high. We can mark this level A1. The low in 2025 could be at $0.622, as per the Fib indicator. Also, it would be higher than the POLY high of 2024, making the uptrend even more obvious.
Projected ROI from the current level: 661%
Polymath (POLY) price prediction 2030
Data set 2 shows the average low to high time, and the percentage drop is 108.5 days, down by 76.19%. Hence, after A1, the next low could settle at $0.3272, which is still higher than the previous cycle’s low. Do note that the nearest Fib retracement could be $0.622. So, if Poly tokens correct a lot, the low in 2025 would settle at $0.3272. Or else, it can surface at $0.622.
Hence, the path till 2030 would be up-trending, per the Polymath price forecast.
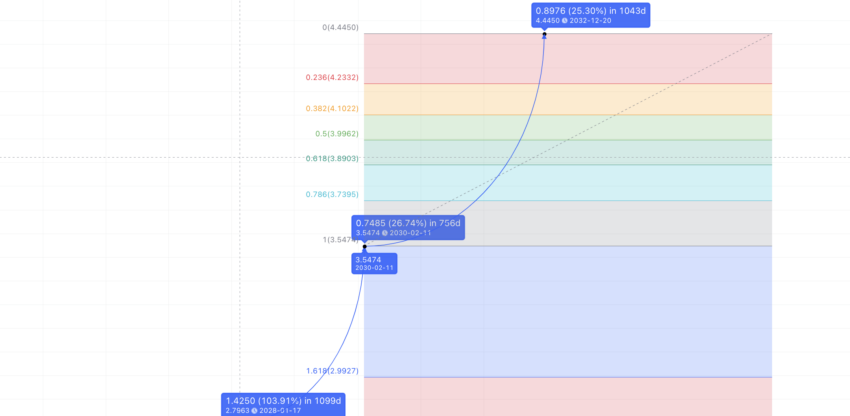
To chart the next path, we apply the Fib levels on A1. If we extend the path as per the previous trajectory, we can expect the price of Polymath to settle at $2.79 by 2028.
Here is the projected path:
Do note that there might be drops along the way. However, for the long-term Polymath crypto price prediction, we chose to take linear ecosystem growth into account. Therefore, the average price of POLY tokens might vary from the standard Polymath price forecast. This may be due to sentimental drivers and/or the potential of a blockchain technology adoption craze.
If the price of POLY reaches $2.79 by 2028, the same Fib levels can push the prices to $3.78 by early 2030. This is that the same growth trajectory is maintained.
Projected ROI from the current level: 2000%
Polymath (POLY’s) long-term price prediction until 2035
The Fib levels suggest that the Polymath future price prediction levels are traced linearly. Therefore, if we reach $3.78 by 2030, we can extrapolate the same path and head toward 2035.
Here is a table with all the key levels in play:
| Year | | Maximum price of POLY | | Minimum price of POLY |
| 2024 | $0.4261 | $0.1697 |
| 2025 | $1.37 | $0.622 |
| 2026 | $1.71 | $1.06 |
| 2027 | $2.22 | $1.11 |
| 2028 | $2.79 | $1.73 |
| 2029 | $3.20 | $1.99 |
| 2030 | $3.78 | $2.34 |
| 2031 | $4.53 | $2.80 |
| 2032 | $5.66 | $3.51 |
| 2033 | $7.35 | $5.29 |
| 2034 | $9.56 | $5.92 |
| 2035 | $11.95 | $7.40 |
Projecting up to 2040 isn’t wise until Polymath crosses above some key levels like that in 2025 and 2030. The average price of POLY each year can fall anywhere between the projected high and low for the same.
How accurate is the Polymath price prediction?
The accuracy of this Polymath price prediction depends on the adoption of blockchain technology. If more companies with real-world financial products start exploring blockchain and tokenization, Polymath may have a good future. Other factors like the growth of the Polymesh mainnet, the popularity of security tokens, and short-term technical analysis results might also have a role to play.
Of course, the crypto markets are known for their volatility, and we cannot predict every eventuality. But overall, the Polymath price prediction looks practical. We expect the price of POLY to abide by each yearly level, provided the ecosystem keeps growing linearly.
Frequently asked questions
What will Polymath be worth in 2030?
Is Polymath coin a good investment?
What will Polymath be worth in 2025?
Does Polymath succeed?
Who is behind Polymath?
Is Polymath a limited supply?
Disclaimer
In line with the Trust Project guidelines, the educational content on this website is offered in good faith and for general information purposes only. BeInCrypto prioritizes providing high-quality information, taking the time to research and create informative content for readers. While partners may reward the company with commissions for placements in articles, these commissions do not influence the unbiased, honest, and helpful content creation process. Any action taken by the reader based on this information is strictly at their own risk. Please note that our Terms and Conditions, Privacy Policy, and Disclaimers have been updated.


