

Understanding blockchains isn’t always easy. New use cases emerge constantly, and complex jargon is often part and parcel of innovation. Yet, Neo keeps things simple. The project is the torchbearer of a smart economy — a realm where digital assets and identities can exist without issues. As expected, Neo is driven by smart contracts, with NeoX as its protocol. The altchain’s native token — NEO — takes center stage today — as we build an accurate and realistic NEO price prediction model for you. If you plan to invest in the NEO token, this NEO price prediction model is the resource you need.
- NEO price prediction and the role of fundamental analysis
- NEO price prediction and the tokenomics
- Additional Neo metrics and the possible impact of future price (2022-23 insights)
- NEO price prediction using technical analysis
- Neo (NEO) price prediction 2023
- Neo (NEO) price prediction 2024
- Neo (NEO) price prediction 2025
- Neo (NEO) price prediction 2030
- Neo (NEO’s) long-term price prediction until the year 2035
- Is the NEO price prediction accurate?
- Frequently asked questions
NEO price prediction and the role of fundamental analysis
For starters, NEO focuses heavily on the smart contract approach and even has an Ethereum-like Virtual Machine — NeoVM — for the developers. The ecosystem welcomes developers by ensuring the Virtual Machine supports the likes of Java, GO, Ruby, Python, and more.
So, if a computer is running the NeoVM, it can participate in governance or contribute towards the development of the ecosystem. There’s a tick in the decentralized box!
Besides allowing smart contract development in the language of choice, NEO also comes with a full suite of services — geared toward the smart economy. These include:
- Oracles
- Delegated BFT (Byzantine Fault Tolerance) consensus for faster transaction finality.
- Cross-chain compatibility with services spanning across the Binance Chain, Ethereum, and more.
- NNS (NEO Name Service) for furthering the vision of digital identities, like ENS domains.
- Decentralized storage
- Smart contract development in multiple languages
Here is a snapshot of everything that the Neo ecosystem offers as of now:

Finally, its native tokens — NEO and GAS — have well-defined roles. While GAS is meant to pay transaction fees, NEO is the standard governance and investment token.
Developed by Erik Zhang and Da Hongfgei, Neo looks like a fundamentally strong and equipped project. Due to its similarities with Ethereum and its Chinese origin, Neo has been previously termed the Chinese Ethereum. This tag alone makes us optimistic about the future price of NEO.
Here is the entire team behind NEO:

NEO price prediction and the tokenomics
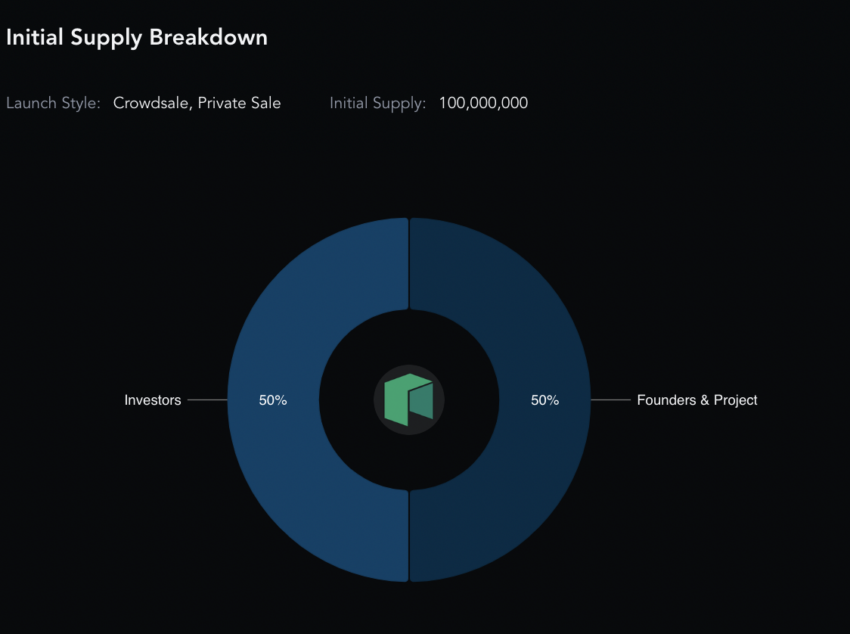
Well, innovation isn’t the only reason to focus on NEO as an investment option. NEO comes with a supply cap of 100 million tokens, with 50% earmarked for investors and the remaining 50% for the project itself. At present, 71% of the total supply forms the circulating supply. The initial token release event came with predefined vesting schedules, offering some immunity against random sell-offs and price manipulations.
Did you know? As the secondary token GAS is meant for paying transaction fees, a higher GAS generation can actually work in favor of NEO. More GAS means more transactions, which eventually would mean better adoption.
Additional Neo metrics and the possible impact of future price (2022-23 insights)
Do note that the 4-week volatility at NEO’s counter skyrocketed from mid-November 2022 to early December. As a result, the prices dipped. Once the volatility bottomed out, the prices started looking up again. A dip in volatility is therefore good news and needs to be tracked.

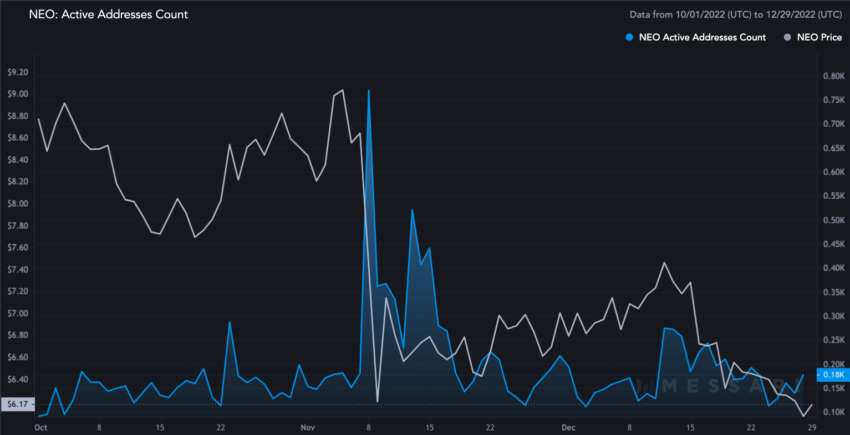
Coming to the active address count, Neo peaked around Nov. 8, 2022, when the prices shot up in response. Since then, the active address addition has been a tepid metric to track. However, the prices have also moved every time there has been an upward spike.
Another visible metric is the social volume data till November 2022. Neo’s social volume peaked on Aug. 2, 2022, and a price rally followed immediately. However, the significant drop in social volume took a toll on the rally. Minor social volume spikes had a positive impact on prices.
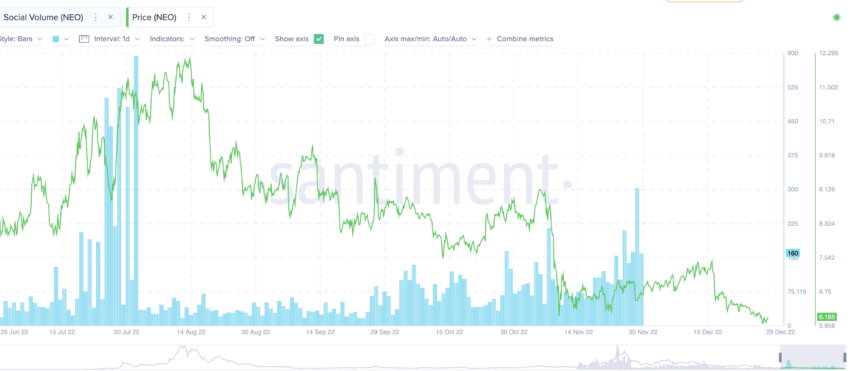
Therefore, if Neo grows in popularity, driven by positive social sentiments, short-term and long-term NEO price predictions may turn positive.
Here is Neo’s Twitter profile if you want to keep an eye on the social chatter:
NEO price prediction using technical analysis
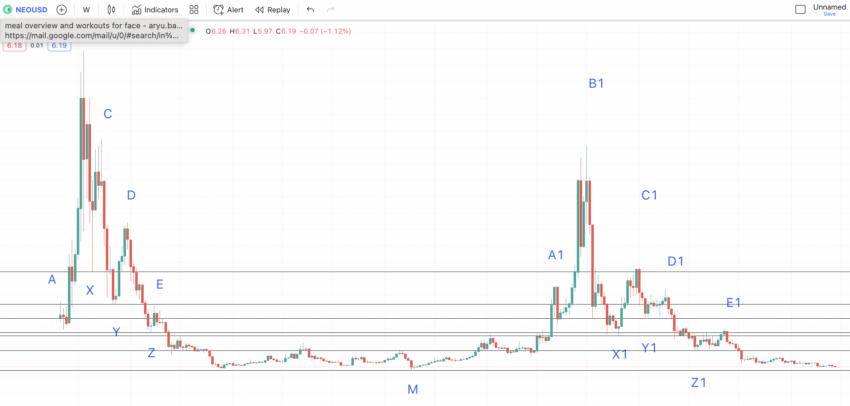
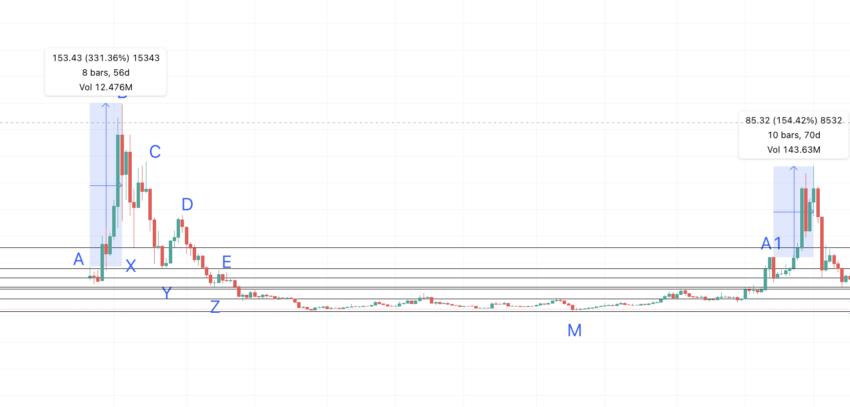
Employing technical analysis can allow us to find the future price of NEO tokens in the short and even in the long term. Here is the weekly chart we shall use to identify patterns:
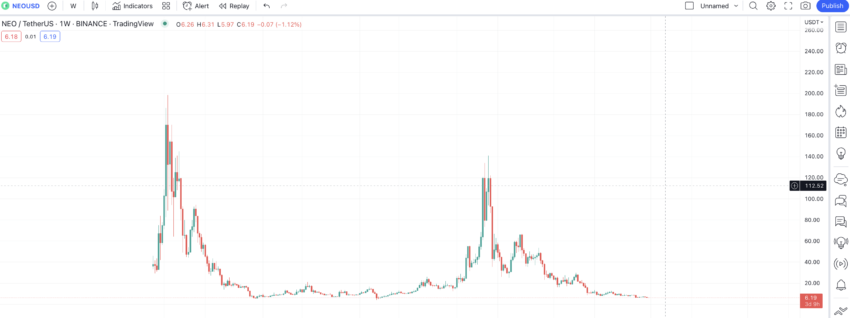
The chart shows that NEO repeats a specific pattern of higher highs followed by three lower highs. There is a period of range-bound movement, another set of higher highs, and so on.
If the same pattern is followed, we might soon see a smaller high, followed by a higher high, and then a swing high pattern (lower highs).
Price changes
Here is the chart we are talking about with all the important points marked. Do note that M is supposed to be the lowest point in the range-bound phase. This would help us locate point M1.
Let us locate the distance and price change % between the pointers marked through the first part of the pattern: (data set 1)
A to B = 56 days and 336.83% change; B to X = 21 days and -67.49% change; X to C = 21 days and 124.28% change; C to Y = 35 days and -70.18% change; Y to D = 28 days and 116.4% change; D to Z = 56 days and -71.58% change; Z to E= 7 days and 61.64% change; E to M = 609 days and -89.34% change.
Now let us locate the distance and price change % using the second pattern pointers. Data set 2 is as follows:
A1 to B1 = 70 days and 153.22% change; B1 to X1 = 77 days and -82.33% change; X1 to C1 = 49 days and -47.29% change; Y1 to D1 = 49 days and 48.82% change; D1 to Z1 = 77 days and -69.16% change; D1 to Z1 = 77 days and -69.16% change; Z1 to E1 = 63 days and 82.88% change.

Calculations
The average of all the high-to-low pointers can be found using data set 1 and data set 2. These figures show that the average distance and percentage drop from E is 127 days and 71.05%.
Using the patterns and data, the next point, or M1, might surface in 127 days and at a low of 71.05% from E1. The distance can vary and can be anywhere between 127 and 609 days (figures from Data Set 1). Now, if we draw the forecast line from E1, we see the low surface at $8.40. Also, this is a successful forecast point, indicating we are heading in the right direction with our long-term NEO price predictions.
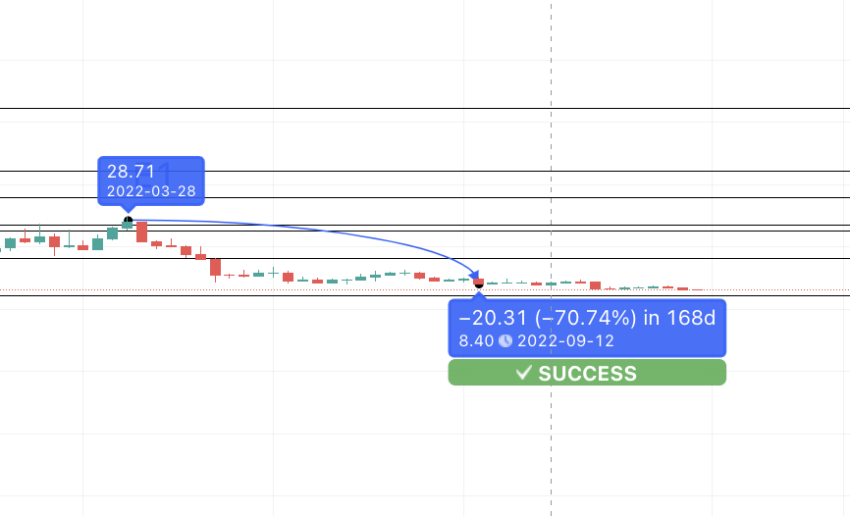
Mark this point as M1. We can now use it to locate the next set of points.
Neo (NEO) price prediction 2023
We predicted $12.44 as the NEO high in 2023. NEO fulfilled expectations and moved as high as $14. Here is what we analyzed for 2023:
If we refer to the chart above, the distance and price change percentage from M to A1 comes in 343 days and at a high of 1093.64%.
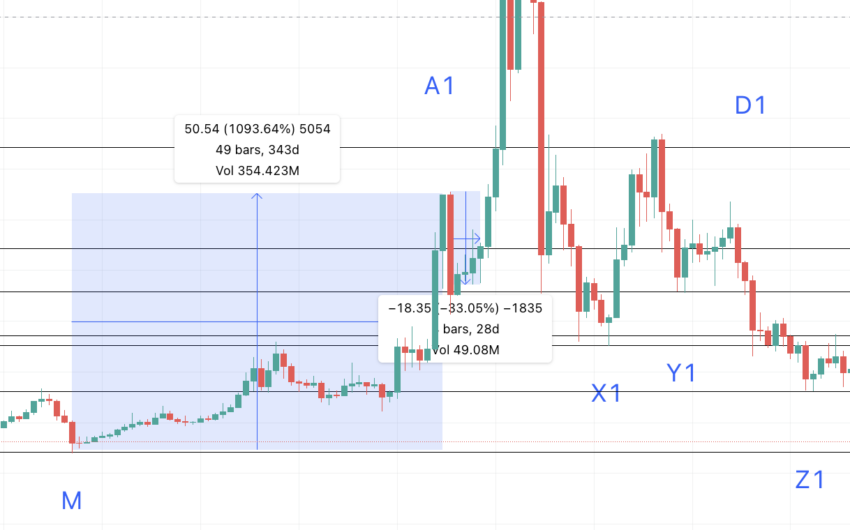
If we include this and all the other low-to-high points from the tables above, the average distance and percentage change values that turn up are 76 days and 242.92%. However, as we are in the bear market, the max number of days can go as high as 343 days, and the lowest percentage gain from M1 to A2 (the next high) can go as high as 48.82%.
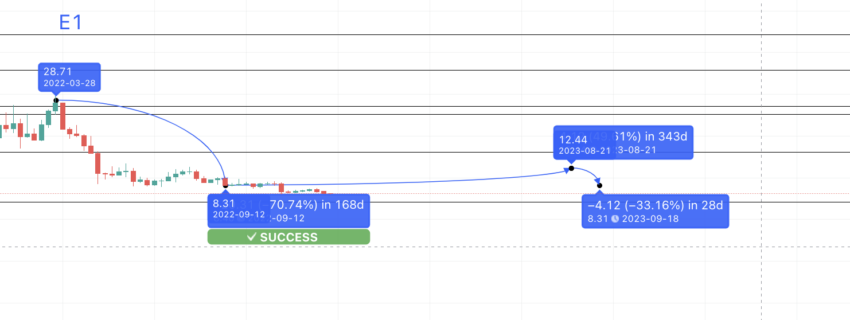
This puts the NEO price prediction 2023 high at $12.44. We can mark this point A1. Also, a low point is visible from A1 to B1, at a 33.05% drop from A1. Assuming that there would be a similar low from A2, we can trace the NEO price prediction 2023 low at $8.31.
Neo (NEO) price prediction 2024
Outlook: Bullish
Calculations
If we go back to the charts, we can locate the distance and % change from A to B and A1 to B1. The distance and price change between A to B is 56 days and 331.36%. Similarly, the distance and price change between A1 and B1 is 70 days and 154.42%.
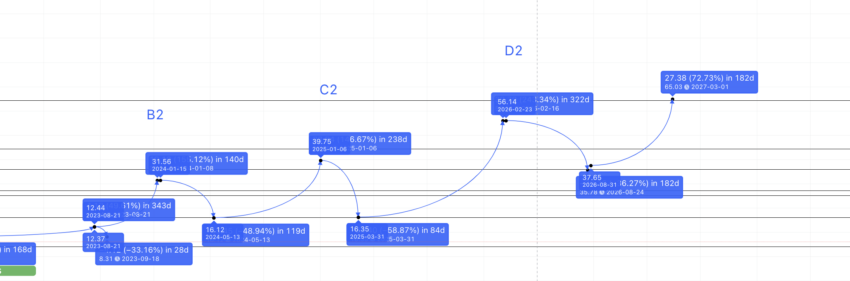
The average comes out to be: 63 days and 242.89%. However, from A2, the high can surface at 154.42%, as we expect the bear market effect to keep plaguing the crypto market for a while. So the next level or B2 from A2 could surface by early 2024 at $31.56 or B2.
The new low could be at X2. Using the data sets above, the B to X average comes at a low of 74.91% and anywhere between 21 days and 77 days. While the predicted drop can surface close to $7.50, there is strong support at $16.14. This is where the NEO price prediction for 2024 can find its low.
Projected ROI from the current level: 129%
Neo (NEO) price prediction 2025
Outlook: Bullish

Now the next point could be X2 to C2. For the levels, we need to refer to the data sets above. The average percentage growth comes at 146.45%. The distance from X2 can vary, depending on the state of the crypto market. While the high is expected to be in 2024, sluggish markets might push the same into 2025.
NEO cryptocurrency high and low in 2025
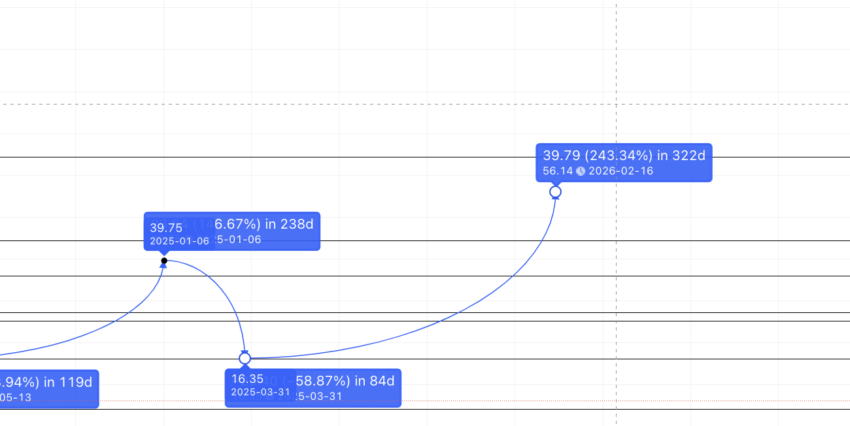
Therefore, the high in 2025 can show up at $39.75, per the drawn forecast line. This point can be C2, and the low in 2025 can trace the path from C2 to Y2. Using the table above, the C to Y average drop might translate to 58.735%. The level surfaces at $16.35, which is close to the NEO price prediction low for 2024.
Projected ROI from the current level: 187%
Neo (NEO) price prediction 2030
Outlook: Bullish
NEO is predicted to reach a high of $39.75 in 2025. And the low could surface at $16.35. However, by 2025 the bear market effects should have tailed off. This will allow the price of NEO to follow the levels mentioned in the data sets more accurately.
So if the 2025 low surfaces at $16.35 or at Y2, we can use the low-to-high average of 76 days and 242.92% (from the tables above) to find the next high. The timeframe can differ and might put the high in 2026 instead of 2025. Therefore, the NEO price prediction for 2026 high surfaces at $56.14 or at D2.
NEO price prediction 2026-27
However, B2, C2, and D2 would form a higher high by this point, defeating the existing downtrend. Therefore, the low in 2026 can go as low as $35.86, which acts as a strong support level for the price of NEO cryptocurrency. That’s a drop of a mere 36%. We can mark this as Z2.
Finally, the Z2 and E2 price change comes out at 72.26%, using data set 1 and data set 2. This places the E2 at $65.03, which is the NEO price prediction level for 2027.
Now that we have 2027 high and 2026 low as data points, we can connect the same using the Fib indicator.

This helps us trace the path till 2030. The same growth curve places the price of NEO at $229.48 by mid-2030. However, for this level to hold, NEO should be able to breach its all-time high price of $196.85 by early 2030. This all-time high can work as the immediate support and the low for 2030.
Projected ROI from the current level: 1558%
Neo (NEO’s) long-term price prediction until the year 2035
Outlook: Very bullish
NEO is predicted to reach the future price of $229.48 by 2030. Yet, if you want to look further, below is a table that can help. Do note that the maximum and minimum prices might not hold true each year. However, the average price of NEO cryptocurrency is expected to fall within these ballpark figures.
You can easily convert your NEO to USD
| Year | | Maximum price of NEO | | Minimum price of NEO |
| 2024 | $31.56 | $12 |
| 2025 | $39.75 | $16.35 |
| 2026 | $56.14 | $35.86 |
| 2027 | $65.03 | $50.72 |
| 2028 | $87.79 | $68.47 |
| 2029 | $140.46 | $109.55 |
| 2030 | $229.48 | $196.85 |
| 2031 | $275.37 | $214.78 |
| 2032 | $413.06 | $322.18 |
| 2033 | $578.28 | $451.05 |
| 2034 | $751.77 | $466.09 |
| 2035 | $1,127.66 | $699.14 |
Is the NEO price prediction accurate?
This NEO price prediction model is fairly accurate and practical. It considers all the crucial chart points throughout the technical analysis. Plus, it covers the fundamentals of this open-source blockchain, followed by tokenomics and even the overall ecosystem growth. While this price prediction model tracks the future price of NEO across years, the best approach would be to aim for the average price each year to avoid making impulsive calls. Timing the exact top or even the bottom is nearly impossible in today’s volatile crypto market.
Frequently asked questions
What will NEO be worth in 5 years?
Does NEO crypto have a future?
What will NEO be worth in 2030?
Will NEO price go up?
Is NEO better than Cardano?
Disclaimer
In line with the Trust Project guidelines, the educational content on this website is offered in good faith and for general information purposes only. BeInCrypto prioritizes providing high-quality information, taking the time to research and create informative content for readers. While partners may reward the company with commissions for placements in articles, these commissions do not influence the unbiased, honest, and helpful content creation process. Any action taken by the reader based on this information is strictly at their own risk. Please note that our Terms and Conditions, Privacy Policy, and Disclaimers have been updated.
