

The crypto space has seen a diverse range of projects throughout its ascendency. Yet, only a handful are as innovative as Helium — an open wireless ecosystem to power the next generation of IoT devices. Helium vows to change the state of global wireless connectivity: no small task. Our primary focus here, though, is on preparing the ultimate Helium price prediction model. So, does the price signal a good time to invest?
In this Helium (HNT) price prediction, we look at the utility of the Helium blockchain, its growth aspects, the relevance of its native token, HNT, and other fundamental aspects.
- Helium (HNT) price prediction and fundamental analysis
- Helium tokenomics and price forecast
- HNT price forecast using on-chain and growth metrics (2022-23 data)
- Helium price prediction using technical analysis
- Helium (HNT) price prediction 2023
- Helium (HNT) price prediction 2024
- Helium (HNT) price prediction 2025
- Helium (HNT) price prediction 2030
- Helium (HNT’s) long-term price prediction until 2035
- How accurate is the Helium price prediction?
- Frequently asked questions
Want to get HNT price prediction weekly? Join BeInCrypto Trading Community on Telegram: read HNT price prediction and technical analysis on the coin, ask and get answers to all your questions from PRO traders! Join now
Helium (HNT) price prediction and fundamental analysis
Helium works like a novel wireless network in the physical world, albeit with blockchain-specific, decentralized exposure. Anyone can build or assemble a physical Helium hotspot/miner/blockchain node. They just need to use the Helium LongFi protocol and are then able to hop onto the ecosystem. For providing services (the issue of connectivity to devices), users get HNT as compensation.
Overall, the incentivizing model looks great, and Helium actually aims to solve a real-world problem — of subpar IoT connectivity.
Apart from the utility, there are a few key things you should consider knowing about the Helium network. These include:
Did you know? Helium, the company, was started by Sean Carey, Shawn Fanning of Napster fame, and Amit Haleem.
- The project aims to build an infrastructure around the Internet of Things.
- It uses proof-of-coverage as the consensus mechanism where the hotspots must prove their network strength and positioning.
- Users providing coverage-specific services get HNT, whereas the same HNT transforms into Data Credits (transaction fees for using the platform) upon burning.
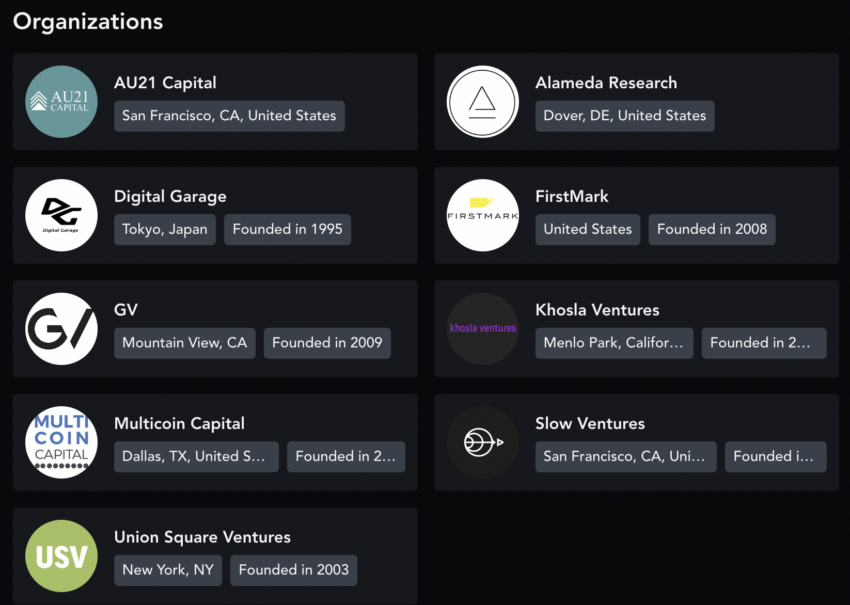
- Alameda Research was a Helium investor. Therefore, the FTX contagion might push HNT prices back by a few notches.
As more people start relying on the Helium network to provide and get access to services, the HNT token could gain popularity.
Helium tokenomics and price forecast
Helium’s token allocation is one of the more transparent ones around. Firstly, there was no pre-mine or initial allocation involved. After the network went live, HNT tokens started rolling out to the participating hotspots.
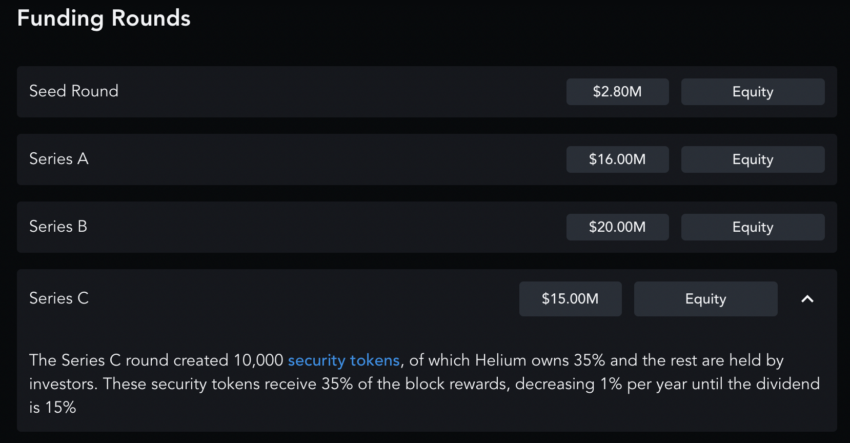
Plus, the genesis block of the mainnet had programmed token releases for holders of the security tokens. They also started getting HNT once the mainnet kicked off. The security token sale started with a $2.80m seed round.
Moving to the tokenomics model, HNT follows what we call a “burn and mint” principle. This means HNT supply depends on the number of hotspots growing as part of the mainnet and their work. While the hotspot deployment generates HNT, the hotspots using the network lead to HNT burn for Data Credits. Hence, the supply depends on the equilibrium.
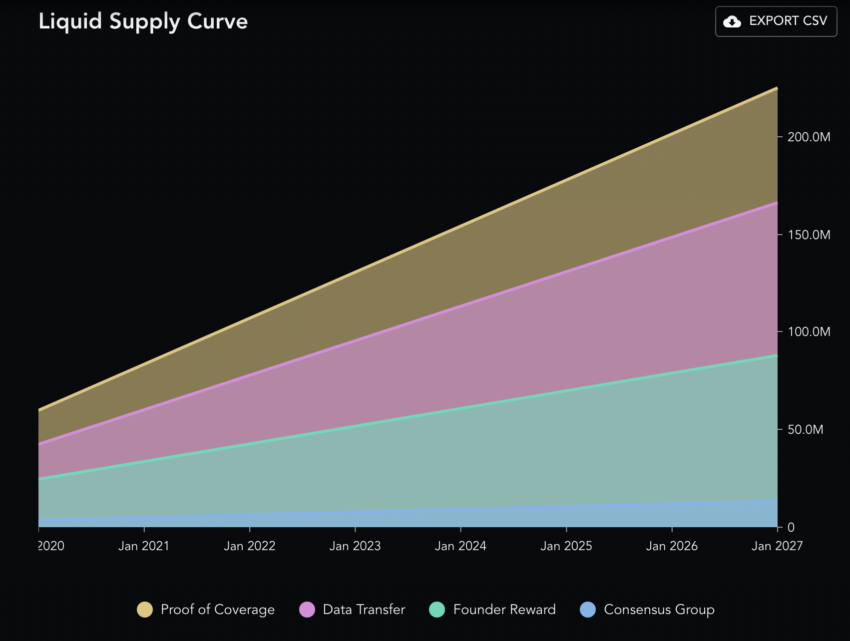
The supply is capped at 223 million; at present, 72% of the same form the circulating supply. Do note that nodes can earn HNT in many ways, including founder rewards, perks for data transfer, establishing proof of coverage, and more.
The ideal scenario would be that more people try to use the services. This would help create a better equilibrium between the HNT mint and burn. Trading HNT also makes sense as it supports staking and helps keep the network secure.
HNT price forecast using on-chain and growth metrics (2022-23 data)
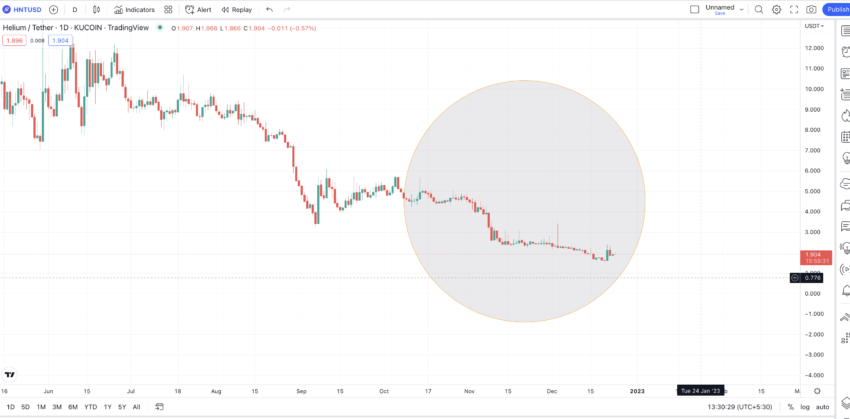
Looking at the overall price volatility from June-end onwards, HNT prices turn volatile spuriously. Peak volatility surfaces on Nov. 25, 2022, which was higher than the peak level of Sept. 8, 2022.
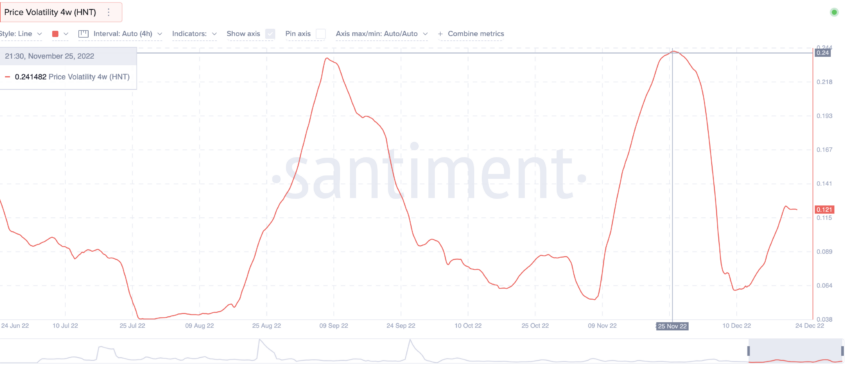
Helium prices didn’t take this kindly and started dropping once the volatility in November 2022 shot through the roof.
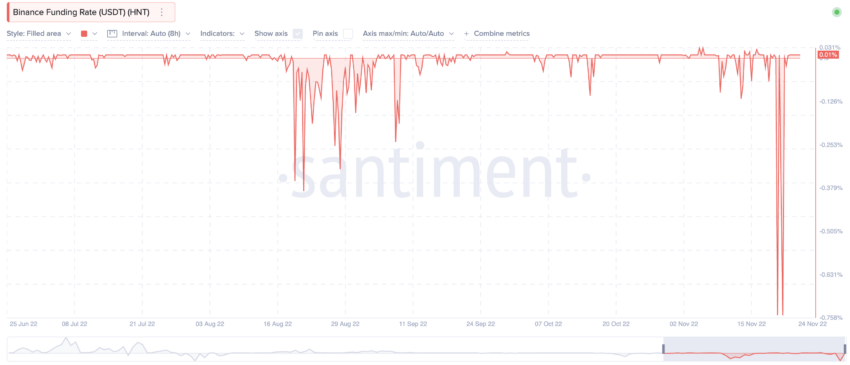
The Binance funding rate for the HNT-USDT pair dropped significantly (into negative territory) in November 2022. And as a result, we saw a price drop in November. Hence, we can infer that a negative funding rate and increasing volatility can work against the price of HNT.
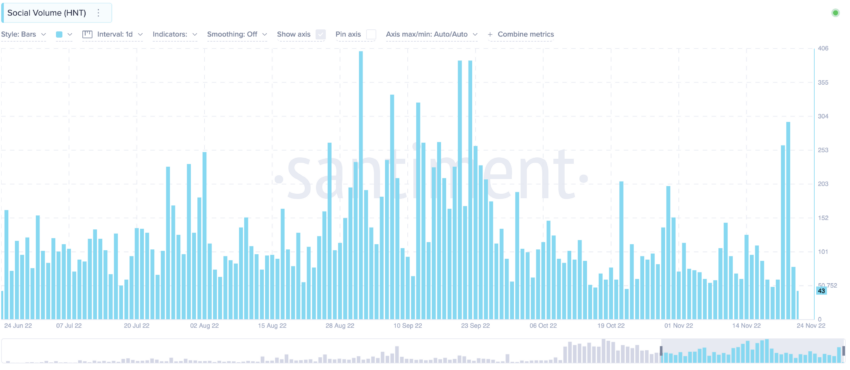
The social volume started looking up by the end of November 2022. However, it is yet to touch the high made on Sep. 1, 2022.
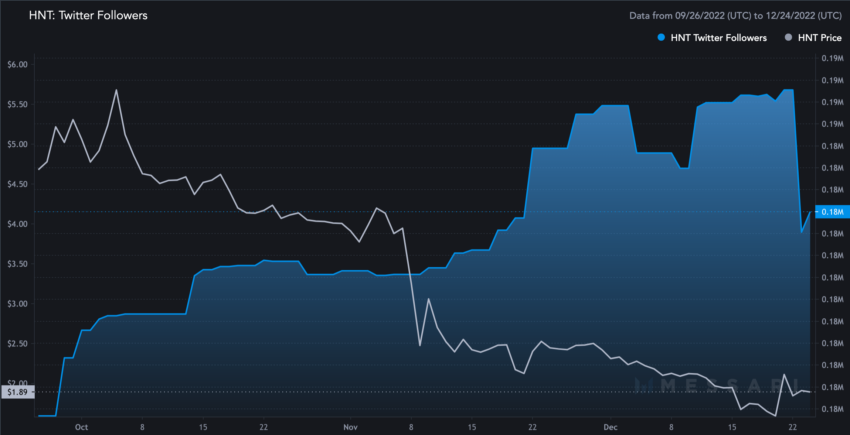
Helium’s official Twitter handle shows subscribers peaked in December 2022 despite the low prices. This could mean people are still interested in HNT despite the dipping prices.
Helium price prediction using technical analysis
Before we move ahead with the technical analysis of HNT, here are the things we should be aware of:
- The price of HNT — the native cryptocurrency of the Helium Network — was at its peak on Nov. 12, 2021. It was $55.22.
- The all-time low price was on June 10, 2020, at $0.2534
- HNT’s market cap was at its all-time high of $5.38 billion on Nov. 15, 2021.
- At the peak, HNT saw a trading volume of $81.94, which was still modest considering the large market cap.
- As of Dec. 24, 2022, the market cap was $258.44 million, and the trading volume was $2.52 million.
- At the peak, the trading volume to market cap ratio was 0.015. By 2022 end, it was 0.009. The volatility was high in 2022, which worked in favor of HNT in 2023.
Here is the weekly chart that shows a pattern:
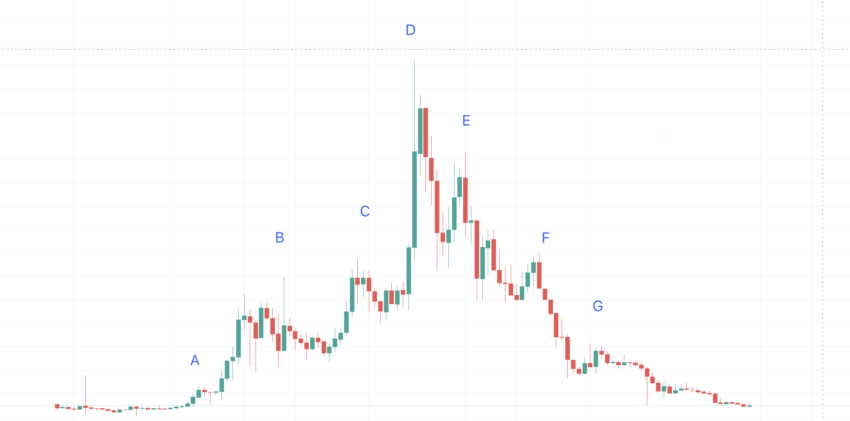
Pattern formation
HNT’s price chart forms a near-symmetrical pattern. Notice that there are three higher highs (A, B, and C) before the final peak at D. Post the peak, there are three lower highs as E, F, and G. The start of the pattern starts with a range trading zone and so is the current range trading zone.
We can, therefore, assume that a fresh higher high cycle might soon start.
Also, we need to locate the lows to make better calculations corresponding to the highs. Let us mark the lows of the pattern initiation and pattern conclusion as X and Y, respectively. We can also mark the lows between the higher and lower highs.
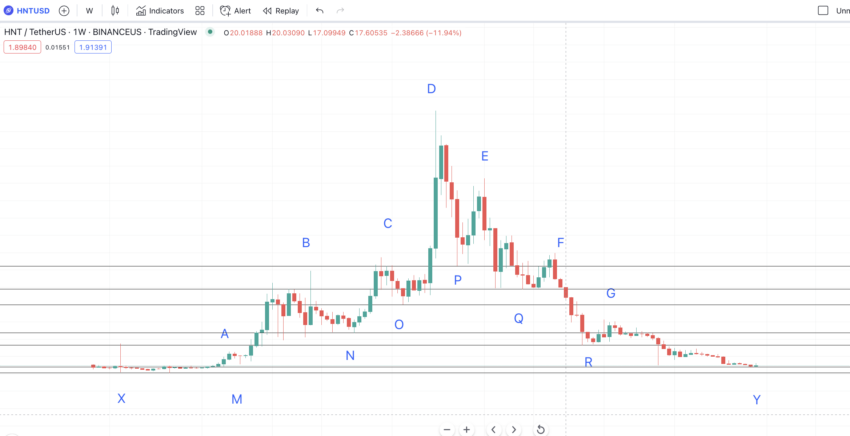
Above is the chart with all the important points. Do note that we have ignored the minor peaks along the way (like before B). Also, HNT’s lows are definite during the first part of the pattern and the second part of the pattern. That means you only get higher lows during an uptrend and lower lows during a downtrend. Expect this pattern to continue once the uptrend starts.
Price change: high to low
Now, to find the first peak, we must find the average distance and price range between X and M and Y and G. That will help us determine where the next high from Y could surface.
First, we can confirm if Y is the actual low for this side of the pattern or if HNT could drop lower. Let’s take the high to low points from D, first on the right side and then on the left.
Data set 1 is as follows:
D to P = 28 days and -59.15% price change; E to Q = 49 days and -56.5% price change; D to O = 42 days and -73.78% price change; C to N = 35 days and -65.09% price change; B to M = 91 days and -90.69% price change; A to X = 77 days and -96.28% price change.
If we take the average of all these high to low points, the distance and the percentage drop for locating the next pattern is 51 days and 73.97%.
The max distance and max drop can vary depending on the bear market. Therefore, from G, the next level, Y, looks accurate and practical enough.
Price change: low to high
Now, let us identify the price changes from the lows to the highs. That will help us locate the next high, which would surely be in 2023.
Data set 2 is as follows:
X to A = 77 days and 2349.19% price change; M to B = 91 days and 965.58%; N to C = 35 days and 180.82; O to D = 42 days and 279.79%; P to D = 28 days and 143.51%; Q to E = 49 days and 130.5% price change; R to F = 35 days and 313.68% price change; Y to G = 196 days and 662.05% price change
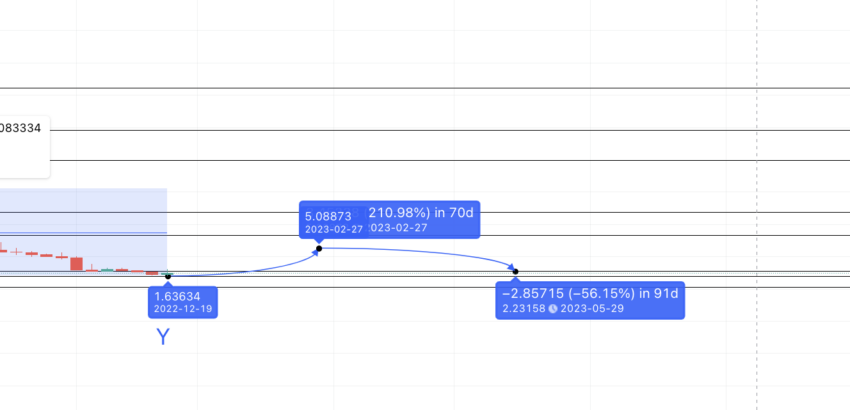
While the ideal average percentage is 628.14%, we can take the very high values like 2349.19, 965.58, and 662.05 out of the equation. This is due to the bear market. Therefore, the average percentage growth from Y could be 209.66%.
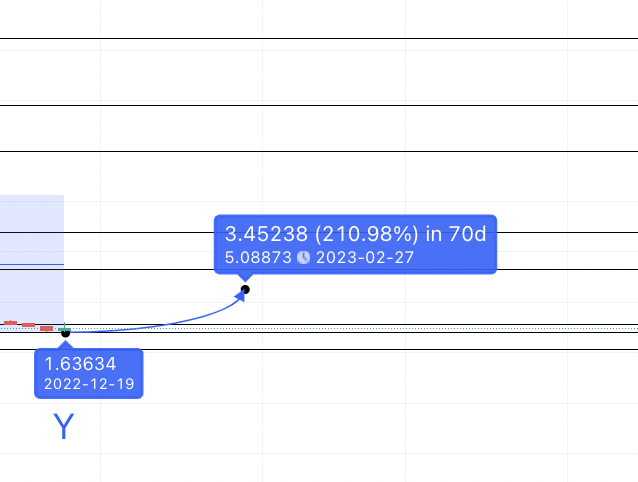
The average timeframe comes to be 69 days. So, if we draw a forecast line from Y, the next high comes to be at $5.08.
Short-term outlook
Is a level of $5.08 attainable? Let’s consider this, keeping the short-term outlook in mind.
The daily chart shows that HNT is trading inside a descending triangle pattern. As HNT is in a downtrend, the descending triangle breakout above the upper trendline can kickstart an uptrend. Therefore, a trend reversal might be on the cards.
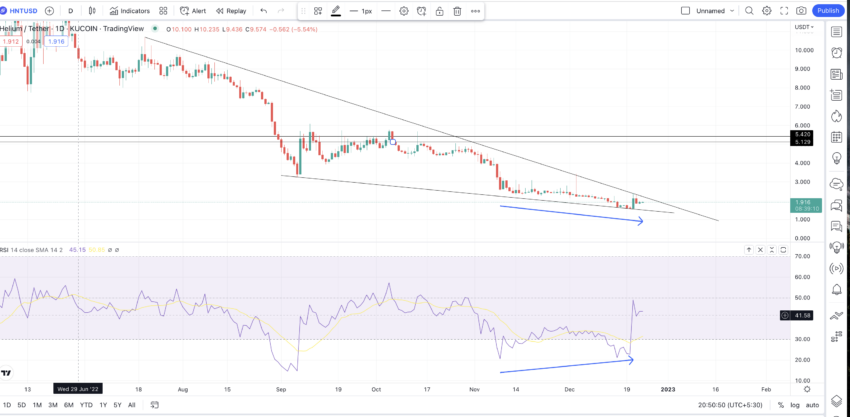
Also, the RSI is showing a bullish divergence, making higher lows then the price is making lower lows. Hence, a short-term rally isn’t impossible for HNT. Do note that on the daily chart, a strong resistance exists at $5.12, which means $5.08 in 2023 might just happen.
And it did. HNT reached our 2023 price prediction level in August 2023.
Helium (HNT) price prediction 2023
Here is how we successfully analyzed HNT’s price in 2023:
As mentioned, the Helium price prediction 2023 high can be $5.08. And according to data set 1, the low can surface at a 73.97% drop from $5.08. That comes at $1.39.

However, there is strong support for HNT at $2.21. Also, when HNT is in an uptrend, it doesn’t make a lower low. Therefore, the low in 2023 could surface at $2.21.
Helium (HNT) price prediction 2024
Outlook: Neutral
HNT’s price surged a lot towards the end of 2023 and the beginning of 2024. The level of $10.05 was reached, which we expect to be the high for 2024. Post that, there might be some sell-off.
The 209.66% low-to-high movement average in data set 2 puts the expected price level in 2024 at $6.99. The low in 2024 is at $3.08, which is a 56.50% drop, and in 91 days. This calculation is based on the lowest percentage drop and highest number of days in data set 1.
Projected ROI from the current level: 14%
Helium (HNT) price prediction 2025
Outlook: Bullish
Let’s connect the last low of the old pattern (Y) and the first high of the new pattern A1 using the Fib indicator. This gives us a price projection for 2025’s high at $38.67.
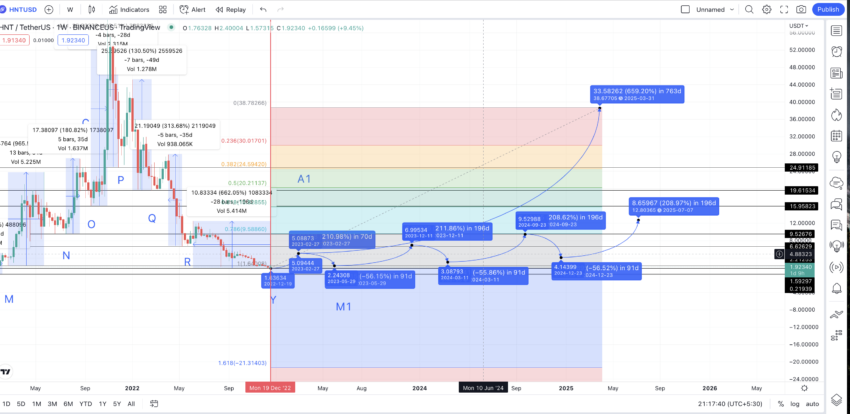
If we go via this route, the next high could surface at $9.52 (previously expected high), which also shows up in 2024 — making it the high for 2024. The low from this point, using the lowest drop percentage, surfaces at $4.14. From this low, a 209.66% rise will give us the high in 2025, which is $12.80.
Therefore, the possible bullish high in 2025 can be at $38.67, whereas the more practical level could be at $12.80.
Projected ROI from the current level: 43%
Helium (HNT) price prediction 2030
Outlook: Bullish
By 2025, HNT is expected to pick up pace in terms of adoption. Therefore, you can expect the Fib levels to kick in when plotting the Helium price prediction levels until 2030. For that, we will use the 2025 high and 2024 low to draw the Fib levels. This puts the 2030 high for HNT at $72.33.
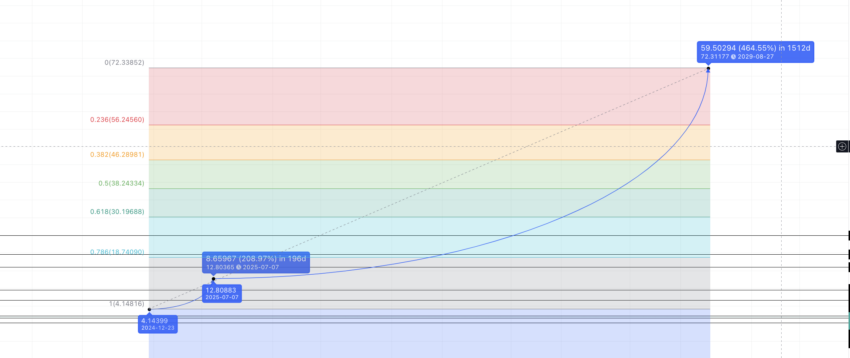
Do note that if we keep the same slope intact, the price forecast for HNT ensures it breaches its all-time high of $55 in 2029.
Projected ROI from the current level: 713%
Helium (HNT’s) long-term price prediction until 2035
Outlook: Bullish
To track the price forecast of HNT beyond 2030, the figures below project long-term prices. Do note these might change depending on the bear and bull phases of the cryptocurrency market. Also, it is important to keep an eye on the adoption of Helium’s LongFi technology and the financials to trace the path till 2035 and beyond.
You can easily convert your HNT to USD here
| Year | | Maximum price of HNT | | Minimum price of HNT |
| 2024 | $10.05 | $5.90 |
| 2025 | $12.80 | $7.93 |
| 2026 | $17.28 | $10.71 |
| 2027 | $25.92 | $20.21 |
| 2028 | $38.88 | $30.26 |
| 2029 | $58.32 | $36.15 |
| 2030 | $72.33 | $44.84 |
| 2031 | $94.02 | $73.33 |
| 2032 | $117.53 | $91.67 |
| 2033 | $152.78 | $119.16 |
| 2034 | $198.62 | $123.14 |
| 2035 | $218.48 | $170.41 |
How accurate is the Helium price prediction?
This Helium price prediction model uses short-term technical analysis and long-term pattern formation to predict future prices. Therefore, you can consider this to be a realistic representation of the future prices for the Helium Network and its native cryptocurrency, HNT. We’ve covered the fundamentals, on-chain metrics, and social growth of the network and its token in order to prepare this Helium price prediction piece. Overall, the projections look practical and attainable. Of course, the crypto market is volatile, so it’s important not to take highs and lows as absolutes. Rather, yearly averages offer superior forecasting benchmarks.
Frequently asked questions
Does Helium coin have a future?
Will Helium (HNT) price go up?
What will Helium cost in 2030?
How much is HNT worth in 2025?
Is Helium a good investment?
Is HNT supply limited?
Disclaimer
In line with the Trust Project guidelines, the educational content on this website is offered in good faith and for general information purposes only. BeInCrypto prioritizes providing high-quality information, taking the time to research and create informative content for readers. While partners may reward the company with commissions for placements in articles, these commissions do not influence the unbiased, honest, and helpful content creation process. Any action taken by the reader based on this information is strictly at their own risk. Please note that our Terms and Conditions, Privacy Policy, and Disclaimers have been updated.


