

Ethereum Classic is a hard-forked chain that retained the characteristics of the original Ethereum protocol before the infamous DAO hack. And even though it didn’t become as popular as Ethereum, Ethereum Classic continues to be a reliable Dapp and smart contract-focused chain — all while being proof-of-work. The question arises — what to expect from ETH going into 2025 and beyond?
Throughout this Ethereum Classic price forecast, we consider the fundamentals, tokenomics, and key on-chain metrics of the network to assess ETC’s price potential.
KEY TAKEAWAYS
➤ Ethereum Classic retains the original Ethereum’s PoW protocol, appealing to purists and smart contract developers.
➤ ETC’s fixed supply and deflationary nature could drive long-term value growth, with projected ROI at 2416% by 2030.
➤Upgrades like Phoenix and Atlantis make ETC compatible with Ethereum, ensuring continued relevance in the ecosystem.
- Ethereum Classic (ETC’s) long-term price prediction
- ETC technical analysis
- Ethereum Classic (ETC) price prediction 2024 (concluded)
- Ethereum Classic (ETC) price prediction 2025
- Ethereum Classic (ETC) price prediction 2030
- ETC fundamental analysis
- Ethereum Classic tokenomics
- Is the ETC price prediction model accurate enough?
- Frequently asked questions
Ethereum Classic (ETC’s) long-term price prediction
Outlook: Very bullish
Here are the projected price movements through 2035.
| Year | Maximum price of ETC | Minimum price of ETC |
| 2023 | $45.88 | $17.93 |
| 2024 | $27.33 to $54.66 | $27.68 |
| 2025 | $134.61 | $31.58 |
| 2026 | $161.26 | $52.71 |
| 2027 | $201.57 | $124.97 |
| 2028 | $262.04 | $204.39 |
| 2029 | $393.07 | $243.70 |
| 2030 | $503.24 | $392.52 |
| 2031 | $629.05 | $490.66 |
| 2032 | $754.86 | $588.79 |
| 2033 | $905.85 | $706.56 |
| 2034 | $1177.58 | $918.51 |
| 2035 | $1295.34 | $1010.36 |
ETC technical analysis
Pattern recognition
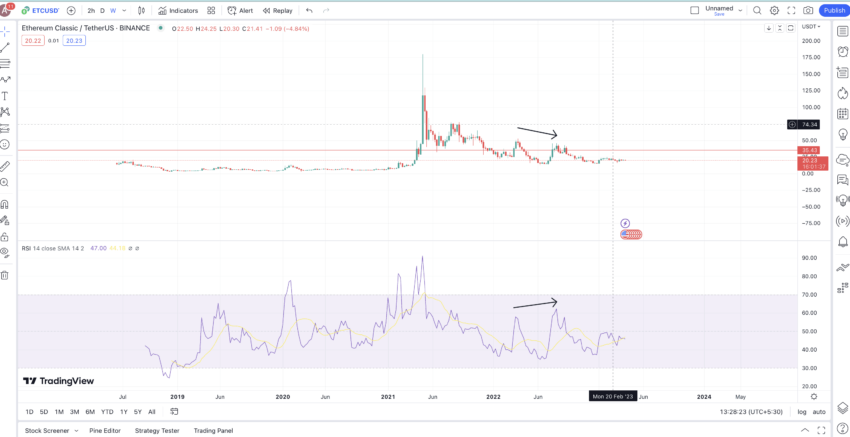
Below is the weekly chart, with ETC’s all-time high price, close to $177, standing out as a clear peak. On the left side of the peak, we have a set of higher highs, whereas the right side comprises lower highs. You can only notice a bullish divergence, illustrated by the weekly RSI formation. This might hint at a new pattern formation, with the existing series of lower highs being interrupted by a higher high.
Here are all the highs and lows marked on the weekly chart — points that would help you locate the average low-to-high and high-to-low price movements.
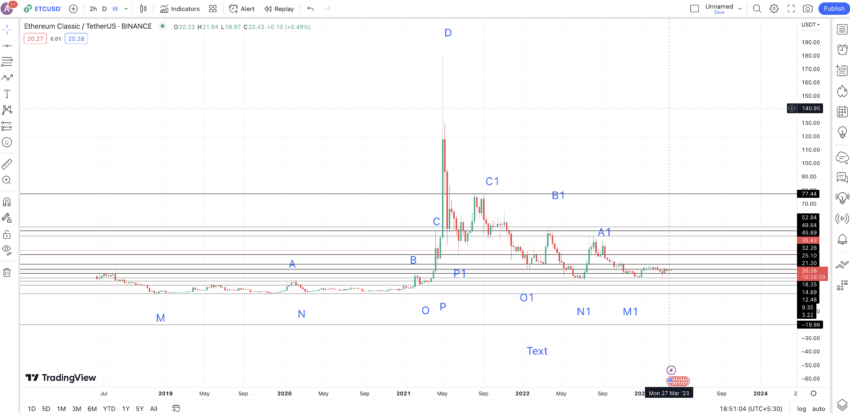
Note: Sometimes, the same candle makes the highs and then drops to make the lows. However, we have ensured that we take only the candle(s) next to the one making the high for calculation-specific ease.
Price changes
To calculate the average low-to-high and high-to-low percentages, we can now locate the movements (percentage changes and distance) between every low and the subsequent high across two paths: M to D and M1 to D.
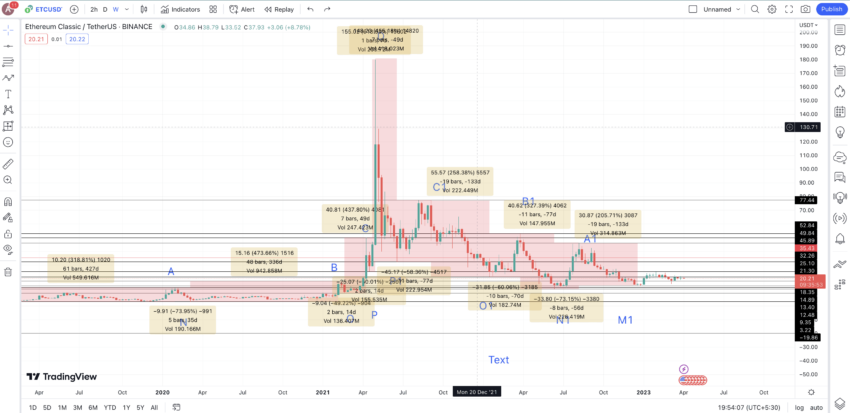
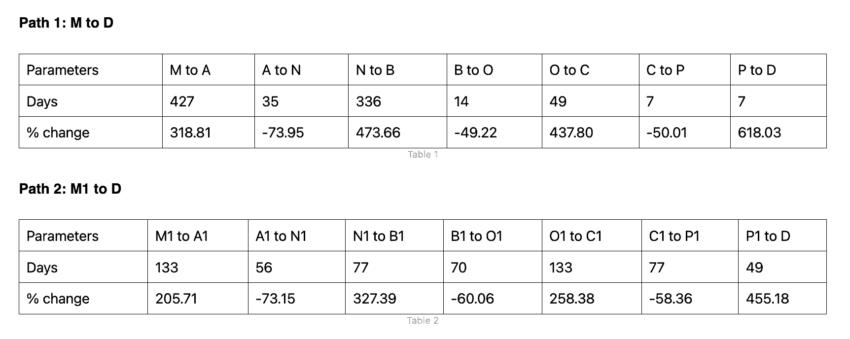
Now that we have all the data for the corresponding points, we can calculate the low-to-high and high-to-low averages for the subsequent price movements.
Low-to-high: 386.87% and anywhere between 7 days to 427 days. However, in bearish market conditions, the growth percentage could be 205.71% — the lowest one from the table.
High-to-low: 60.79% and anywhere between 7 days to 77 days. Note that in bullish market conditions, the percentage drop could be -49.22% — the lowest value from the table above.
Per the values from earlier, we can now trace the ETC price predictions through to 2035.
Ethereum Classic (ETC) price prediction 2024 (concluded)
As the high in 2023 was 50% of our predicted price, we considered that for 2024 and looked for a range instead of pinpointing an exact level.
This put the B2 at $54.66. The next low, post-B2, was expected to surface at a dip of -49.22% in 77 days. This put 2024 low at $27.68. Due to volatile market conditions, ETC could read a high of $38.26 in 2024, partially aligning with our price prediction levels. The low, however, was respected as even in early 2025, ETC is moving close to the $26 mark.
Ethereum Classic (ETC) price prediction 2025
Outlook: Bullish
Based on the levels ETC touched in 2024, we can expect the average hike of 386.87% (in 427 days max) to hold. This significant price rise would put the high in 2025 at $134.61. Keeping the average price of 60.79% in mind, the low can surface at $52.71 — pretty close to the support level of $52.84. However, per our calculations, this level might surface in 2026.

And the 2025 low could be anywhere close to the $31.58 mark, tracing the path from 2024 to 2025.
Projected ROI from the current level: 573%
Ethereum Classic (ETC) price prediction 2030
Outlook: Very bullish
Now that we have the 2026 low at $52.71, we can expect the next high to follow the lowest percentage of 205.71% again. This is considering the fact that it might be very difficult for ETC to grow by close to 400% across consecutive years, based on historical data.
The time taken could still be 427 days, considering the tepid expectations. Therefore, the next high, expected to surface in 2027, could form at $161.26. Still short of the ETC’s current all-time high.
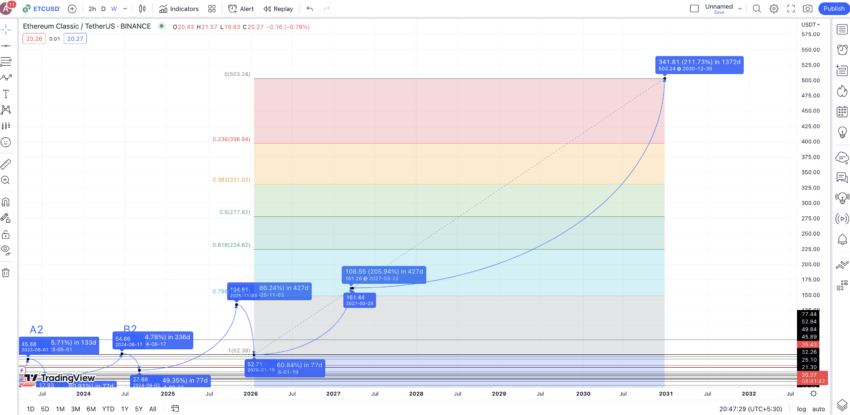
Keeping 2027 as the high and with the 2026 low in mind, we can extrapolate the ETC price prediction levels till 2030. Do note that this might not be the most accurate projection, but it gives a fair idea of where the ETC-specific price movements might head in the next few years.
This assumption puts the price of Ethereum Classic at $503.24 by the end of 2030, considering it keeps following the same growth trajectory.
Projected ROI from the current level: 2416%
ETC fundamental analysis
It is appropriate to look at Ethereum Classic from a more fundamental perspective to understand how ETC, the native crypto, holds in a world where ETH reigns supreme. Here are some of the aspects that look optimistic:
- Ethereum Classic is still PoW, which might feel a tad more secure to the purists. In 2020, the Classic chain even made a few decentralized tweaks to improve network security against majority attacks, or 51% attacks.
- Ethereum Classic has a well-defined roadmap in place, focusing on incremental developments and chain upgrades. There have already been many upgrades, including Phoenix, Agharta, and Atlantis. These have taken the abilities of the Classic chain to the next level, even making it compatible with the existing Ethereum network.
Also, if you check the official website, you will notice how Ethereum Classic claims to be the “original Ethereum.”

Coming to relevance, Ethereum Classic supports smart contracts and DApps, all while being compatible what the Ethereum network. Therefore, if someone wants to experience the PoW version of Ethereum, going classic might just be a better approach.
Overall, Ethereum Classic still makes sense to the PoW purists who liked Ethereum before it transitioned to the PoS space.
Did you know? Ethereum Classic adheres to the concept of immutability, just like Ethereum. It came into existence in 2016.
Ethereum Classic tokenomics
Unlike ETH, ETC tokens have a fixed supply of 210.7 million. This gives Ethereum Classic a deflationary twist. Also, it is worth mentioning that as Ethereum Classic is a PoW chain, miners have the incentive to keep validating blocks.
A fixed token supply and reduced miner rewards currently make Ethereum Classic disinflationary. And once the circulating supply equals the total supply, you can expect the same to turn deflationary. This might positively impact the long-term prices of Ethereum Classic ETC.
“Ethereum Classic has outperformed Ethereum this year.”
Dan Held, Ex-Growth at Kraken: X in 2021
Is the ETC price prediction model accurate enough?
Firstly, this ETC price prediction model uses detailed fundamental and technical analysis to predict short-term and long-term price movements of this Ethereum sibling. While the data-backed approach makes this Ethereum Classic price forecast model one of the more accurate, looking at the average price of Ethereum Classic for any given year is the most realistic reflection of the actual levels.
Disclaimer: This analysis focuses on Ethereum Classic (ETC) and is for informational purposes only. ETC’s price is influenced by market trends, ecosystem developments, and network adoption. Cryptocurrency investments, including ETC, are highly volatile and carry significant risks. Always conduct your own research (DYOR) and consult a financial advisor before investing.
Frequently asked questions
Can ETC reach $1000?
How high is ETC expected to go?
How much will Ethereum Classic be worth in 2025?
Is ETC a good investment?
Disclaimer
In line with the Trust Project guidelines, the educational content on this website is offered in good faith and for general information purposes only. BeInCrypto prioritizes providing high-quality information, taking the time to research and create informative content for readers. While partners may reward the company with commissions for placements in articles, these commissions do not influence the unbiased, honest, and helpful content creation process. Any action taken by the reader based on this information is strictly at their own risk. Please note that our Terms and Conditions, Privacy Policy, and Disclaimers have been updated.


