

Termed a sharded multichain ecosystem (a protocol), Polkadot is one of the few blockchain networks to support cross-chain asset and data transfers. But that’s not all that Polkadot achieves or aims to achieve. Throughout this DOT price prediction piece, we delve into this layer-0 blockchain, focusing on DOT’s price, the Polkadot network’s growth, and other metrics.
- DOT price prediction and fundamental analysis
- DOT and the associated tokenomics
- Key metrics and the Polkadot price forecast
- DOT price prediction and technical analysis
- Polkadot (DOT) price prediction 2023
- Polkadot (DOT) price prediction 2024
- Polkadot (DOT) price prediction 2025
- Polkadot (DOT) price prediction 2030
- Polkadot (DOT’s) long-term price prediction (up to 2035)
- Is this DOT price prediction theory accurate enough?
- Frequently asked questions
Want to get DOT price prediction weekly? Join BeInCrypto Trading Community on Telegram: read DOT price prediction and technical analysis on the coin, ask and get answers to all your questions from PRO traders! Join now
DOT price prediction and fundamental analysis
Polkadot is a tech-loaded blockchain ecosystem with several components working in unison. These include relay chains, para chains, bridges, and parathreads. Each of these components has a specialized structure and tech behind it.
Did you know? Co-founded by Peter Czaban, Robert Habermeier, and Dr. Gavin Wood, Polkadot is more like a network of smaller para chains set atop the base network or the relay chain.
As for the use cases, Polkadot aims to further the web3 vision by bringing interoperability, energy efficiency, security, governance, and scalability to the ecosystem. Here are some reasons Polkadot should be on your radar:
- Polkadot works as the base layer to several layer-1 powered blockchains.
- Polkadot can seamlessly connect to oracles, private/public chains, and permissionless networks — bringing everything and everyone under the same roof.
- DOT, the native token, supports staking, network governance facilitation, and para-chain bonding.
Simply put, the Polkadot protocol makes it easier for different blockchains to talk to each other — a use-case that might become even more important in future years. This makes us optimistic about the long-term Polkadot price forecast.
DOT and the associated tokenomics
Here is what the token allocation (initial) of DOT looks like:
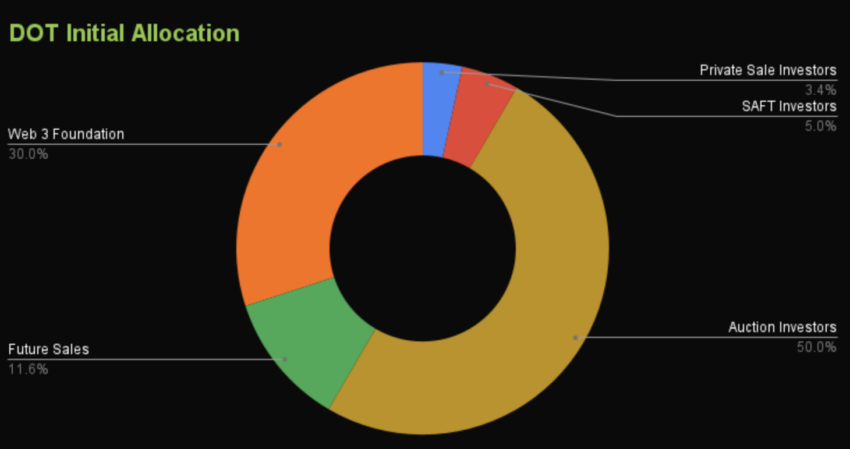
The tokenomics model looks relatively transparent, with the auction (ICO) investors having 50% of the total supply. However, there isn’t a supply cap with the staking and rewards mechanism expected to keep generating new DOT.
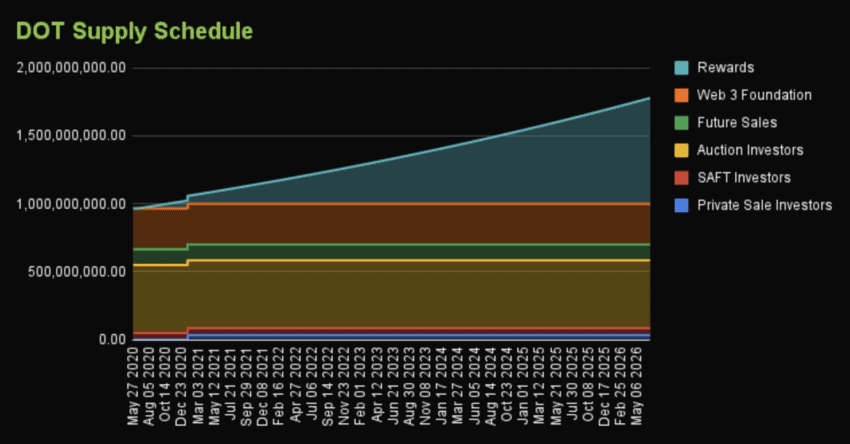
If you look at the supply schedule, the rewards section seems to be making a steep growth slope, hinting at the inflationary nature of the Polkadot network crypto. Notably, this is the supply schedule from early 2023, but still relevant considering the inflationary nature of DOT.
“After exactly 15 months in development,
@polkadot XCM version 3 is merged. This enables bridges, cross-chain locking, exchanges, NFTs, conditionals, context-tracking and more.”
Gavin Wood, Founder of Polkadot: X
Key metrics and the Polkadot price forecast
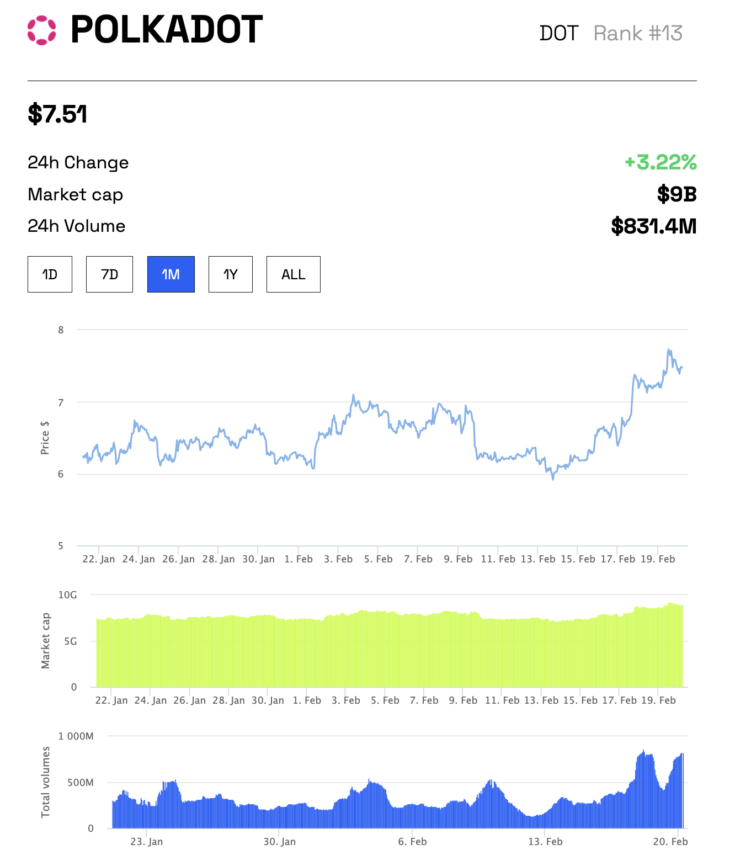
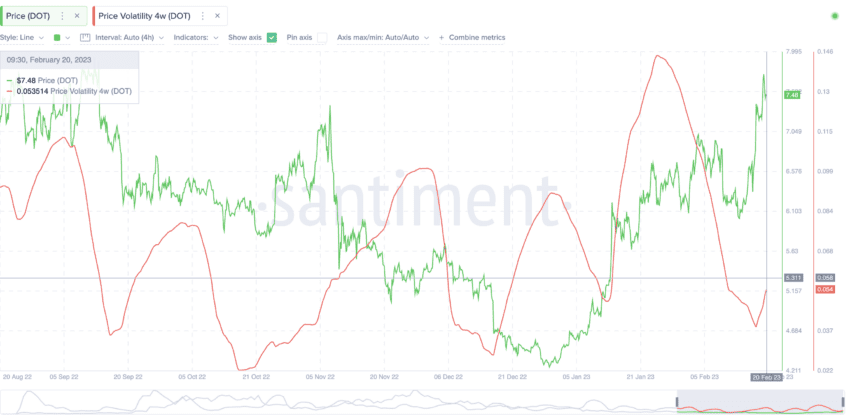
DOT’s price-market cap-trading volume chart shows an interesting trend. As of Feb. 20, 2023, the price action has been positive over the past two weeks, owing to the steady rise in the trading volume.
Also, the growing trading volume means that the volatility of the DOT coin might just be going down — a news piece that actually held true over the next few weeks.
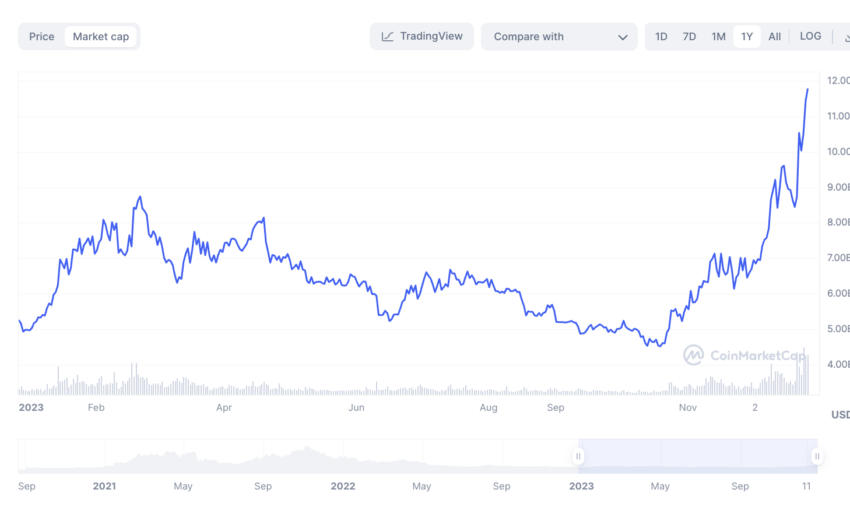
However, the yearly market cap and trading volume have started peaking as of December 2023. This aligns with DOT scaling new highs in 2023. A steady increase as such should work well for the price action.
The volatility chart, as of February 2023, shows a new bottom formation while the price peaks. However, historical data suggests that the price of DOT moves up, even a few days or weeks post the volatility trough. This might hint at a bullish price move for DOT in the short term.
This theory came out right as DOT made a new high only after experiencing a volatility dip around December 2023. However, the same has spiked now, which might lead to a short-term correction at the counter.
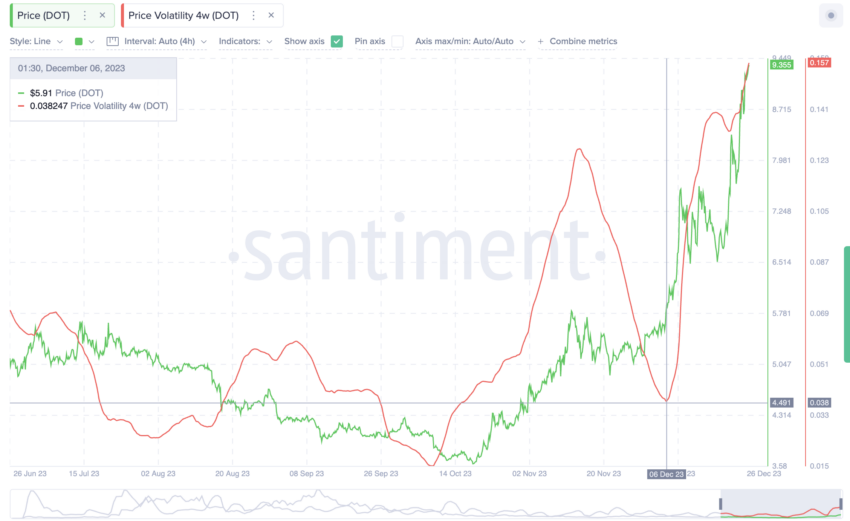
The rise in trading volume and an incoming drop in volatility might positively impact the average trading price of DOT in the short and mid-term.
DOT price prediction and technical analysis
Our early 2023 analysis
We identified key resistance levels for DOT in 2023. Here is how we approached the same:
Let us start with a short-term price analysis for DOT. The upper trendline breakout from the falling wedge pattern is obvious. Interestingly, the price of DOT, upon breakout, came quite close to breaching the immediate resistance level of $7.77.
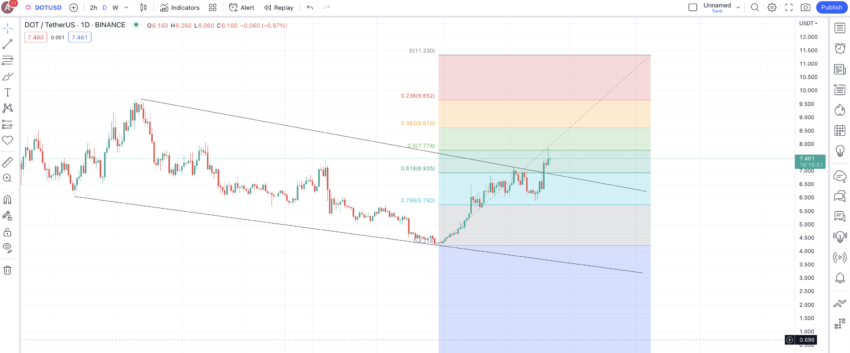
DOT is currently trading at $7.46 and will need to breach $7.77 and even $8.61 with high trading volume to have a chance at crossing $10.
However, the momentum indicator might play spoilsport here. The bearish divergence at RSI is visible. Therefore, a short-term correction might not be out of the question. If the price of DOT drops below the $6 mark, the bullish optimism might be invalidated.
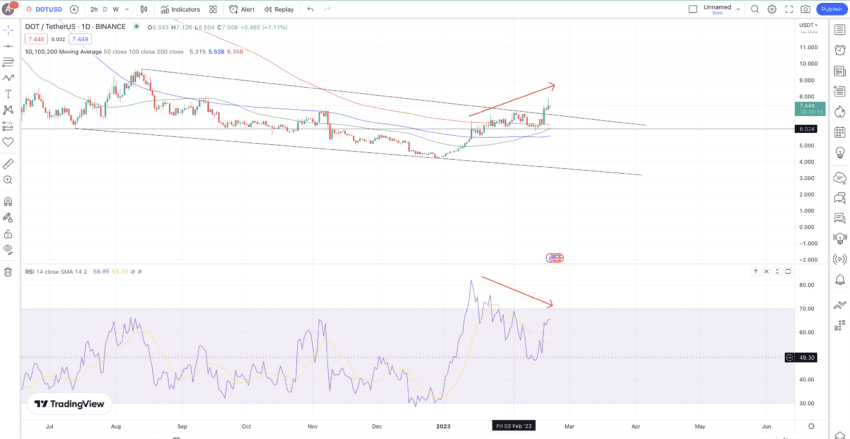
Yet, you also need to monitor the moving averages closely. The green or 50-day moving average has recently crossed above the 100-day line (blue) and is inching toward the 200-day line (red).
Our December 2023 analysis
As predicted during the volatility analysis, a short-term dip might be incoming for DOT. The clearest validation of this has to be the bearish divergence posed by the Relative Strength Index indicator. Additionally, the ascending wedge is clear, with the lower trendline offering support to DOT.
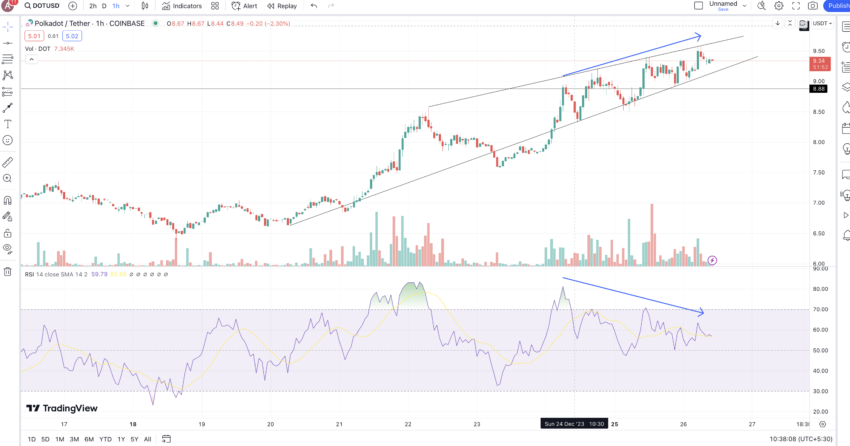
A drop under the $8.88 level can trigger a deeper correction.
Previously, it broke out of a wedge pattern as well:
While these predictions are short-term, we can check the weekly price chart of DOT to track the long-term price movements and identify any clear patterns.
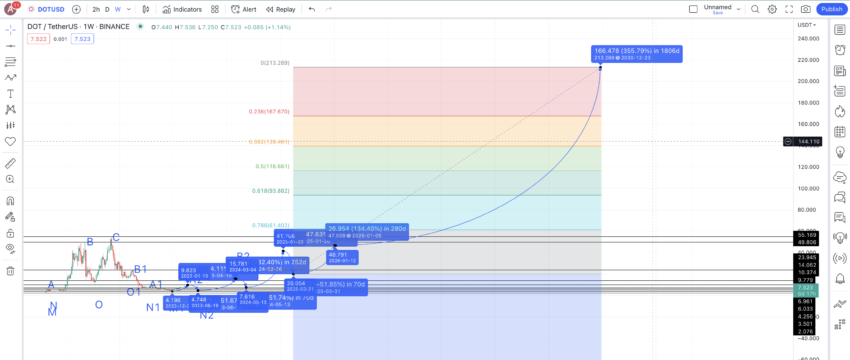
Pattern identification
A bullish RSI divergence is clear on the weekly chart. Therefore, you can expect DOT to make a new weekly high soon, which might defeat and conclude the existing pattern.
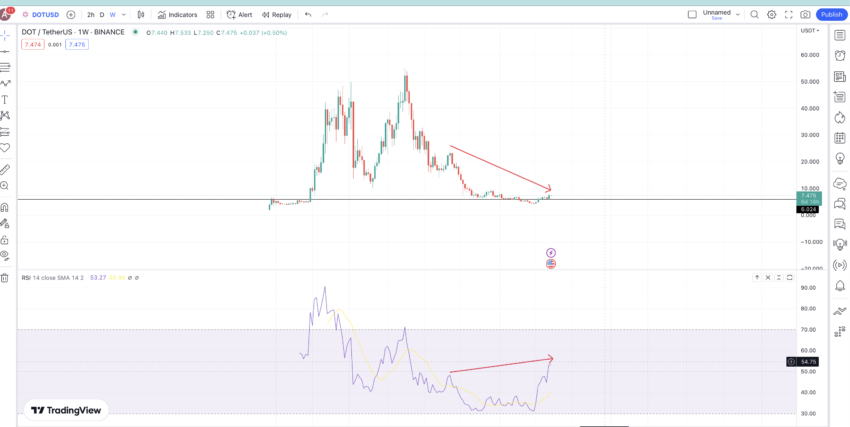
We can see DOT making a couple of clear higher highs before reaching the peak of $55. Post the peak, there are two lower highs before the current RSI divergence hints at a pattern conclusion.
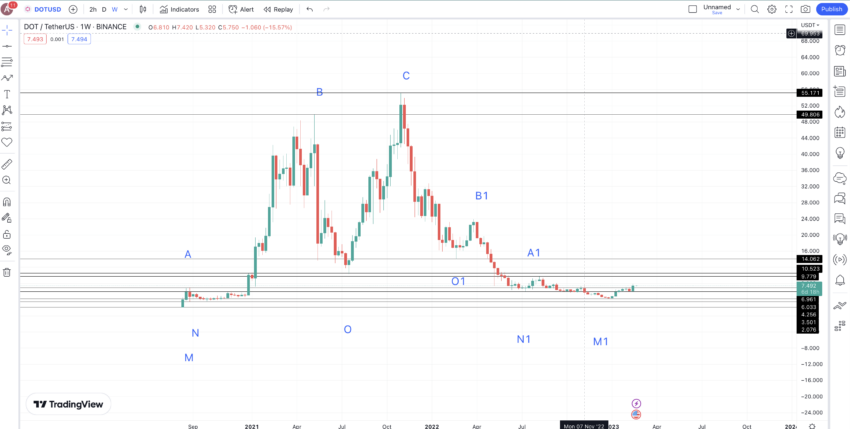
Price change
Now that we have the pattern, we must locate the average price percentage and distance for the next low-to-high and high-to-low points. For that, we will need data.
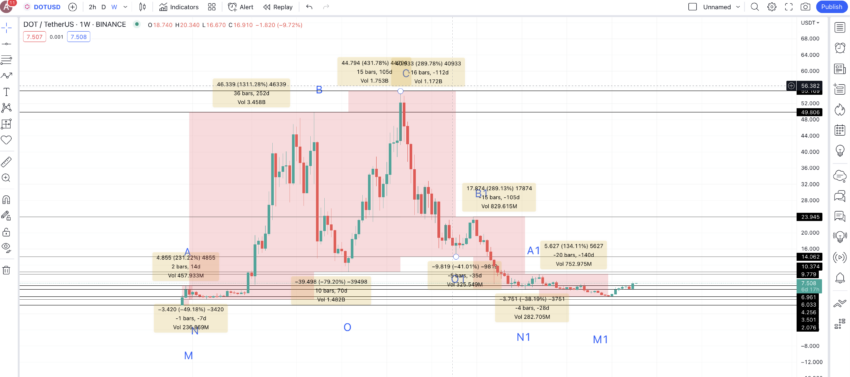
Let us locate the distance between the points for two specific paths: M to C and M1 to C (this one is in reverse of the actual flow).
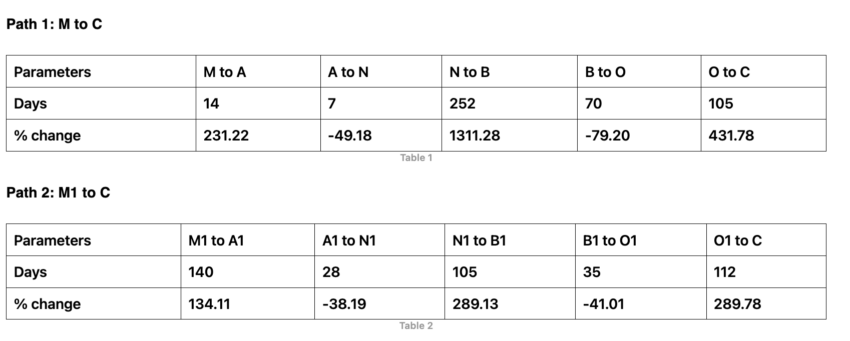
We can identify the average price percentage changes for Polkadot (DOT) from the datasets provided in both low-to-high and high-to-low movements. The low-to-high increase, calculated using non-negative values, averages 447.88%, with a timeframe ranging from 14 to 252 days per the data tables.
The average for high-to-low decreases, using negative values, is -51.89%, occurring over a period ranging from seven to 70 days, according to the table-specific datasets.
Depending on current market conditions, peak movements from low to high are expected to vary between 134.11% and the average of 447.88%. High-to-low dips will likely adhere to strong support levels in bullish crypto market scenarios. This information is now ready to plot price predictions for Polkadot (DOT).
Polkadot (DOT) price prediction 2023
We predicted a 2023 high of $9.8 for DOT. And it is already trading at $9.35. Read on to know more about our successful 2023 price analysis:
The last point on the weekly chart is M1. Considering the current market condition, we can expect the next high to surface in the next 105 days (between 14 and 252 days) and at a percentage peak of 134.11% (per table 2). This is the lowest low-to-high percentage growth value per the tables above. And this growth level seems more than expected in a volatile market.
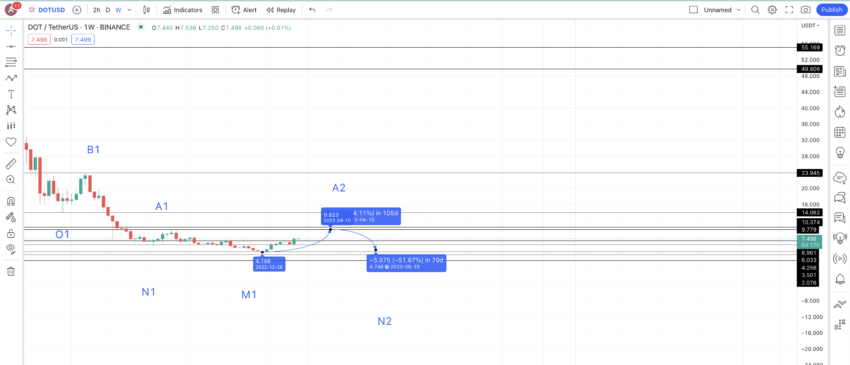
Hence, we can expect the next high or A2 to surface at $9.823. This would be the DOT price prediction for 2023. As for the low, post reaching the high of almost $10, we can expect some sell-off at DOT’s counter. This might push the prices by -51.89% (using data from above). This means the minimum price prediction for DOT in 2023 could take support at $4.75.
Polkadot (DOT) price prediction 2024
Outlook: Bullish
By 2024, we can expect the Polkadot price forecast to pick up some momentum courtesy of the higher high and higher low formations. Therefore, from N2, we can expect a growth of 231.22% (second lowest growth percentage).
In 252 days (max timeline), this projection can put the DOT price forecast for 2024 at $15.78. The minimum price of DOT in 2024 could drop as far as 51.89% (the average high-to-low drop). Therefore, the lowest Polkadot price forecast for 2024 could surface at $7.62.
Projected ROI from the current level: 68%
Polkadot (DOT) price prediction 2025
Outlook: Bullish
By 2024, we expect DOT’s trading volume and market cap to improve. Hence, the price projection for 2025 could follow the average price hike of 447.88% (from the tables above). Also, by 2025 we can expect a bull market to be in action, making the 2024-25 growth of almost 450% possible.
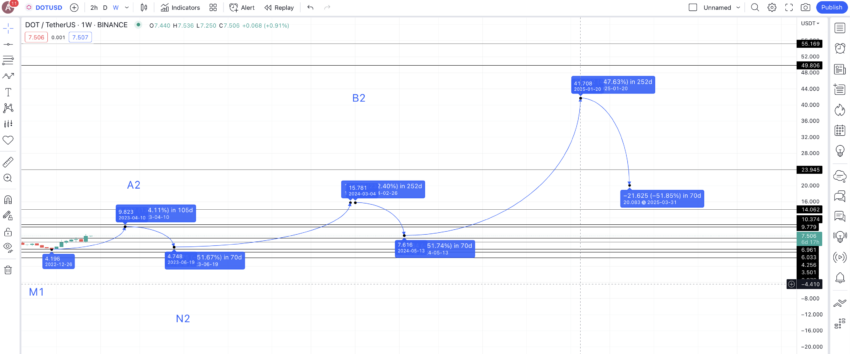
Hence, the DOT price prediction in 2025 could surface at $41.71. The lowest DOT price prediction in 2025 could take support at $20.08 — considering the average dip percentage of 51.89%.
Projected ROI from the current level: 346%
Polkadot (DOT) price prediction 2030
Outlook: Very bullish
Now, from the low in 2025, we expect the price of DOT to follow a less aggressive price path for a while, considering two main possible events:
- Market-wide sell-off once the price reaches $41
- Increase in circulating supply, with DOT coins going up to 1.5 billion by 2025
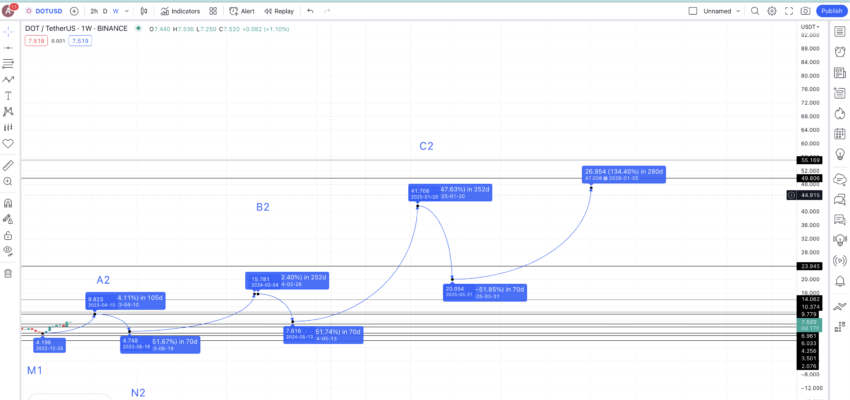
Hence, a percentage hike of 134.11% from the 2025 low looks at par with expectations, which might put the high in 2026 at $47.08.
We can connect this high and 2025 low to extrapolate the price of DOT till 2030.
The same growth trajectory till 2026 ensures that the Polkadot (DOT) price predictions till 2030 might land near the $213.27 mark. However, for the price of DOT to cross $200 by 2030, it must exceed the current maximum price of $55 by 2027.
Projected ROI from the current level: 2180%
Polkadot (DOT’s) long-term price prediction (up to 2035)
Outlook: Bullish
Now that we have the Polkadot (DOT) price predictions till 2030, we can extrapolate our findings through 2035 using the following table.
You can easily convert your DOT to USD here
| Year | | Maximum price of DOT | | Minimum price of DOT |
| 2023 | $9.35 | $3.64 |
| 2024 | $15.78 | $7.62 |
| 2025 | $41.71 | $20.08 |
| 2026 | $62.56 | $48.80 |
| 2027 | $81.33 | $63.43 |
| 2028 | $121.99 | $95.15 |
| 2029 | $146.39 | $114.18 |
| 2030 | $213.27 | $132.22 |
| 2031 | $287.91 | $224.56 |
| 2032 | $431.87 | $336.85 |
| 2033 | $647.80 | $401.63 |
| 2034 | $777.37 | $606.34 |
| 2035 | $971.71 | $757.93 |
Note: The average trading price levels, per the table above, will hold only if the Polkadot network keeps seeing steady growth and adoption over time.
Is this DOT price prediction theory accurate enough?
Our DOT price prediction theory considers the Polkadot protocol’s current state. It also employs a data-backed short-term and long-term technical analysis to cover every price-specific possibility relevant to DOT. This makes the price prediction practical and relatable to broader market movements. Over time, we expect this project from Gavin Wood and the team to grow in stature and reach higher average trading price levels in the coming years.
Frequently asked questions
Will DOT reach $100?
What will Polkadot be worth in 2025?
What is the highest price of Polkadot ever?
Disclaimer
In line with the Trust Project guidelines, the educational content on this website is offered in good faith and for general information purposes only. BeInCrypto prioritizes providing high-quality information, taking the time to research and create informative content for readers. While partners may reward the company with commissions for placements in articles, these commissions do not influence the unbiased, honest, and helpful content creation process. Any action taken by the reader based on this information is strictly at their own risk. Please note that our Terms and Conditions, Privacy Policy, and Disclaimers have been updated.


